
This article is based on publicly available IR materials and is not a recommendation to buy or sell any specific securities.
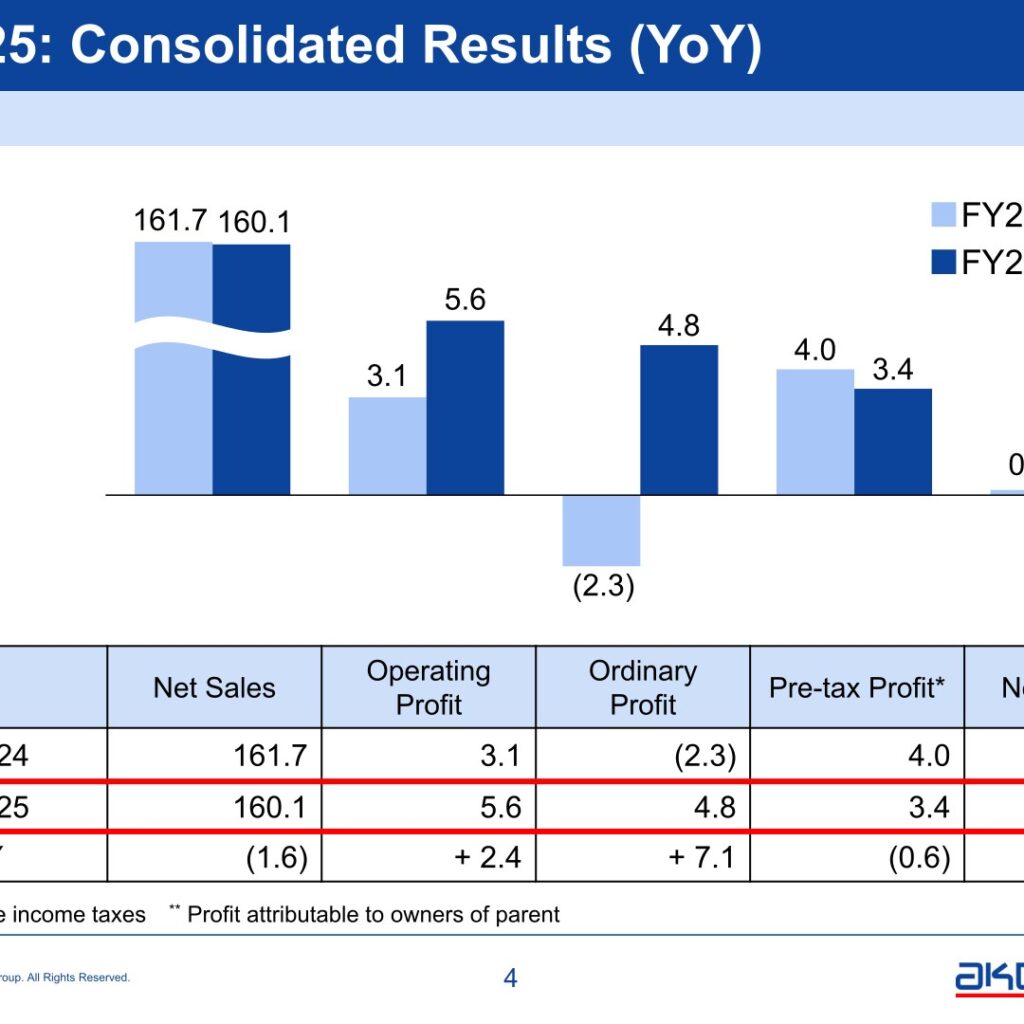
Akebono Brake Industry Co., Ltd. reported FY2025 net sales of 160.1 billion yen, down 1.6 billion yen from FY2024, while operating profit rose 2.4 billion yen to 5.6 billion yen. Ordinary profit swung to a profit of 4.8 billion yen from a loss of 2.3 billion yen a year earlier, and net profit (profit attributable to owners of parent) rose 1.7 billion yen to 1.8 billion yen. For FY2026 the company forecasts net sales of 140.9 billion yen alongside higher profit at every line, including operating profit of 7.0 billion yen.
Note on the reporting period: the presentation states that the consolidated fiscal year under review (FY2025) is defined as January 1, 2025 to December 31, 2025 for North America, China, Thailand and Indonesia, and April 1, 2025 to March 31, 2026 for Japan and Europe.
Consolidated Results (Full-Year Actual)
Net sales decreased by 1.6 billion yen from FY2024. The company notes a negative FOREX impact of 1.3 billion yen, so the actual sales decrease was 0.3 billion yen. In the sales bridge, volume fluctuation was (2.5) billion yen and price fluctuation (reflection in sales prices etc.) was +2.2 billion yen.
| Item | FY2025 | FY2024 | YoY |
|---|---|---|---|
| Net Sales | 160.1 | 161.7 | (1.6) |
| Operating Profit | 5.6 | 3.1 | + 2.4 |
| Ordinary Profit | 4.8 | (2.3) | + 7.1 |
| Pre-tax Profit (profit before income taxes) | 3.4 | 4.0 | (0.6) |
| Net Profit (profit attributable to owners of parent) | 1.8 | 0.2 | + 1.7 |
In the operating profit bridge, cost reduction contributed +1.7 billion yen, fixed costs +0.6 billion yen and price fluctuation +2.2 billion yen, while volume fluctuation and model mix was (0.9) billion yen and labor costs were (1.2) billion yen; FOREX was (0.0) billion yen. Below operating profit, ordinary profit improved by 7.1 billion yen, helped by FOREX of +3.4 billion yen (a loss of 1.9 billion yen in FY2024 turning to a gain of 1.6 billion yen in FY2025 on yen depreciation) and financing expenses of +1.7 billion yen (a decrease in refinancing expenses incurred in FY2024). At the net profit line, gain on sale of non-current assets rose from 0.1 to 0.6 billion yen on the sale of land and building for the Elizabethtown plant (U.S.) closure, while gain on sale of investment securities fell from 9.0 to 0.0 billion yen; income taxes-deferred contributed +2.4 billion yen, as deferred tax assets due to using loss carryforwards were reversed in FY2024 and deferred tax assets were recognized based on the Medium-Term Business Plan in FY2025.
Results by Region
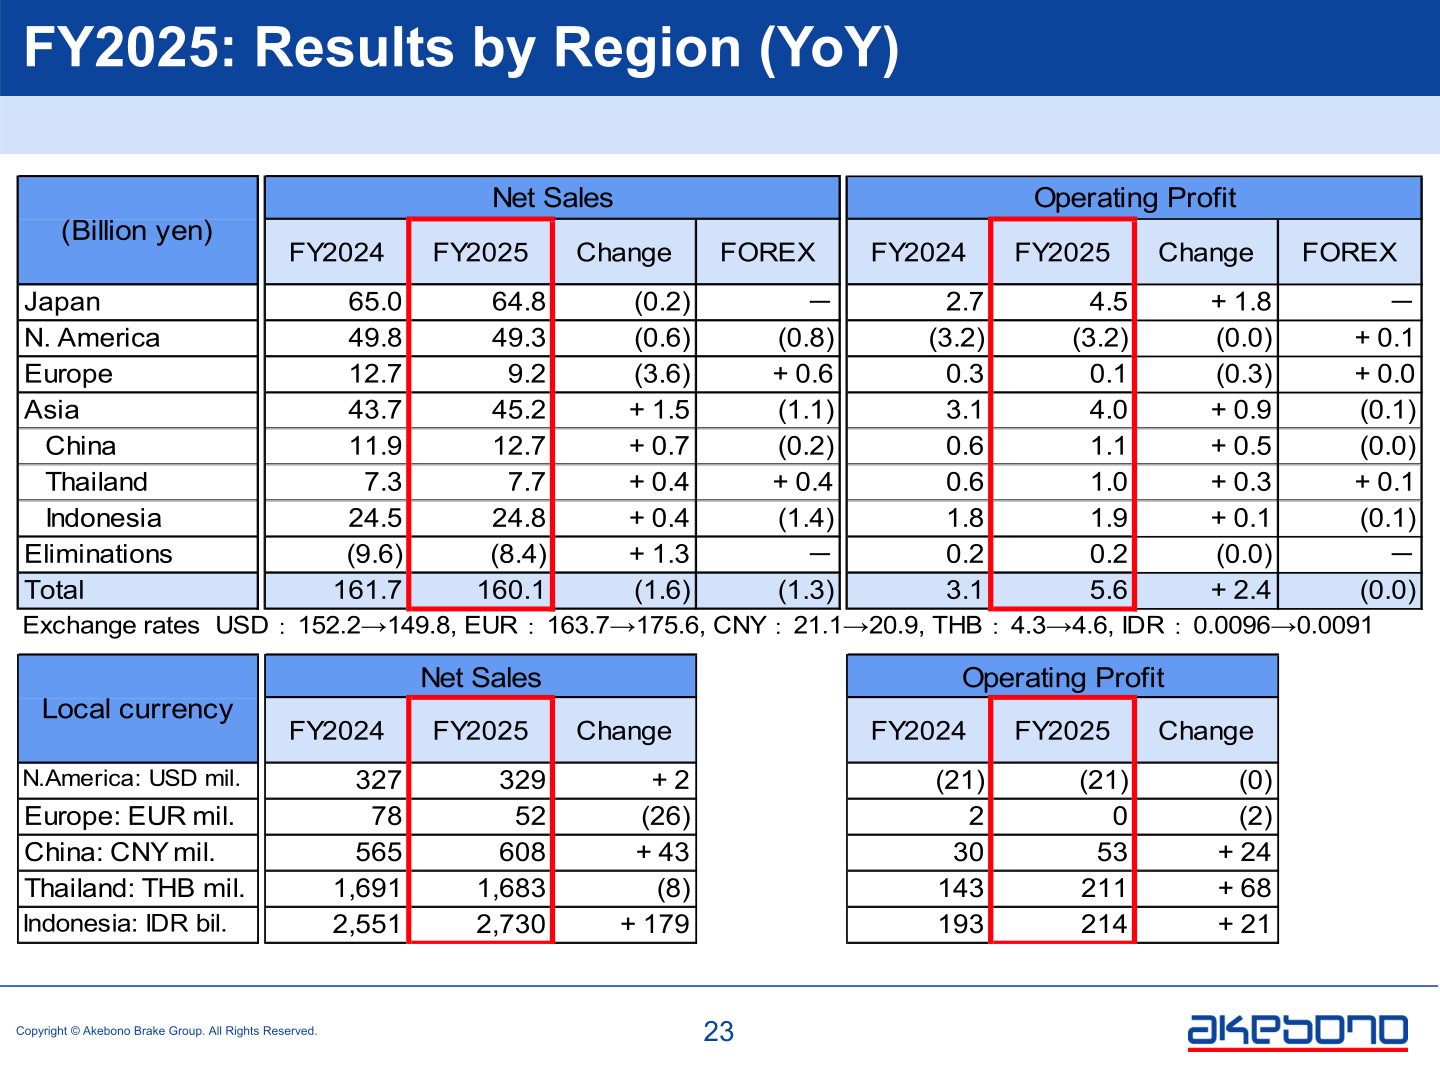
In Japan, net sales edged down 0.2 billion yen to 64.8 billion yen while operating profit rose 1.8 billion yen to 4.5 billion yen. Automotive business net sales decreased mainly due to a decline in production caused by a slowdown in sales for some automakers and the transfer of production of high-performance products to Europe; aftermarket net sales increased on higher orders from some domestic automakers and commercial vehicle manufacturers as well as strong demand in overseas markets; and I.M./R.S. (industrial machinery / rolling stock) net sales increased on higher orders for rolling stock products despite a decrease in orders for forklift products in North America.
In North America, net sales decreased 0.6 billion yen to 49.3 billion yen and the operating loss was unchanged at (3.2) billion yen. In the U.S., net sales decreased on lower orders from the termination of production for certain vehicle models and reduced production volumes as well as yen appreciation, and the operating loss increased slightly on rising wages, higher labor costs for additional temporary employment for inventory buildup ahead of the closure of the Elizabethtown plant, and an increase in expenses including the impact of tariffs. In Mexico, net sales increased on orders for new vehicle models launched in the second half of FY2024, and operating profit increased slightly on higher orders and cost reductions.
Europe saw net sales fall 3.6 billion yen to 9.2 billion yen and operating profit fall 0.3 billion yen to 0.1 billion yen, on the termination of production for certain vehicle models in line with model changes and a significant decline in orders caused by automakers’ production volumes. In China, net sales rose 0.7 billion yen to 12.7 billion yen and operating profit rose 0.5 billion yen to 1.1 billion yen, helped by the launch of new products for Chinese automakers, labor cost reductions and measures to optimize raw material costs. In ASEAN (Thailand, Indonesia and Vietnam), net sales rose from 31.8 to 32.5 billion yen and operating profit rose from 2.5 to 2.9 billion yen.
| Region | Net Sales FY2025 | Net Sales FY2024 | Operating Profit FY2025 | Operating Profit FY2024 |
|---|---|---|---|---|
| Japan | 64.8 | 65.0 | 4.5 | 2.7 |
| N. America | 49.3 | 49.8 | (3.2) | (3.2) |
| Europe | 9.2 | 12.7 | 0.1 | 0.3 |
| Asia | 45.2 | 43.7 | 4.0 | 3.1 |
| China | 12.7 | 11.9 | 1.1 | 0.6 |
| Thailand | 7.7 | 7.3 | 1.0 | 0.6 |
| Indonesia | 24.8 | 24.5 | 1.9 | 1.8 |
| Eliminations | (8.4) | (9.6) | 0.2 | 0.2 |
| Total | 160.1 | 161.7 | 5.6 | 3.1 |
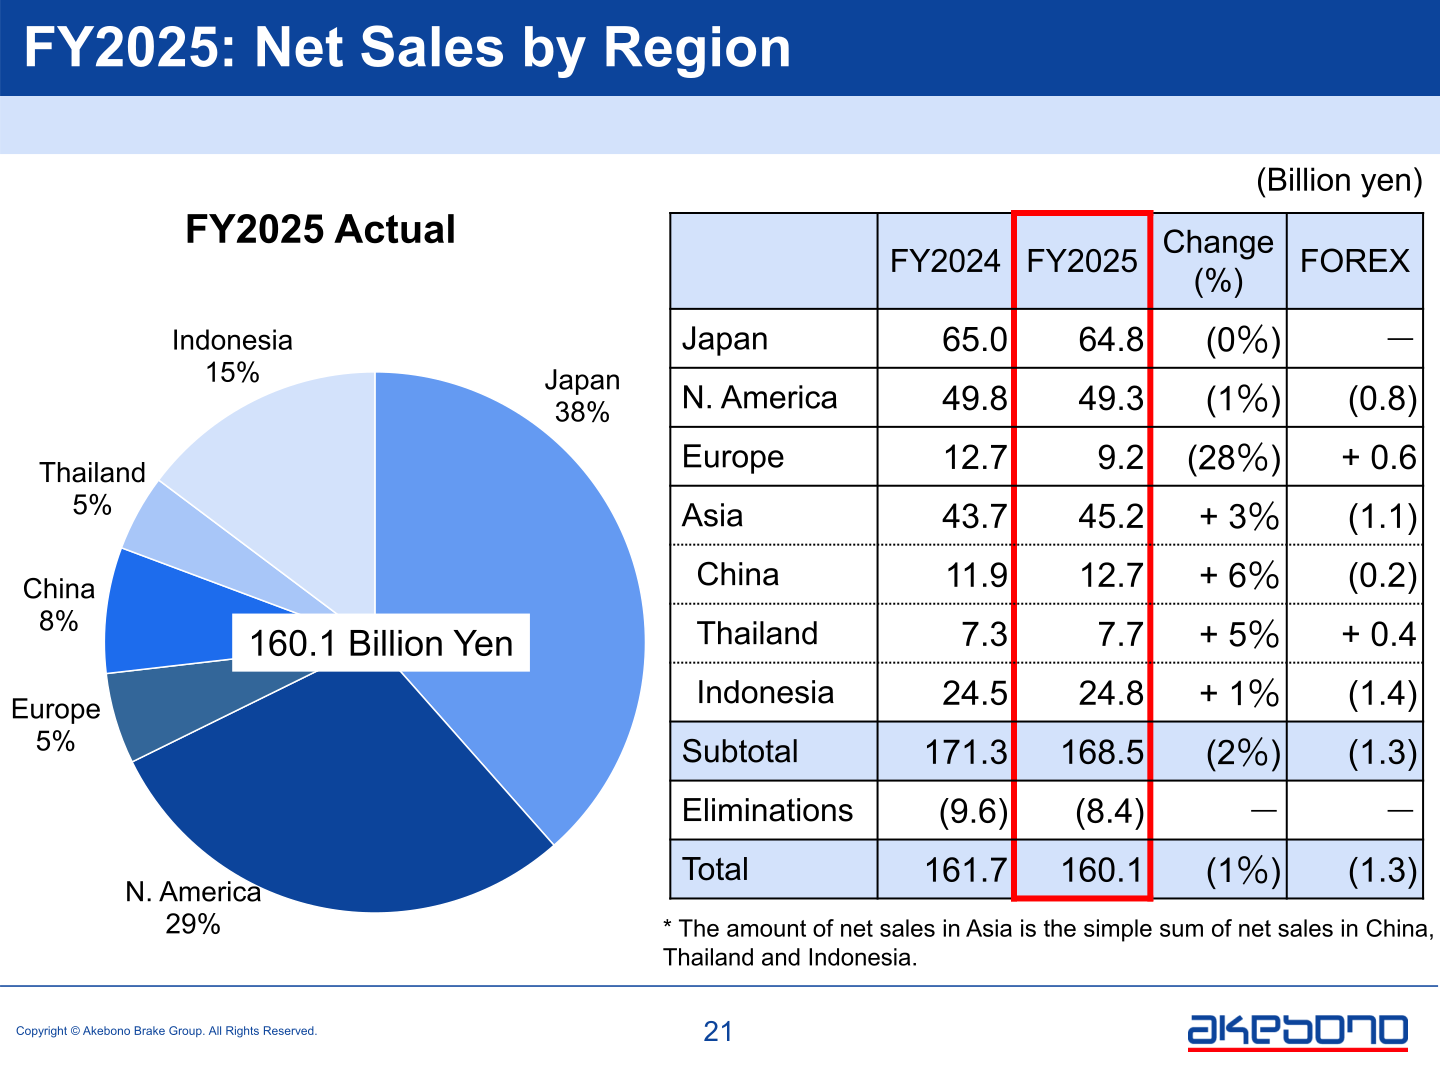
By share of net sales, Japan accounted for 38%, N. America 29%, Indonesia 15%, China 8%, Europe 5% and Thailand 5% of the 160.1 billion yen total. By customer, Toyota represented 22% of net sales in FY2025 (20% in FY2024), followed by Nissan at 10% (11%), Isuzu at 9% (8%), Distributors at 8% (7%), Honda at 7% (8%), and Yamaha, I.M./R.S., VW and Daihatsu at 6% each.
Balance Sheet and Cash Flows
Total assets increased 0.5 billion yen to 128.8 billion yen as of March 31, 2026. Cash and deposits were 18.1 billion yen, accounts receivable 29.4 billion yen, inventories 17.3 billion yen and tangible assets 48.3 billion yen. On the liabilities and net assets side, accounts payable were 16.3 billion yen, interest-bearing debts 35.2 billion yen and net assets 57.6 billion yen, of which equity capital was 50.5 billion yen. The equity ratio improved from 38.6% to 39.2%, while the net debt equity ratio was unchanged at 0.34 times.
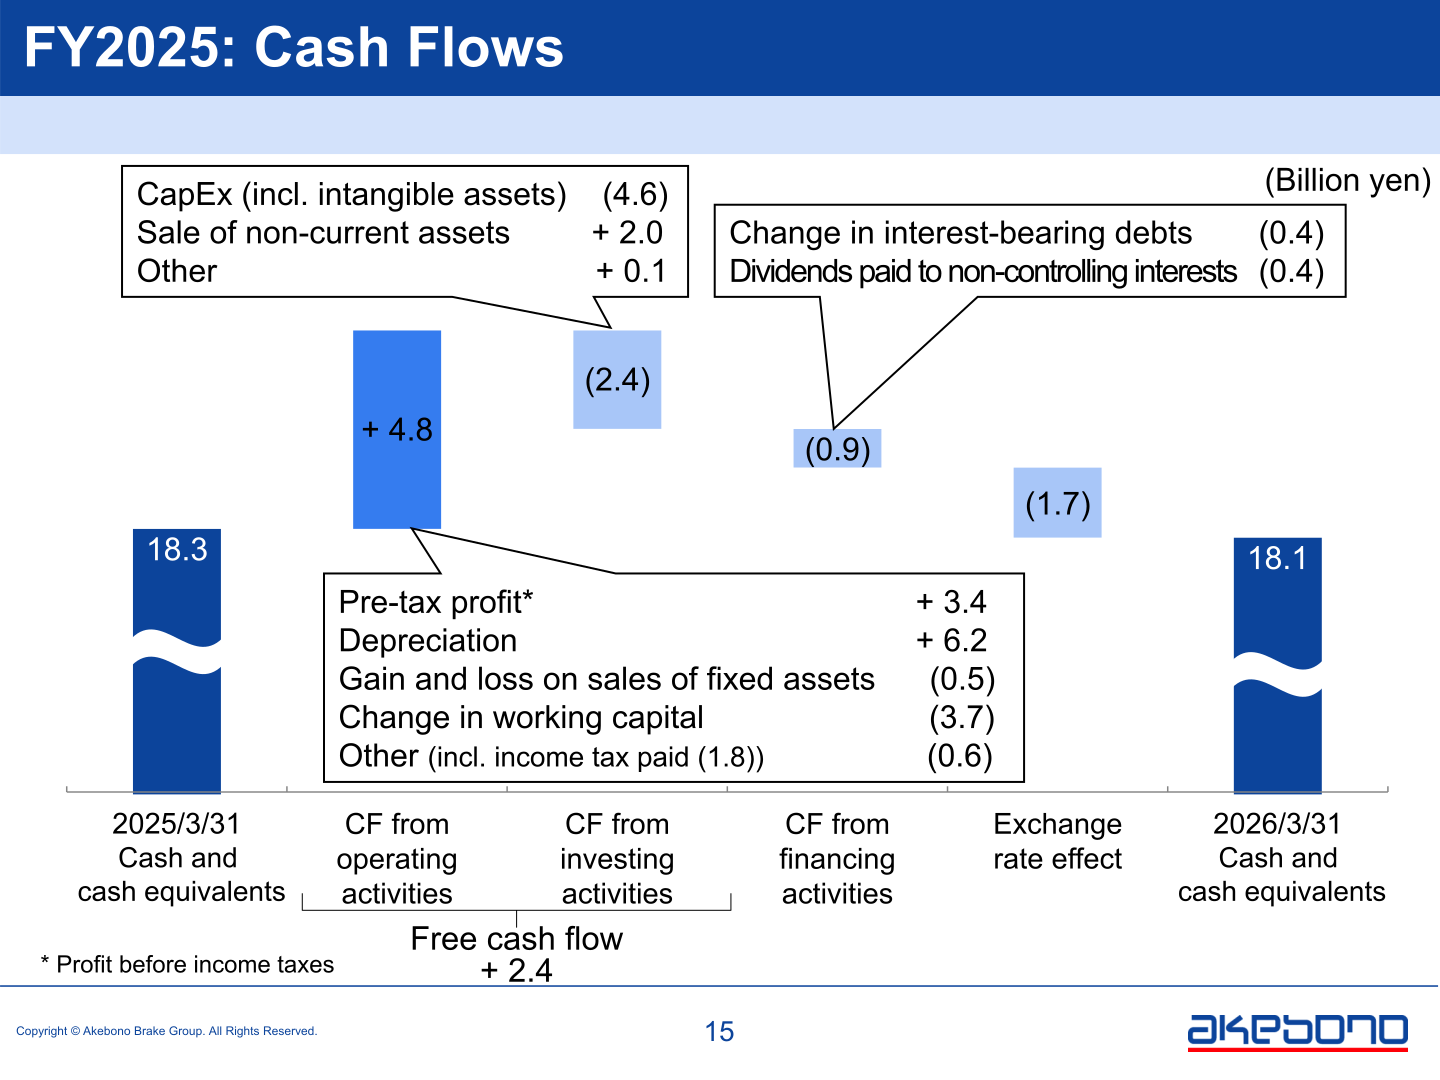
Cash and cash equivalents were 18.1 billion yen at March 31, 2026 versus 18.3 billion yen a year earlier. Cash flow from operating activities was +4.8 billion yen (pre-tax profit +3.4 billion yen, depreciation +6.2 billion yen, change in working capital (3.7) billion yen), cash flow from investing activities was (2.4) billion yen (CapEx including intangible assets (4.6) billion yen, sale of non-current assets +2.0 billion yen), and free cash flow was +2.4 billion yen. Cash flow from financing activities was (0.9) billion yen and the exchange rate effect was (1.7) billion yen.
FY2026 Forecast
For FY2026 the company forecasts net sales of 140.9 billion yen, down 19.2 billion yen, with operating profit of 7.0 billion yen (+1.4), ordinary profit of 5.2 billion yen (+0.4), pre-tax profit of 5.0 billion yen (+1.6) and net profit of 2.5 billion yen (+0.7). The sales decline reflects a negative volume fluctuation impact of 21.5 billion yen — including 10.3 billion yen from shifting to a one-plant structure in the U.S. and 7.6 billion yen from the transfer of equity interests in the subsidiary in Guangzhou, China, which was reclassified from a consolidated subsidiary to an equity-method affiliate — plus a negative price fluctuation impact of 0.7 billion yen and a positive FOREX impact of 3.0 billion yen.
| Item | FY2026 Forecast | FY2025 (Actual) | YoY |
|---|---|---|---|
| Net Sales | 140.9 | 160.1 | (19.2) |
| Operating Profit | 7.0 | 5.6 | + 1.4 |
| Ordinary Profit | 5.2 | 4.8 | + 0.4 |
| Pre-tax Profit | 5.0 | 3.4 | + 1.6 |
| Net Profit | 2.5 | 1.8 | + 0.7 |
| Region | Net Sales FY2026 Forecast | Net Sales FY2025 Actual | Operating Profit FY2026 Forecast | Operating Profit FY2025 Actual |
|---|---|---|---|---|
| Japan | 60.4 | 64.8 | 2.8 | 4.5 |
| N. America | 40.6 | 49.3 | 0.0 | (3.2) |
| Europe | 5.9 | 9.2 | 0.2 | 0.1 |
| Asia | 41.4 | 45.2 | 3.7 | 4.0 |
| China | 6.1 | 12.7 | 0.2 | 1.1 |
| Thailand | 9.1 | 7.7 | 1.0 | 1.0 |
| Indonesia | 26.2 | 24.8 | 2.5 | 1.9 |
| Eliminations | (7.4) | (8.4) | 0.3 | 0.2 |
| Total | 140.9 | 160.1 | 7.0 | 5.6 |
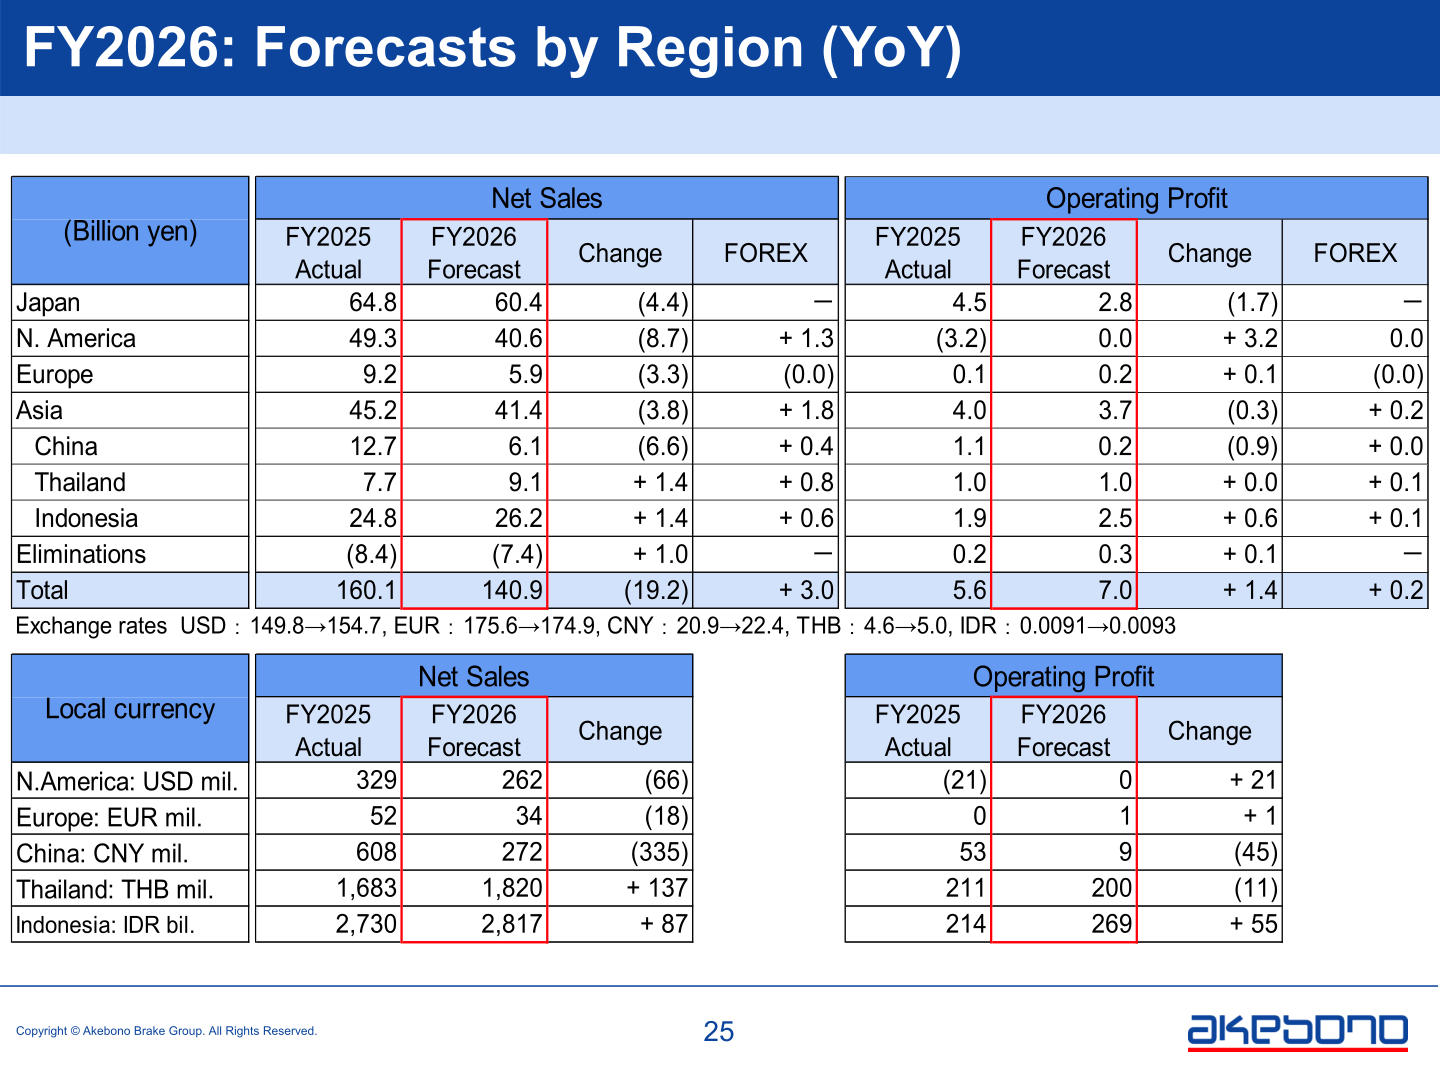
In the operating profit forecast bridge, cost reduction adds +1.8 billion yen, fixed costs +1.0 billion yen, price fluctuation +0.3 billion yen and FOREX +0.2 billion yen, while volume fluctuation and model mix is (1.3) billion yen and labor costs are (0.7) billion yen. North America is forecast to reach break-even operating profit of 0.0 billion yen from a loss of 3.2 billion yen, a swing of +3.2 billion yen, while Japan is forecast at 2.8 billion yen, down 1.7 billion yen. The assumed exchange rates move from USD 149.8 to 154.7, EUR 175.6 to 174.9, CNY 20.9 to 22.4, THB 4.6 to 5.0 and IDR 0.0091 to 0.0093.
Shareholder Returns
The presentation does not address dividends or other shareholder returns. This cannot be confirmed from the materials.
Forward-Looking Statements
The company states that the description pertaining to its forecasts is based on the information available at the time and on assumptions it believes are reasonable, and that actual results may differ from the forecasts due to the surrounding business environment including market conditions, foreign exchange rates and other unexpected reasons.
This article is an analysis based on publicly available information and is not a recommendation to buy or sell any specific securities. Investment decisions are your own responsibility.
![[Obayashi] Investors’ Guide 2026 — The Complete 24-Article Breakdown](https://japan-equity.com/wp-content/uploads/2026/07/hub_cover-1024x1024.png)
![[Obayashi] IR & SR Policy — Feeding Dialogue Back into Management](https://japan-equity.com/wp-content/uploads/2026/07/p32_sq-1024x1024.jpg)
![[Obayashi] Real Estate Development — 18.7% Margin, ¥287.7bn Unrealized Gains](https://japan-equity.com/wp-content/uploads/2026/07/p20_sq-1024x1024.jpg)
![[Obayashi] Domestic Civil Engineering — Resilience Spending Supports 9.6% Margin](https://japan-equity.com/wp-content/uploads/2026/07/p11_sq-1024x1024.jpg)
![[Obayashi] Share Price & External Ratings — vs TOPIX, ESG Index Inclusion](https://japan-equity.com/wp-content/uploads/2026/07/p40_sq-1024x1024.jpg)
![[Construction] ¥75.5tn Investment, Shrinking Workforce — Big-5 Market Share](https://japan-equity.com/wp-content/uploads/2026/07/p12_sq-1024x1024.jpg)



![[Obayashi] Capital Policy & Shareholder Returns — ROE 10%+, DOE ~5%, ¥100bn Buyback](https://japan-equity.com/wp-content/uploads/2026/07/p27_sq-1024x1024.jpg)
![[Obayashi] Reducing Cross-Shareholdings — ¥285.2bn Sold in Five Years](https://japan-equity.com/wp-content/uploads/2026/07/p29_sq-1024x1024.jpg)
![[Obayashi] ¥750bn Investment Plan — ¥300bn to Development, ¥190bn to Tech/DX](https://japan-equity.com/wp-content/uploads/2026/07/p30_sq-1024x1024.jpg)
![[Obayashi] MTP2022 KPIs — Operating Profit ~2x Target, ROE 14.4%](https://japan-equity.com/wp-content/uploads/2026/07/p25_sq-1024x1024.jpg)
![[Obayashi] Cash Allocation — ¥420bn Investment CF Over Five Years](https://japan-equity.com/wp-content/uploads/2026/07/p26_sq-1024x1024.jpg)
![[Obayashi] Green Energy — 44 Plants, 344MW, and the Green Hydrogen Challenge](https://japan-equity.com/wp-content/uploads/2026/07/p21_sq-1024x1024.jpg)
![[Obayashi] Tackling the Labor Shortage — Robotics Construction®](https://japan-equity.com/wp-content/uploads/2026/07/p14_sq-1024x1024.jpg)
