
This article is based on publicly available IR materials and is not a recommendation to buy or sell any specific securities.
Note: On this site the most recent completed fiscal year is classified as FY2025. HOCHIKI’s materials label this period FY3/2026 (the fiscal year ended March 31, 2026), and the labels used in the materials are retained throughout this article.
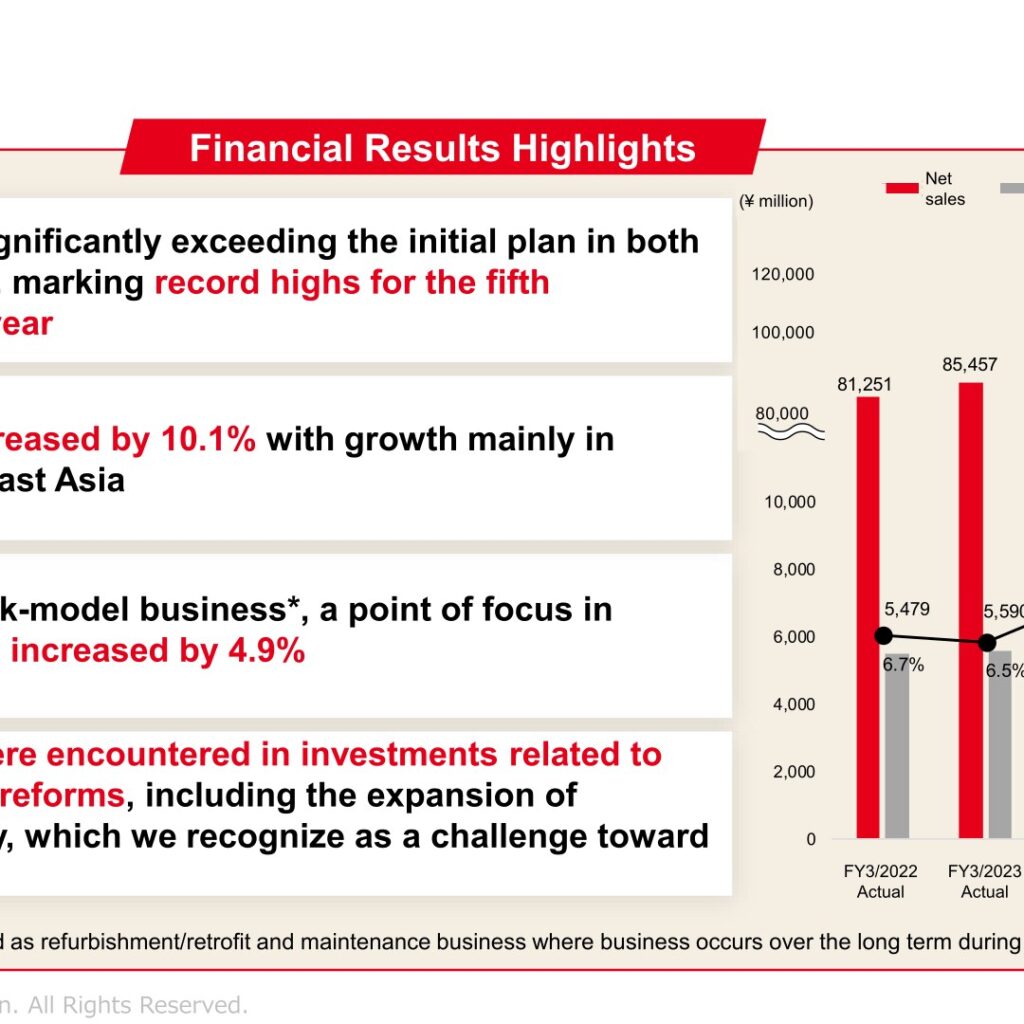
HOCHIKI CORPORATION (Securities Code: 6745) reported results for the fiscal year ended March 31, 2026 in its “Financial Summary for the Fiscal Year Ended March 31, 2026” dated May 19, 2026. Net sales rose 4.9% year on year to ¥105,855 million and operating profit rose 26.3% to ¥12,066 million, with results significantly exceeding the initial plan in both net sales and profit and marking record highs for the fifth consecutive fiscal year. Net sales from the stock-model business, a point of focus in the domestic business, increased by 4.9%, and overseas sales increased by 10.1% with growth mainly in Europe and Southeast Asia. The company notes, however, that delays were encountered in investments related to business structure reforms, including the expansion of production capacity, which it recognizes as a challenge toward Phase2 of its medium-term plan.
Consolidated Results (Full-Year Actual)
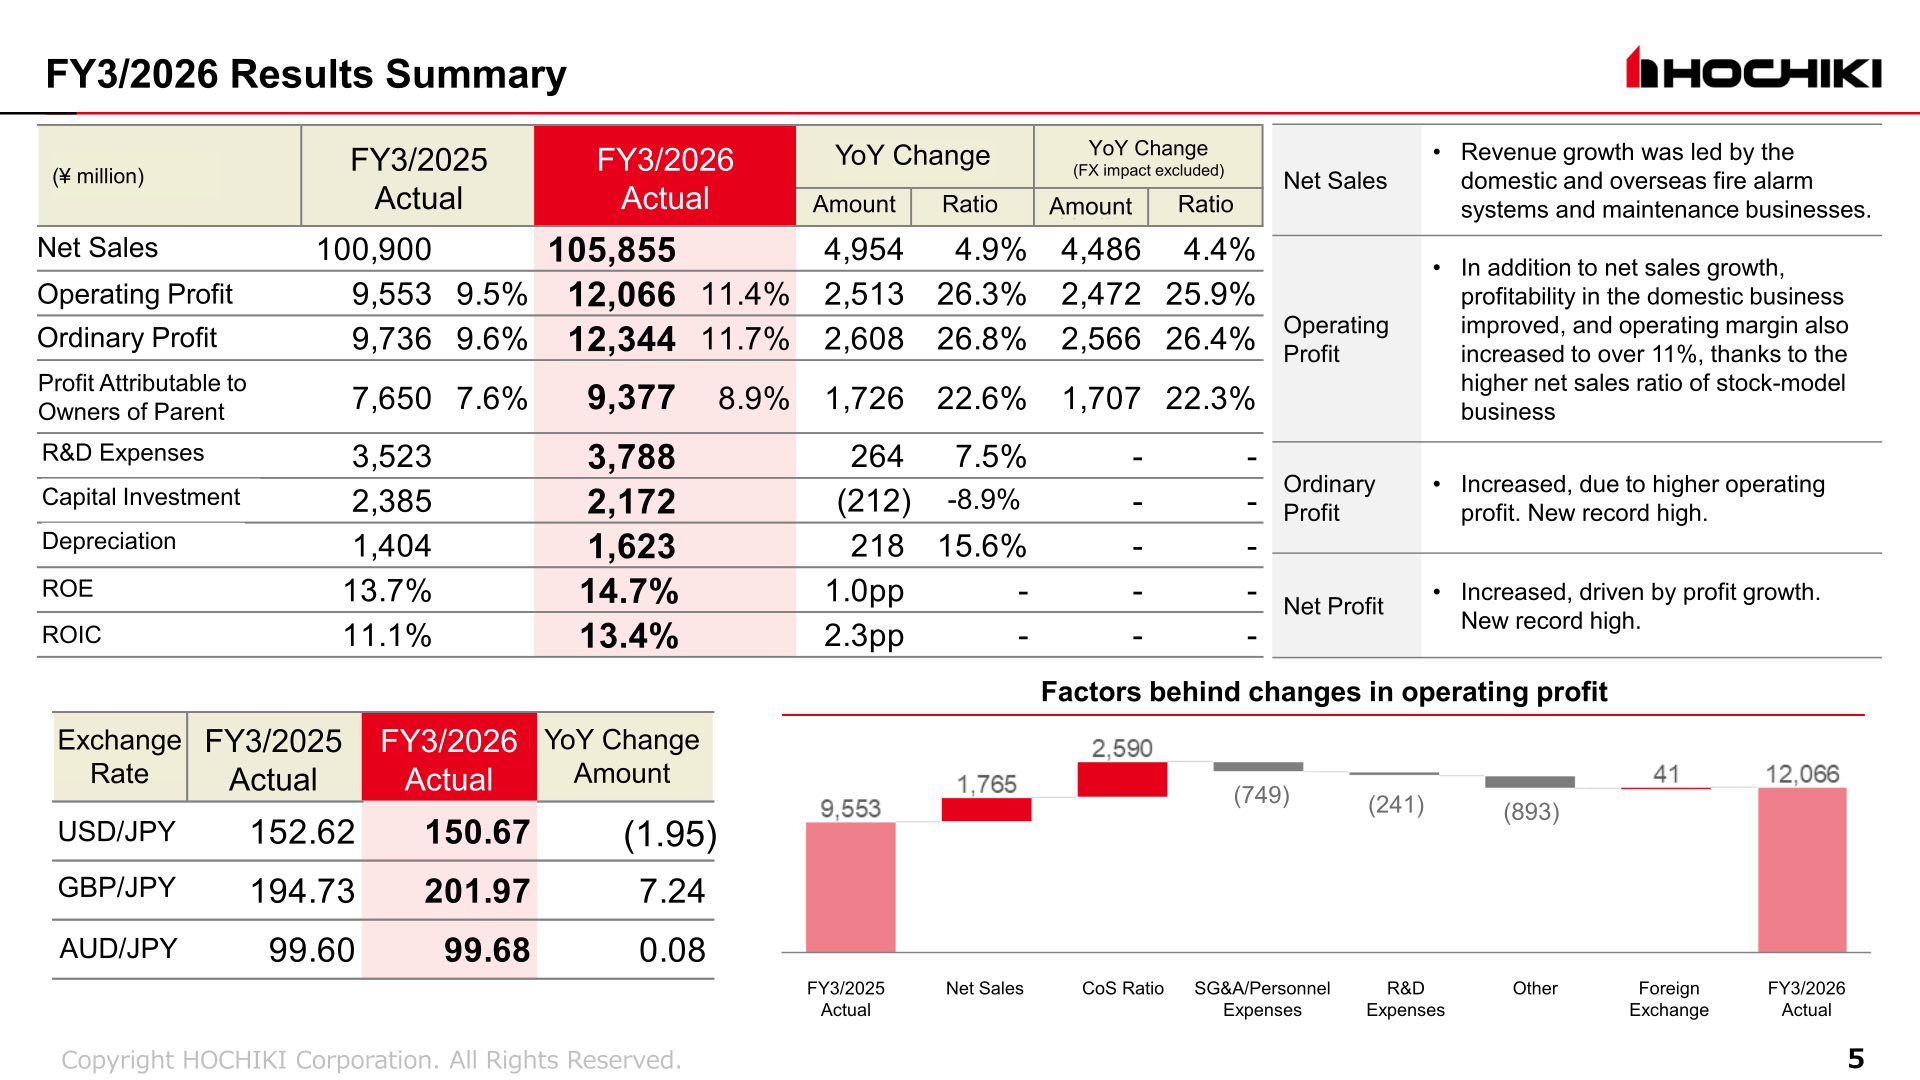
Revenue growth was led by the domestic and overseas fire alarm systems and maintenance businesses. In addition to net sales growth, profitability in the domestic business improved, and the operating margin increased to over 11% (11.4%, up from 9.5%), thanks to the higher net sales ratio of the stock-model business. Ordinary profit and profit attributable to owners of parent both increased to new record highs. ROE improved to 14.7% and ROIC to 13.4%.
| Item (¥ million) | FY3/2025 Actual | FY3/2026 Actual | YoY Change | YoY Ratio |
|---|---|---|---|---|
| Net Sales | 100,900 | 105,855 | 4,954 | 4.9% |
| Operating Profit | 9,553 (9.5%) | 12,066 (11.4%) | 2,513 | 26.3% |
| Ordinary Profit | 9,736 (9.6%) | 12,344 (11.7%) | 2,608 | 26.8% |
| Profit Attributable to Owners of Parent | 7,650 (7.6%) | 9,377 (8.9%) | 1,726 | 22.6% |
| R&D Expenses | 3,523 | 3,788 | 264 | 7.5% |
| Capital Investment | 2,385 | 2,172 | (212) | -8.9% |
| ROE | 13.7% | 14.7% | 1.0pp | – |
| ROIC | 11.1% | 13.4% | 2.3pp | – |
Segment Results
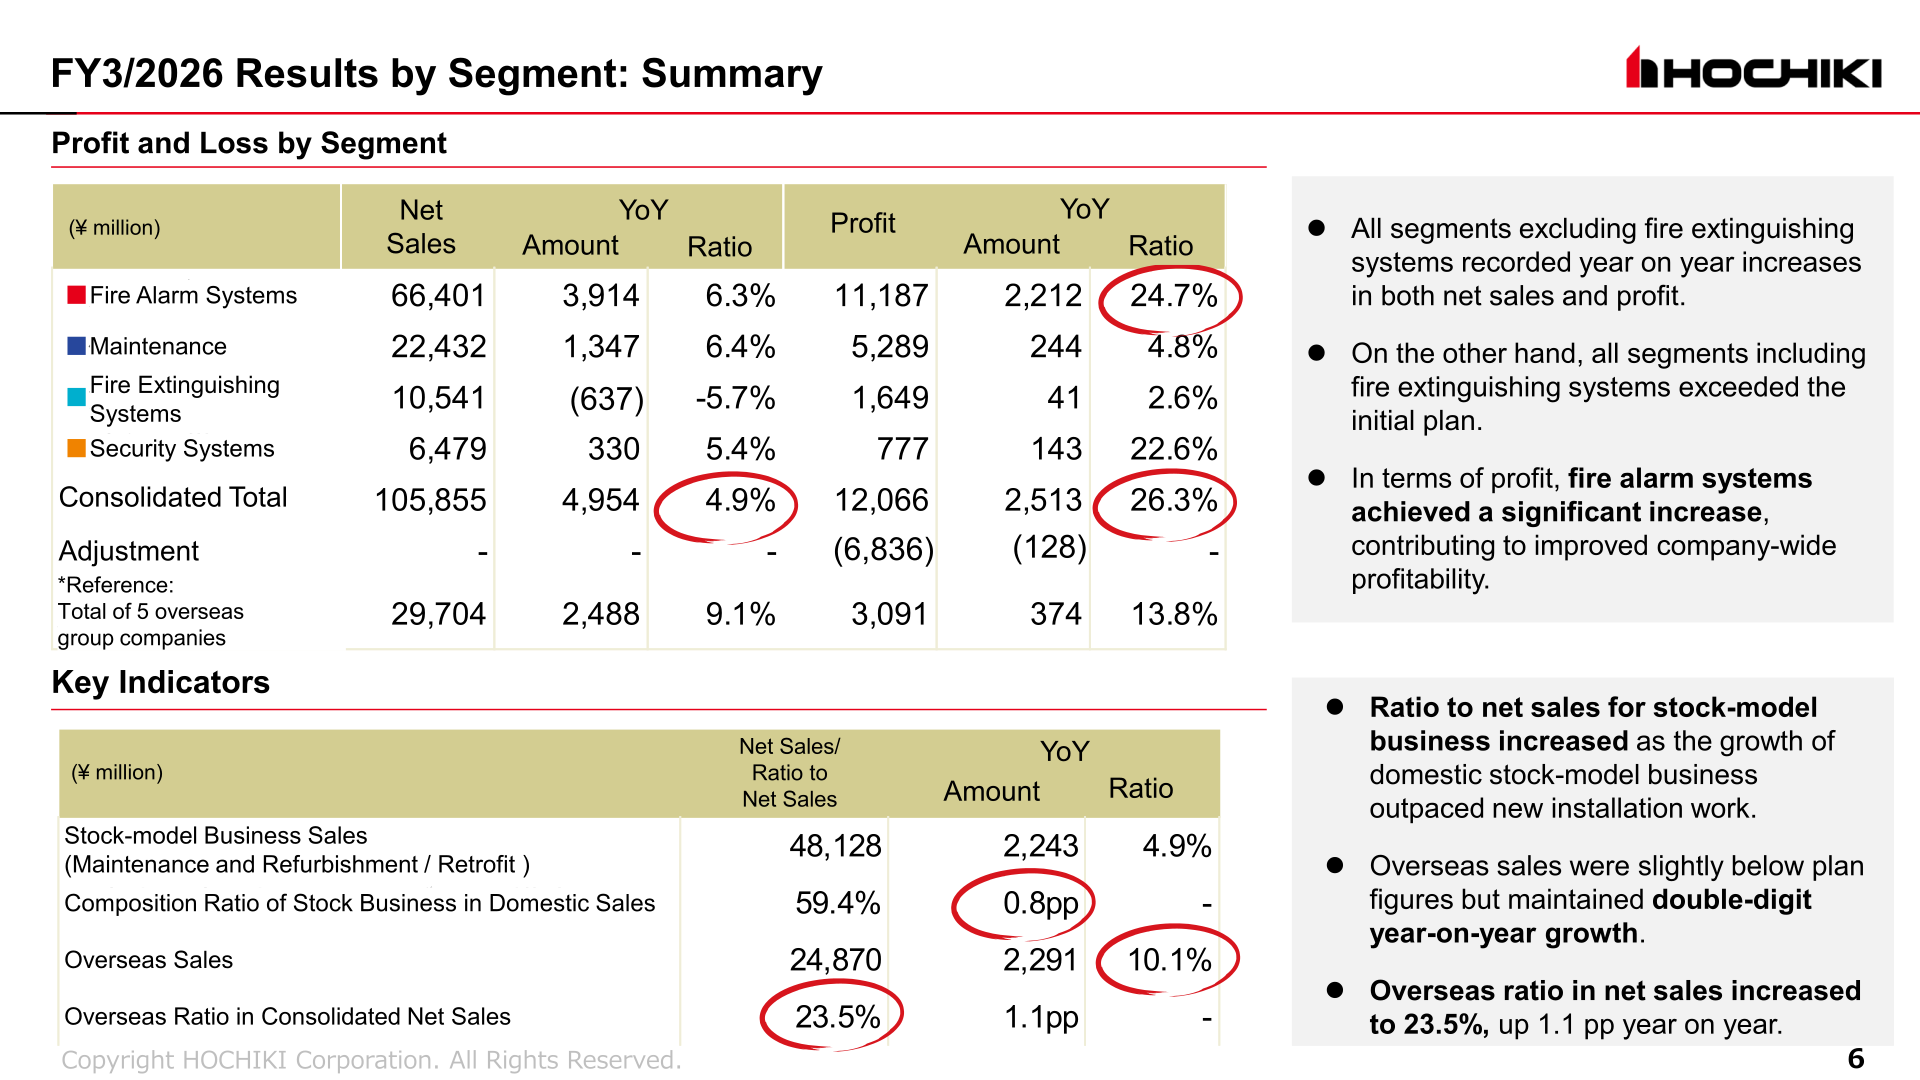
All segments excluding fire extinguishing systems recorded year-on-year increases in both net sales and profit, while all segments including fire extinguishing systems exceeded the initial plan. In terms of profit, fire alarm systems achieved a significant increase (+24.7%), contributing to improved company-wide profitability. Stock-model business sales (maintenance and refurbishment/retrofit) rose 4.9% to ¥48,128 million, lifting the composition ratio of stock business in domestic sales to 59.4% (+0.8pp). Overseas sales rose 10.1% to ¥24,870 million, and the overseas ratio in consolidated net sales increased to 23.5%, up 1.1pp year on year.
| Segment (¥ million) | Net Sales | YoY Ratio | Profit | YoY Ratio |
|---|---|---|---|---|
| Fire Alarm Systems | 66,401 | 6.3% | 11,187 | 24.7% |
| Maintenance | 22,432 | 6.4% | 5,289 | 4.8% |
| Fire Extinguishing Systems | 10,541 | -5.7% | 1,649 | 2.6% |
| Security Systems | 6,479 | 5.4% | 777 | 22.6% |
| Adjustment | – | – | (6,836) | – |
| Consolidated Total | 105,855 | 4.9% | 12,066 | 26.3% |
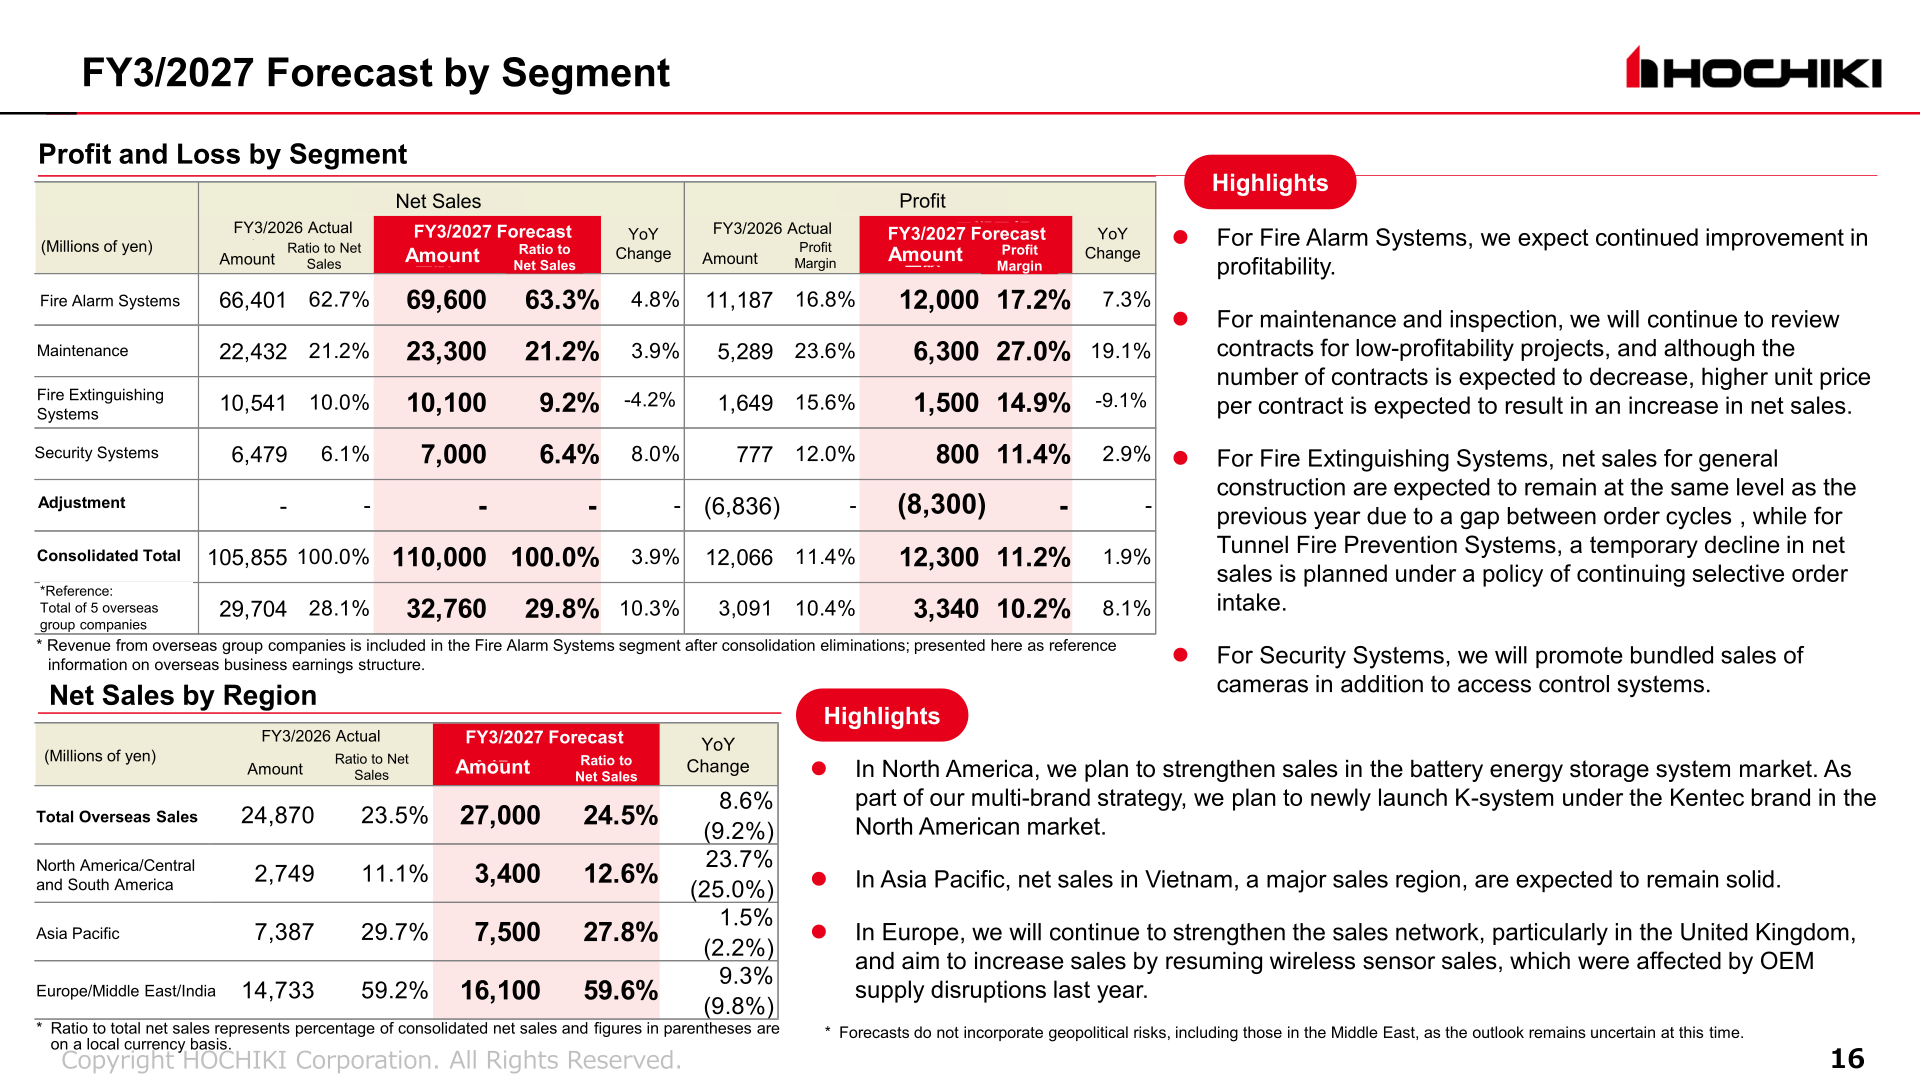
Within fire alarm systems, domestic net sales rose 4.1% to ¥41,530 million and overseas net sales rose 10.1% to ¥24,870 million. By region, sales in Europe/Middle East/India rose 5.7% to ¥14,733 million, with Europe, including the United Kingdom, a major sales region, remaining solid. Asia Pacific sales rose 23.3% to ¥7,387 million, with system sales performing strongly, particularly in Vietnam, and higher sales in the battery energy storage system market. North America/Central and South America sales rose 3.9% to ¥2,749 million, with both OEM and system sales performing in line with the plan.
Orders Received / Order Backlog
Orders received — a separate indicator from net sales — marked record highs for the fifth consecutive fiscal year, increasing year on year across all segments: ¥1,085.3 hundred million (unit: ¥100 million) in total, up 7.9% year on year, including ¥686.2 hundred million in fire alarm systems (+8.5%), ¥227.7 hundred million in maintenance (+7.9%), ¥104.2 hundred million in fire extinguishing systems (+3.1%), and ¥67.0 hundred million in security systems (+10.7%). The order backlog stood at ¥300.3 hundred million, up 9.8%, which the company describes as a strong level expected to support future net sales growth.
FY3/2027 Forecast
For the fiscal year ending March 31, 2027, net sales, operating profit, and ordinary profit are forecast to reach record highs for the sixth consecutive fiscal year. Net sales are expected to increase, driven by overseas growth led by the revenue expansion plan in North America and Europe, as well as solid orders in the domestic market. Profit attributable to owners of parent is forecast to decrease 4.0%, as the tax burden reduction from the wage increase tax incentive system applied last year is not expected this year. Capital investment is planned to rise 145.8% to ¥5,341 million. Total overseas sales are forecast at ¥27,000 million (24.5% of net sales). The company notes that forecasts do not incorporate geopolitical risks, including those in the Middle East.
| Item (¥ million) | FY3/2026 Actual | FY3/2027 Forecast | YoY Ratio |
|---|---|---|---|
| Net Sales | 105,855 | 110,000 | 3.9% |
| Operating Profit | 12,066 (11.4%) | 12,300 (11.2%) | 1.9% |
| Ordinary Profit | 12,344 (11.7%) | 12,500 (11.4%) | 1.3% |
| Profit Attributable to Owners of Parent | 9,377 (8.9%) | 9,000 (8.2%) | -4.0% |
| R&D Expenses | 3,788 | 4,265 | 12.6% |
| Capital Investment | 2,172 | 5,341 | 145.8% |
| ROE | 14.7% | 12.6% | -2.1pp |
| ROIC | 13.4% | 12.8% | -0.6pp |
Shareholder Returns
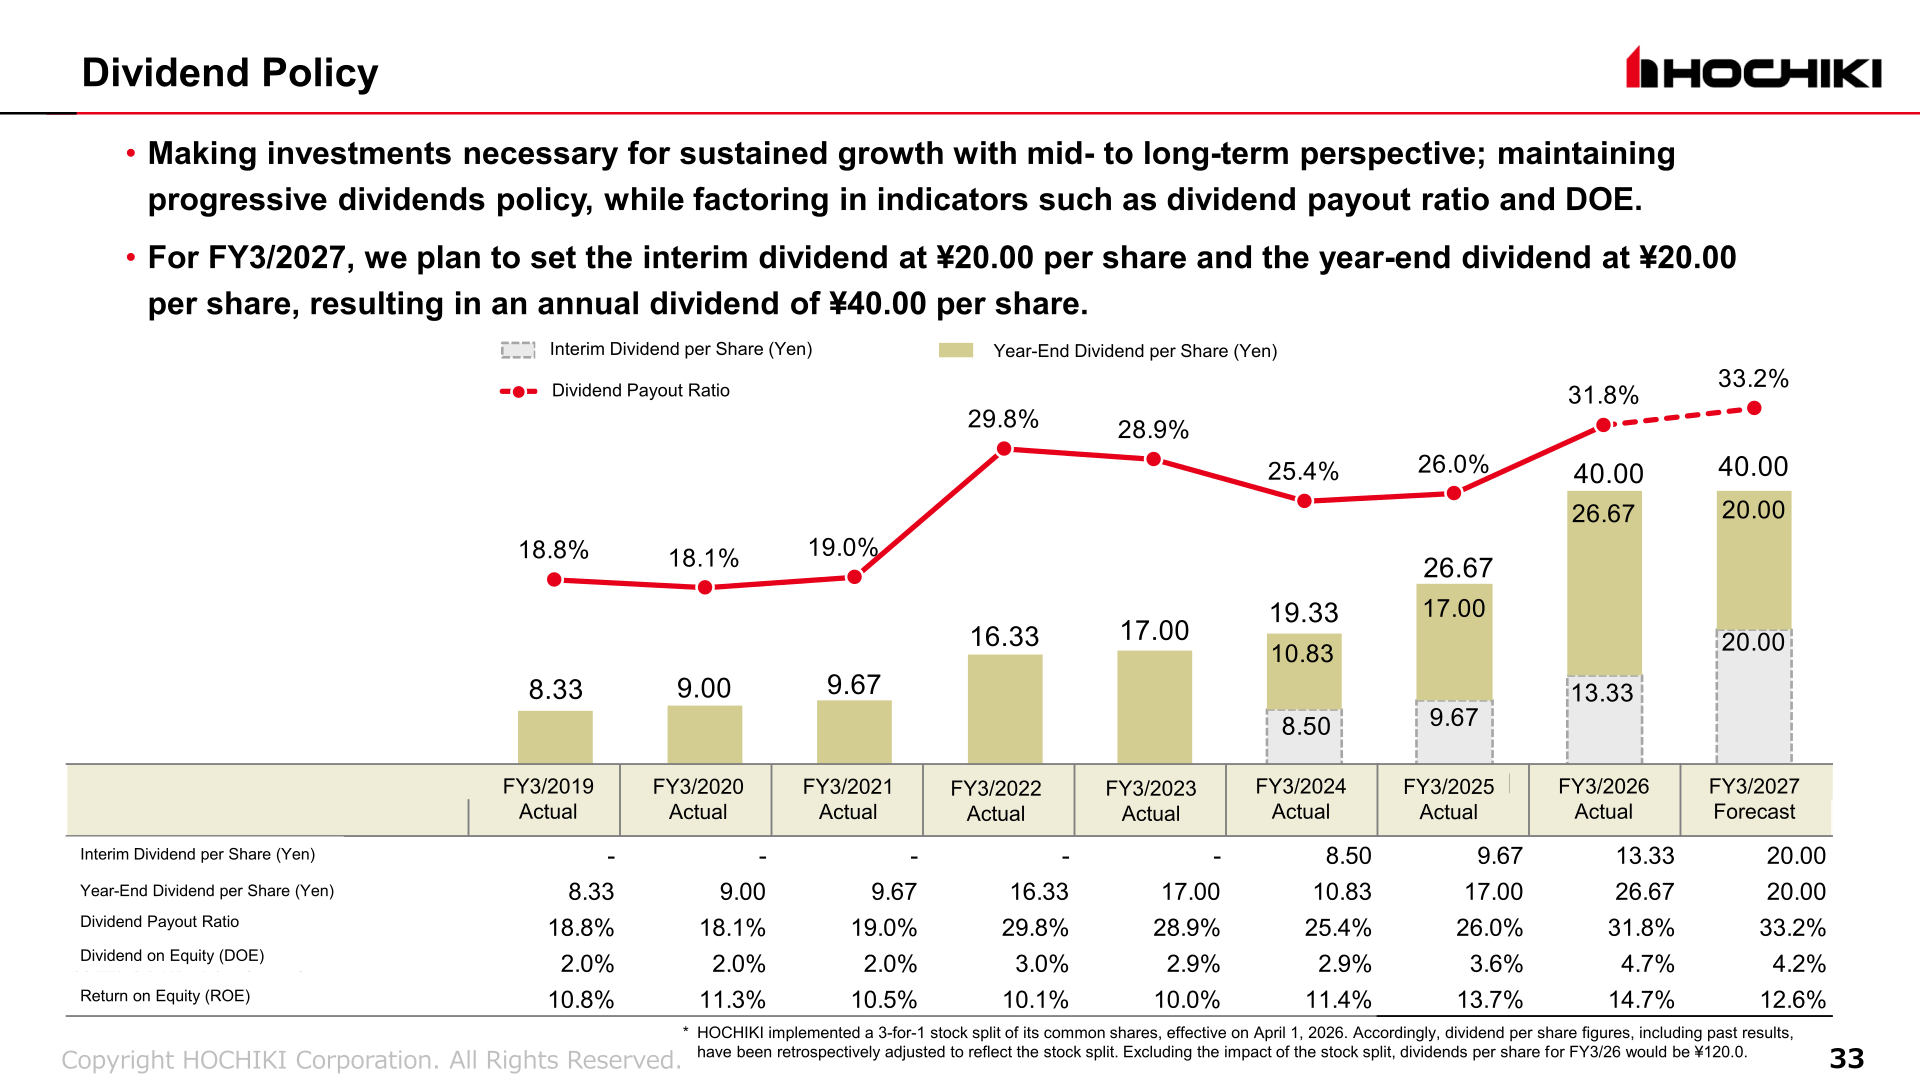
The company states that it is making investments necessary for sustained growth with a mid- to long-term perspective while maintaining a progressive dividends policy, factoring in indicators such as the dividend payout ratio and DOE. HOCHIKI implemented a 3-for-1 stock split of its common shares effective April 1, 2026, and dividend per share figures, including past results, have been retrospectively adjusted to reflect the split. For FY3/2026, the annual dividend was ¥40.00 per share (interim ¥13.33, year-end ¥26.67; ¥120.0 excluding the impact of the stock split), with a dividend payout ratio of 31.8% and DOE of 4.7%. For FY3/2027, the company plans an interim dividend of ¥20.00 and a year-end dividend of ¥20.00, for an annual dividend of ¥40.00 per share.
| Item | FY3/2025 Actual | FY3/2026 Actual | FY3/2027 Forecast |
|---|---|---|---|
| Interim Dividend per Share (Yen) | 9.67 | 13.33 | 20.00 |
| Year-End Dividend per Share (Yen) | 17.00 | 26.67 | 20.00 |
| Dividend Payout Ratio | 26.0% | 31.8% | 33.2% |
| Dividend on Equity (DOE) | 3.6% | 4.7% | 4.2% |
Medium-Term Plan: GLOBAL VISION 2030
Under its medium-to-long-term management plan “GLOBAL VISION 2030 — Creating Life Safety worldwide through the power of people and technology,” the company aims to grow from Japan’s “HOCHIKI” to the World’s “HOCHIKI,” targeting an overseas sales ratio of 30% or more by FY2030. Phase1 (2024–2026) financial targets are consolidated net sales of ¥100 billion, an operating margin of 8.2%, ROE of 10% or higher, and ROIC of 9% or higher; for FY2030 (Phase2), the targets are an operating margin, ROE, and ROIC each of 10% or higher with sustainable growth. In Phase1, results are expected to significantly exceed the initial plan, with earnings-structure improvements from profitability-focused order-taking, expansion of the stock-model business, and overseas growth. However, some strategic investments, primarily those related to production capacity expansion and production rationalization, were delayed compared to the initial plan. Phase1 cumulative operating cash flow is forecast at ¥35.0 billion against the initial plan of ¥33.0 billion, while investments are forecast at ¥15.0 billion against the planned ¥22.5 billion, a gap of ¥9.0 billion; the company says it will prioritize execution of the delayed investments and accelerate investment decision-making as it transitions to Phase2.
This article is an analysis based on publicly available information and is not a recommendation to buy or sell any specific securities. Investment decisions are your own responsibility.
![[Obayashi] Investors’ Guide 2026 — The Complete 24-Article Breakdown](https://japan-equity.com/wp-content/uploads/2026/07/hub_cover-1024x1024.png)
![[Obayashi] IR & SR Policy — Feeding Dialogue Back into Management](https://japan-equity.com/wp-content/uploads/2026/07/p32_sq-1024x1024.jpg)
![[Obayashi] Real Estate Development — 18.7% Margin, ¥287.7bn Unrealized Gains](https://japan-equity.com/wp-content/uploads/2026/07/p20_sq-1024x1024.jpg)
![[Obayashi] Domestic Civil Engineering — Resilience Spending Supports 9.6% Margin](https://japan-equity.com/wp-content/uploads/2026/07/p11_sq-1024x1024.jpg)
![[Obayashi] Share Price & External Ratings — vs TOPIX, ESG Index Inclusion](https://japan-equity.com/wp-content/uploads/2026/07/p40_sq-1024x1024.jpg)
![[Construction] ¥75.5tn Investment, Shrinking Workforce — Big-5 Market Share](https://japan-equity.com/wp-content/uploads/2026/07/p12_sq-1024x1024.jpg)



![[Obayashi] Capital Policy & Shareholder Returns — ROE 10%+, DOE ~5%, ¥100bn Buyback](https://japan-equity.com/wp-content/uploads/2026/07/p27_sq-1024x1024.jpg)
![[Obayashi] Reducing Cross-Shareholdings — ¥285.2bn Sold in Five Years](https://japan-equity.com/wp-content/uploads/2026/07/p29_sq-1024x1024.jpg)
![[Obayashi] ¥750bn Investment Plan — ¥300bn to Development, ¥190bn to Tech/DX](https://japan-equity.com/wp-content/uploads/2026/07/p30_sq-1024x1024.jpg)
![[Obayashi] MTP2022 KPIs — Operating Profit ~2x Target, ROE 14.4%](https://japan-equity.com/wp-content/uploads/2026/07/p25_sq-1024x1024.jpg)
![[Obayashi] Cash Allocation — ¥420bn Investment CF Over Five Years](https://japan-equity.com/wp-content/uploads/2026/07/p26_sq-1024x1024.jpg)
![[Obayashi] Green Energy — 44 Plants, 344MW, and the Green Hydrogen Challenge](https://japan-equity.com/wp-content/uploads/2026/07/p21_sq-1024x1024.jpg)
![[Obayashi] Tackling the Labor Shortage — Robotics Construction®](https://japan-equity.com/wp-content/uploads/2026/07/p14_sq-1024x1024.jpg)
