
This article is based on publicly available IR materials and is not a recommendation to buy or sell any specific securities.
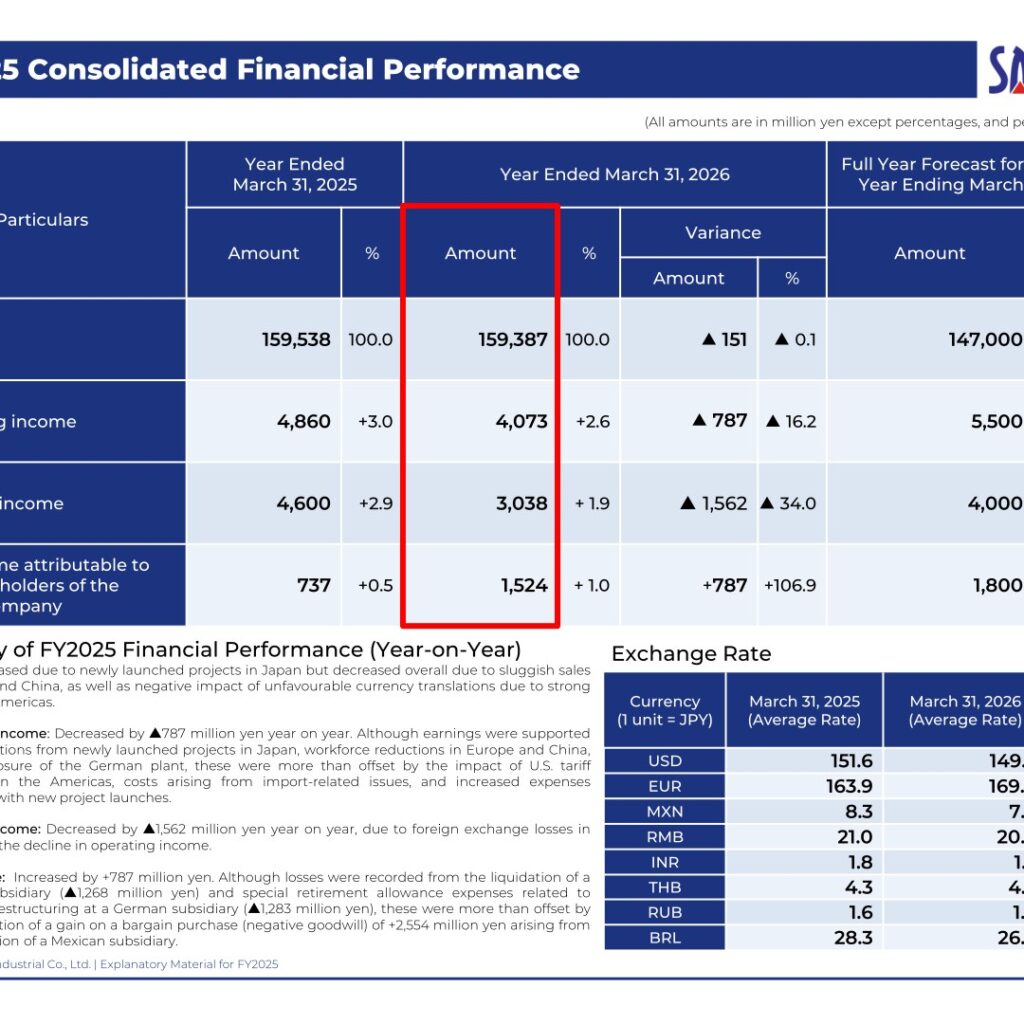
Sanoh Industrial Co., Ltd. (Tokyo Stock Exchange Prime, 6584) released its “Financial Year Ending March 31, 2026 Explanatory Material” on May 14, 2026. The presentation refers to the fiscal year ended March 31, 2026 as FY2025. Net sales were 159,387 million yen, essentially flat year on year (▲151 million yen, ▲0.1%), and operating income declined 16.2% to 4,073 million yen, weighed down by the impact of U.S. tariff measures and import-related costs in the Americas. Net income attributable to the shareholders of the parent company more than doubled to 1,524 million yen (+106.9%), lifted by a gain on a bargain purchase (negative goodwill) from the acquisition of a Mexican subsidiary.
Consolidated Results (Full-Year Actual)
Sales increased due to newly launched projects in Japan but decreased overall due to sluggish sales in Europe and China, as well as the negative impact of unfavourable currency translations from a strong yen in the Americas. Operating income decreased by ▲787 million yen year on year: contributions from newly launched projects in Japan, workforce reductions in Europe and China, and the closure of the German plant were more than offset by U.S. tariff measures in the Americas, costs arising from import-related issues, and increased expenses associated with new project launches. Ordinary income fell ▲1,562 million yen, reflecting foreign exchange losses in addition to the operating decline. Against the company’s full-year forecast for the fiscal year ending March 31, 2026, progress was 108.4% on net sales (forecast: 147,000 million yen) and 74.1% on operating income (forecast: 5,500 million yen).
| Item (million yen) | Year Ended March 31, 2025 | Year Ended March 31, 2026 | Variance | Variance (%) |
|---|---|---|---|---|
| Net sales | 159,538 | 159,387 | ▲151 | ▲0.1 |
| Operating income | 4,860 | 4,073 | ▲787 | ▲16.2 |
| Ordinary income | 4,600 | 3,038 | ▲1,562 | ▲34.0 |
| Net income attributable to the shareholders of the parent company | 737 | 1,524 | +787 | +106.9 |
Net income increased by +787 million yen. Although losses were recorded from the liquidation of a Chinese subsidiary (▲1,268 million yen) and special retirement allowance expenses related to workforce restructuring at a German subsidiary (▲1,283 million yen), these were more than offset by the recognition of a gain on a bargain purchase (negative goodwill) of +2,554 million yen arising from the acquisition of a Mexican subsidiary. Average exchange rates for the year were 149.7 yen to the U.S. dollar (▲1% year on year) and 169.0 yen to the euro (+3%).
Segment Results
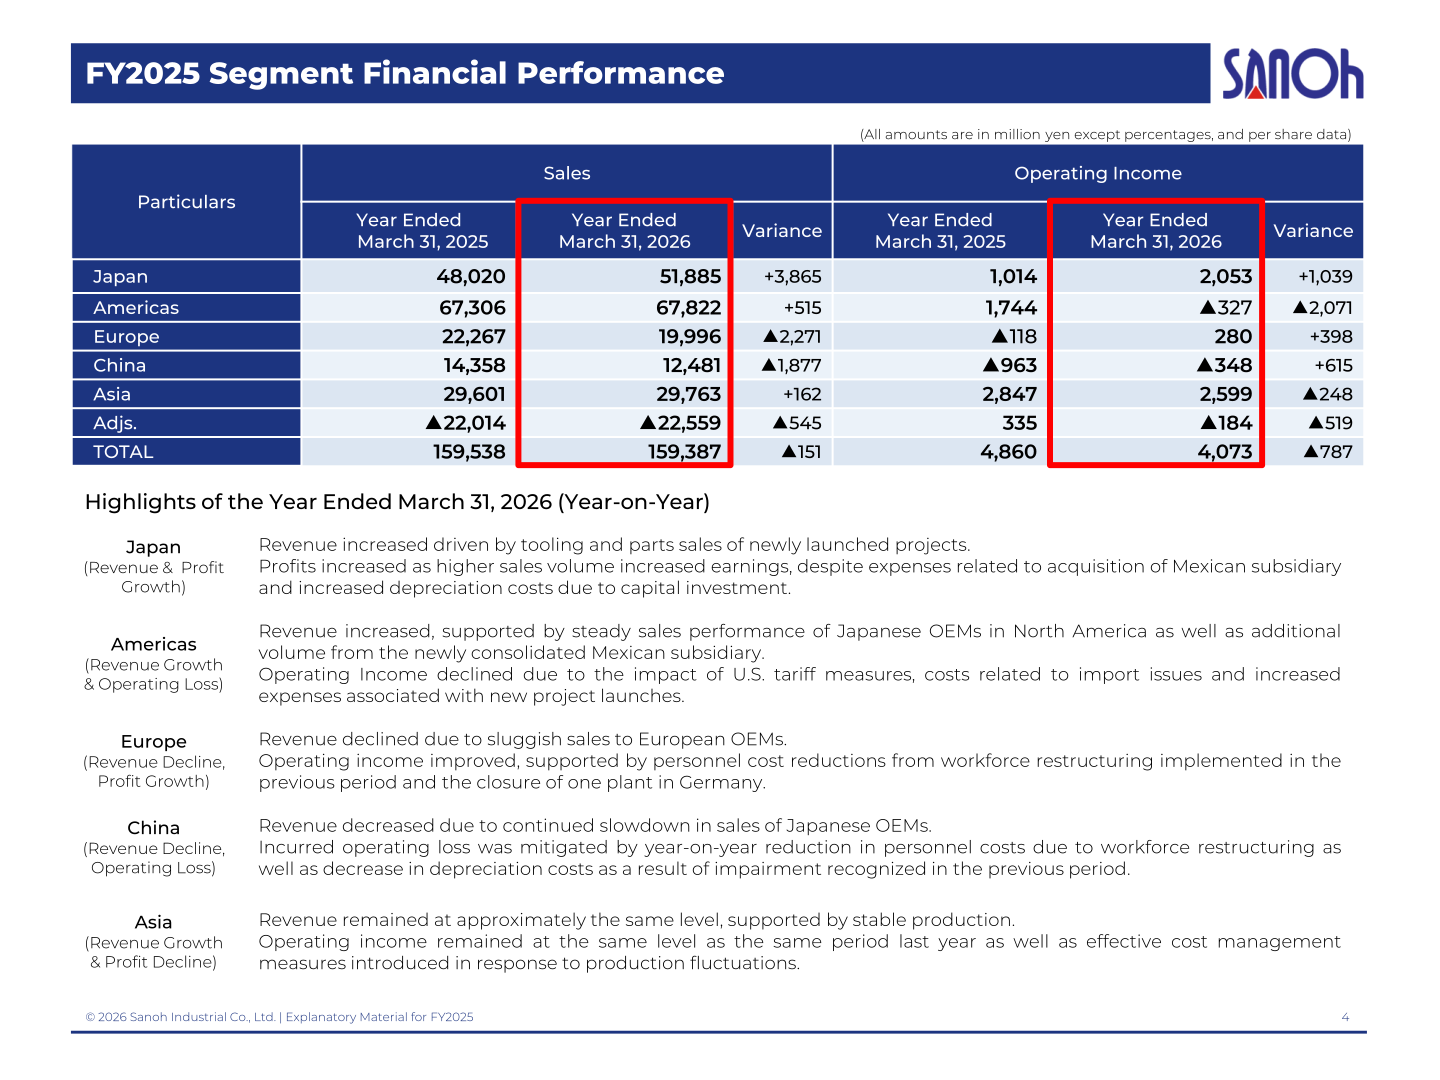
In Japan, revenue increased driven by tooling and parts sales of newly launched projects, and profits rose despite expenses related to the acquisition of the Mexican subsidiary and higher depreciation from capital investment. The Americas saw revenue growth on steady sales of Japanese OEMs in North America and additional volume from the newly consolidated Mexican subsidiary, but swung to an operating loss due to U.S. tariff measures, import-related costs, and new project launch expenses. Europe declined in revenue on sluggish sales to European OEMs, while operating income improved on personnel cost reductions and the closure of one plant in Germany. China’s revenue decreased on a continued slowdown in sales of Japanese OEMs, with the operating loss narrowing thanks to lower personnel and depreciation costs. Asia’s revenue remained at approximately the same level, supported by stable production.
| Segment (million yen) | Sales FY3/2025 | Sales FY3/2026 | Variance | Operating Income FY3/2025 | Operating Income FY3/2026 | Variance |
|---|---|---|---|---|---|---|
| Japan | 48,020 | 51,885 | +3,865 | 1,014 | 2,053 | +1,039 |
| Americas | 67,306 | 67,822 | +515 | 1,744 | ▲327 | ▲2,071 |
| Europe | 22,267 | 19,996 | ▲2,271 | ▲118 | 280 | +398 |
| China | 14,358 | 12,481 | ▲1,877 | ▲963 | ▲348 | +615 |
| Asia | 29,601 | 29,763 | +162 | 2,847 | 2,599 | ▲248 |
| Adjs. | ▲22,014 | ▲22,559 | ▲545 | 335 | ▲184 | ▲519 |
| TOTAL | 159,538 | 159,387 | ▲151 | 4,860 | 4,073 | ▲787 |
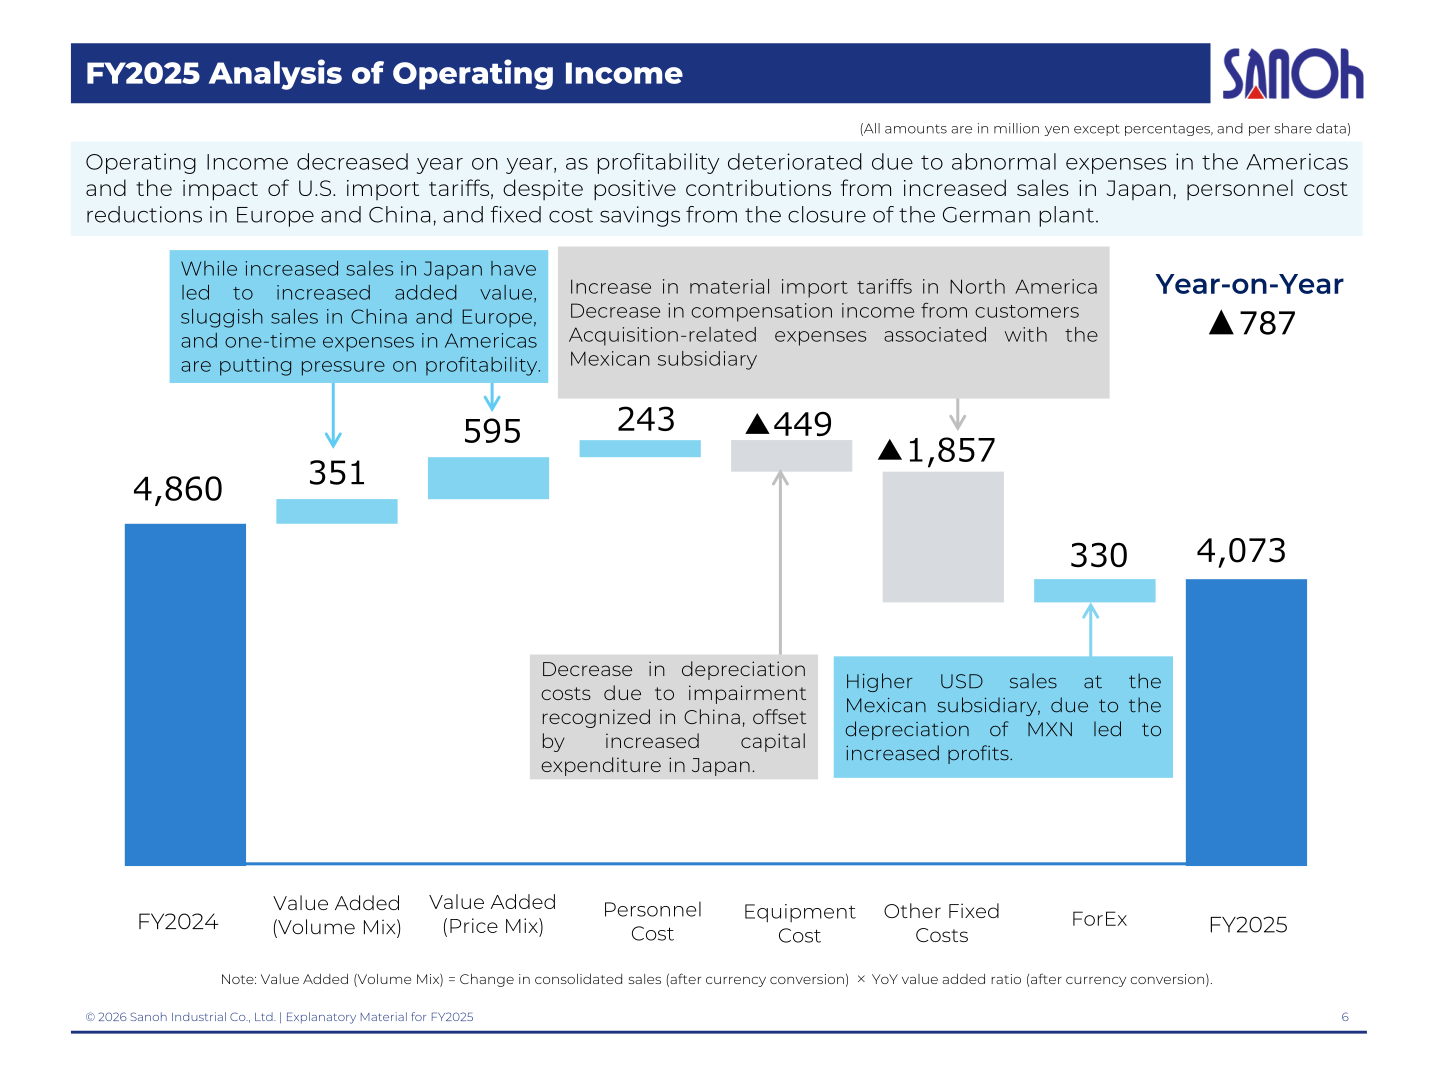
The company’s operating income bridge attributes the ▲787 million yen year-on-year decline to the following factors: value added (volume mix) +351, value added (price mix) +595, personnel cost +243, equipment cost ▲449, other fixed costs ▲1,857, and foreign exchange +330 (million yen). The negative swing in other fixed costs reflects an increase in material import tariffs in North America, a decrease in compensation income from customers, and acquisition-related expenses associated with the Mexican subsidiary.
Financial Position and Cash Flow
Total assets increased by +24,791 million yen to 141,929 million yen, with tangible fixed assets up +8,636 million yen and inventory up +5,529 million yen. Total liabilities rose +20,910 million yen to 89,961 million yen on higher short-term borrowings (+7,877 million yen) and long-term borrowings (+7,762 million yen). The D/E ratio rose from 0.90 to 1.19 and the equity ratio declined from 37.8 to 33.8. Cash flow from operating activities was +1,478 million yen, investing activities ▲13,471 million yen, and financing activities +13,820 million yen (including +906 million yen of translation adjustments related to cash and cash equivalents), leaving cash and cash equivalents of 24,519 million yen as on March 31, 2026. Capital expenditure was 10,088 million yen (+653 million yen year on year) and depreciation 6,978 million yen (+209 million yen).
FY2026 Forecast
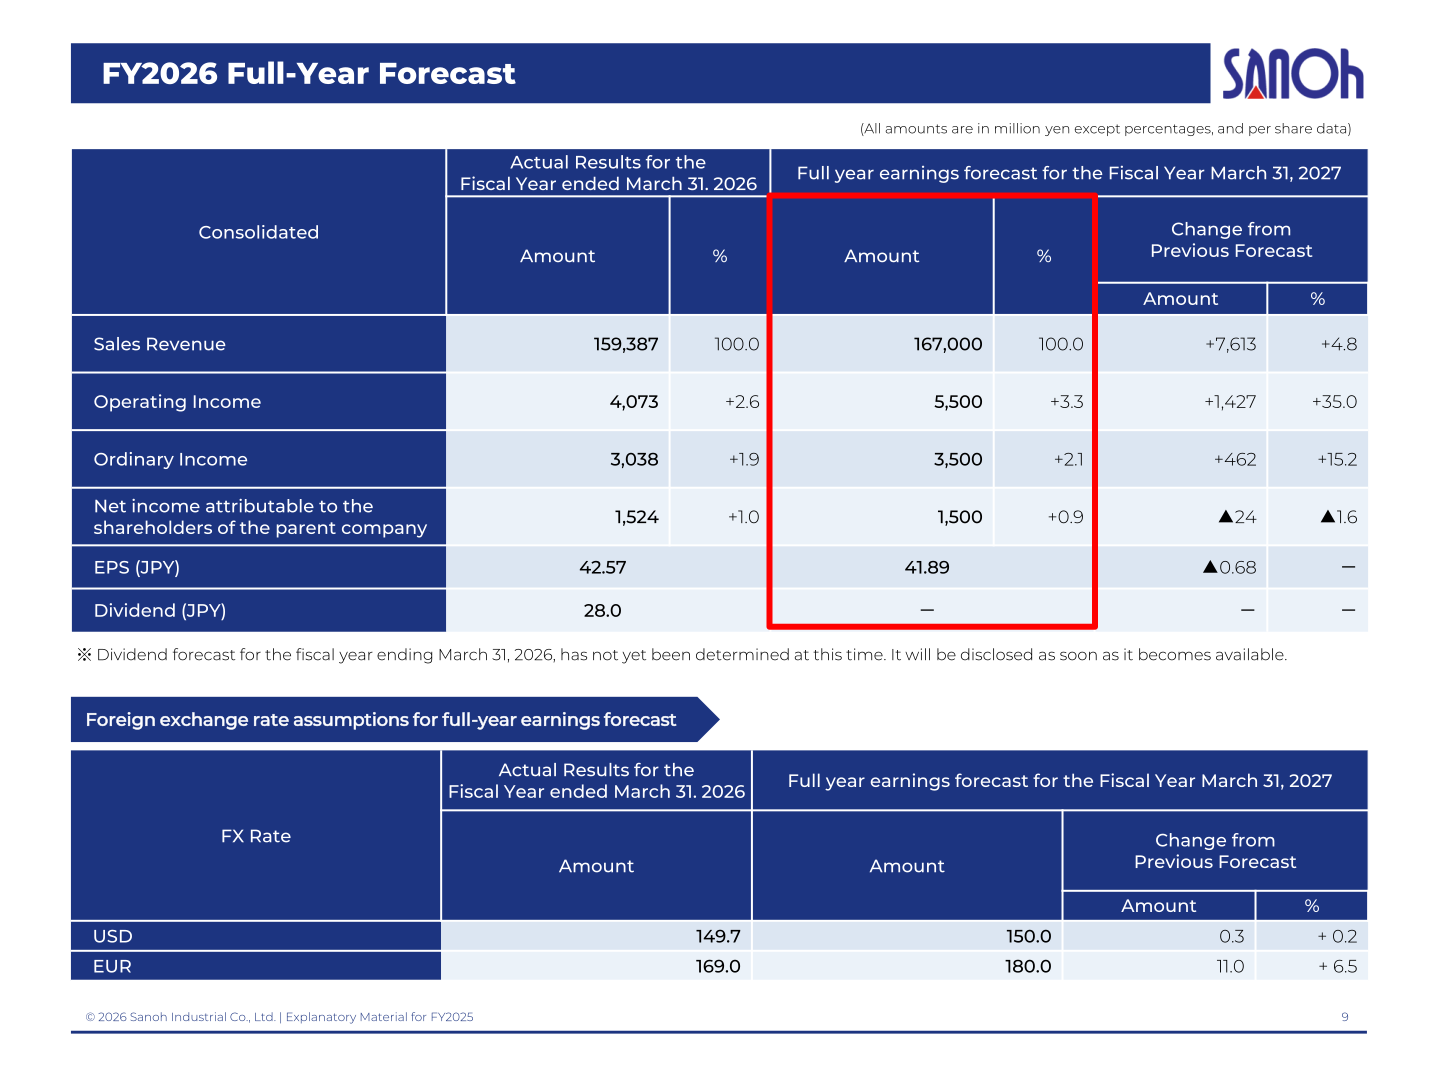
For the fiscal year ending March 31, 2027, the company forecasts sales revenue of 167,000 million yen (+4.8% versus the year ended March 31, 2026), operating income of 5,500 million yen (+35.0%), ordinary income of 3,500 million yen (+15.2%), and net income attributable to the shareholders of the parent company of 1,500 million yen (▲1.6%). The forecast assumes exchange rates of 150.0 yen to the U.S. dollar and 180.0 yen to the euro.
| Item (million yen) | FY Ended March 31, 2026 (Actual) | FY Ending March 31, 2027 (Forecast) | Change | Change (%) |
|---|---|---|---|---|
| Sales revenue | 159,387 | 167,000 | +7,613 | +4.8 |
| Operating income | 4,073 | 5,500 | +1,427 | +35.0 |
| Ordinary income | 3,038 | 3,500 | +462 | +15.2 |
| Net income attributable to the shareholders of the parent company | 1,524 | 1,500 | ▲24 | ▲1.6 |
| EPS (JPY) | 42.57 | 41.89 | ▲0.68 | - |
Shareholder Returns
The dividend for the fiscal year ended March 31, 2026 was 28.0 yen per share. The dividend forecast for the coming fiscal year is shown as undetermined in the materials, with a note stating it will be disclosed as soon as it becomes available.
This article is an analysis based on publicly available information and is not a recommendation to buy or sell any specific securities. Investment decisions are your own responsibility.
![[Obayashi] Investors’ Guide 2026 — The Complete 24-Article Breakdown](https://japan-equity.com/wp-content/uploads/2026/07/hub_cover-1024x1024.png)
![[Obayashi] IR & SR Policy — Feeding Dialogue Back into Management](https://japan-equity.com/wp-content/uploads/2026/07/p32_sq-1024x1024.jpg)
![[Obayashi] Real Estate Development — 18.7% Margin, ¥287.7bn Unrealized Gains](https://japan-equity.com/wp-content/uploads/2026/07/p20_sq-1024x1024.jpg)
![[Obayashi] Domestic Civil Engineering — Resilience Spending Supports 9.6% Margin](https://japan-equity.com/wp-content/uploads/2026/07/p11_sq-1024x1024.jpg)
![[Obayashi] Share Price & External Ratings — vs TOPIX, ESG Index Inclusion](https://japan-equity.com/wp-content/uploads/2026/07/p40_sq-1024x1024.jpg)
![[Construction] ¥75.5tn Investment, Shrinking Workforce — Big-5 Market Share](https://japan-equity.com/wp-content/uploads/2026/07/p12_sq-1024x1024.jpg)



![[Obayashi] Capital Policy & Shareholder Returns — ROE 10%+, DOE ~5%, ¥100bn Buyback](https://japan-equity.com/wp-content/uploads/2026/07/p27_sq-1024x1024.jpg)
![[Obayashi] Reducing Cross-Shareholdings — ¥285.2bn Sold in Five Years](https://japan-equity.com/wp-content/uploads/2026/07/p29_sq-1024x1024.jpg)
![[Obayashi] ¥750bn Investment Plan — ¥300bn to Development, ¥190bn to Tech/DX](https://japan-equity.com/wp-content/uploads/2026/07/p30_sq-1024x1024.jpg)
![[Obayashi] MTP2022 KPIs — Operating Profit ~2x Target, ROE 14.4%](https://japan-equity.com/wp-content/uploads/2026/07/p25_sq-1024x1024.jpg)
![[Obayashi] Cash Allocation — ¥420bn Investment CF Over Five Years](https://japan-equity.com/wp-content/uploads/2026/07/p26_sq-1024x1024.jpg)
![[Obayashi] Green Energy — 44 Plants, 344MW, and the Green Hydrogen Challenge](https://japan-equity.com/wp-content/uploads/2026/07/p21_sq-1024x1024.jpg)
![[Obayashi] Tackling the Labor Shortage — Robotics Construction®](https://japan-equity.com/wp-content/uploads/2026/07/p14_sq-1024x1024.jpg)
