
This article is based on publicly available IR materials and is not a recommendation to buy or sell any specific securities.
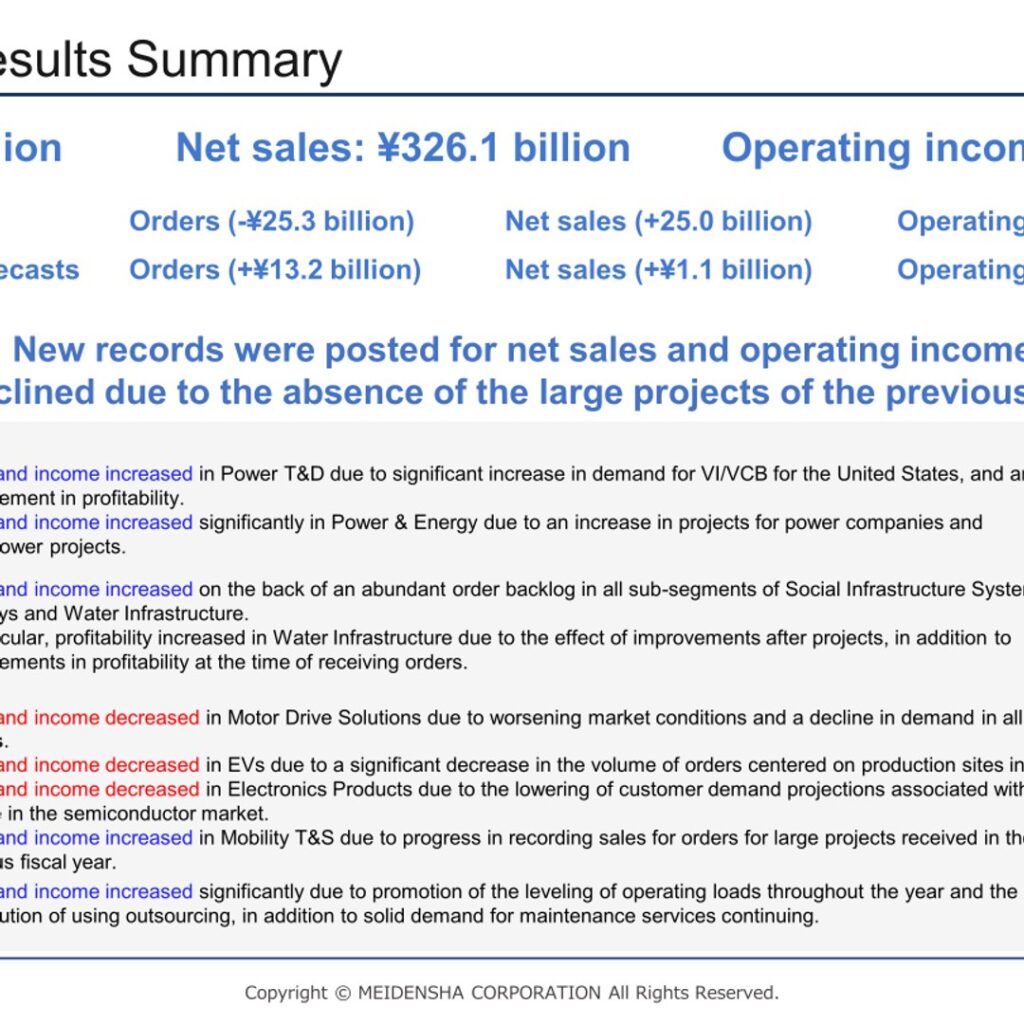
Meidensha Corporation (6508), an electrical equipment maker listed on the TSE Prime Market and NSE Premier Market, presented its Results Briefing for Fiscal 2025 on May 15, 2026. In the company’s materials, FY2025 refers to the fiscal year ended March 31, 2026. Orders came to ¥358.2 billion, net sales to ¥326.1 billion, and operating income to ¥27.1 billion. New records were posted for net sales and operating income, while orders declined due to the absence of the large projects of the previous fiscal year.
Consolidated Results (Full-Year Actual)
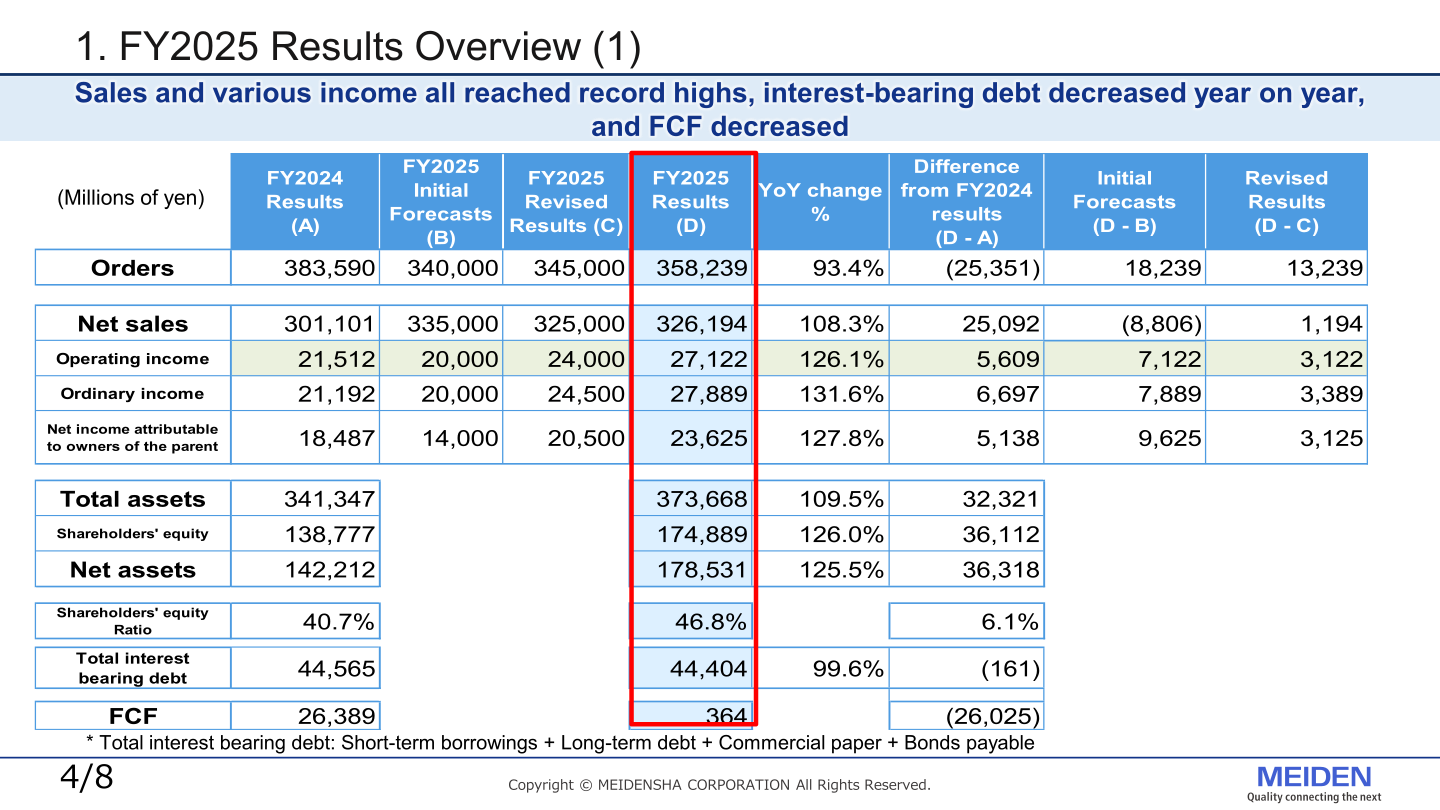
Sales and various income all reached record highs, interest-bearing debt decreased year on year, and free cash flow (FCF) decreased. Compared with FY2024, orders decreased by ¥25,351 million while net sales increased by ¥25,092 million and operating income increased by ¥5,609 million. Results also exceeded the January revised forecasts: net sales by ¥1,194 million, operating income by ¥3,122 million, and net income attributable to owners of the parent by ¥3,125 million. The shareholders’ equity ratio rose from 40.7% to 46.8%.
| Item (Millions of yen) | FY2024 Results | FY2025 Results | YoY change % | Difference from FY2024 |
|---|---|---|---|---|
| Orders | 383,590 | 358,239 | 93.4% | (25,351) |
| Net sales | 301,101 | 326,194 | 108.3% | 25,092 |
| Operating income | 21,512 | 27,122 | 126.1% | 5,609 |
| Ordinary income | 21,192 | 27,889 | 131.6% | 6,697 |
| Net income attributable to owners of the parent | 18,487 | 23,625 | 127.8% | 5,138 |
| Total assets | 341,347 | 373,668 | 109.5% | 32,321 |
| Net assets | 142,212 | 178,531 | 125.5% | 36,318 |
| Total interest bearing debt | 44,565 | 44,404 | 99.6% | (161) |
| FCF | 26,389 | 364 | (26,025) |
Investment was executed mostly as planned with high efficiency, and ROE and ROIC increased due to improved earnings. ROE rose from 13.9% in FY2024 to 15.1% in FY2025, ROIC from 8.2% to 9.4%, and the operating income margin from 7.1% to 8.3%. Capex and growth investment totaled ¥18.0 billion (FY2024: ¥11.9 billion) and R&D expenses were ¥13.4 billion (FY2024: ¥11.2 billion).
Segment Results
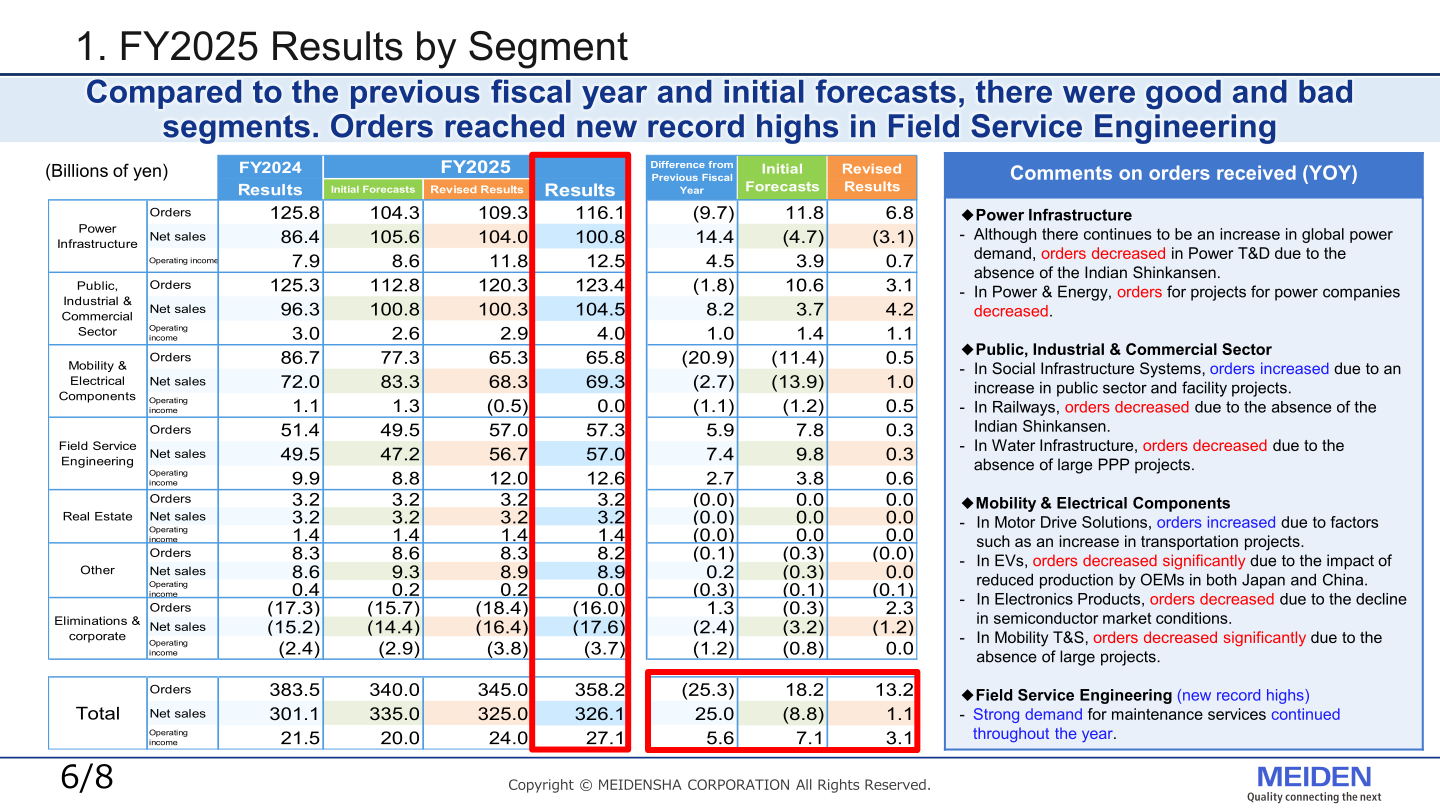
Compared to the previous fiscal year and initial forecasts, there were good and bad segments. Orders reached new record highs in Field Service Engineering. In Power Infrastructure, sales and income increased in Power T&D due to a significant increase in demand for VI/VCB for the United States and an improvement in profitability, and increased significantly in Power & Energy due to an increase in projects for power companies and hydropower projects. In the Public, Industrial & Commercial Sector, sales and income increased on the back of an abundant order backlog in all sub-segments — Social Infrastructure Systems, Railways and Water Infrastructure. In Mobility & Electrical Components, sales and income decreased in Motor Drive Solutions, EVs and Electronics Products, while they increased in Mobility T&S due to progress in recording sales for orders for large projects received in the previous fiscal year. In Field Service Engineering, sales and income increased significantly on solid demand for maintenance services, the leveling of operating loads throughout the year and the contribution of using outsourcing.
| Segment (Billions of yen) | Orders (FY2025) | Net sales (FY2025) | Operating income (FY2025) |
|---|---|---|---|
| Power Infrastructure | 116.1 | 100.8 | 12.5 |
| Public, Industrial & Commercial Sector | 123.4 | 104.5 | 4.0 |
| Mobility & Electrical Components | 65.8 | 69.3 | 0.0 |
| Field Service Engineering | 57.3 | 57.0 | 12.6 |
| Real Estate | 3.2 | 3.2 | 1.4 |
| Other | 8.2 | 8.9 | 0.0 |
| Eliminations & corporate | (16.0) | (17.6) | (3.7) |
| Total | 358.2 | 326.1 | 27.1 |
On orders received, orders decreased in Power T&D and Railways due to the absence of the Indian Shinkansen, and decreased in Water Infrastructure due to the absence of large PPP projects. In EVs, orders decreased significantly due to the impact of reduced production by OEMs in both Japan and China, while orders increased in Motor Drive Solutions on factors such as an increase in transportation projects. Field Service Engineering posted new record highs as strong demand for maintenance services continued throughout the year.
FY2026 Forecast
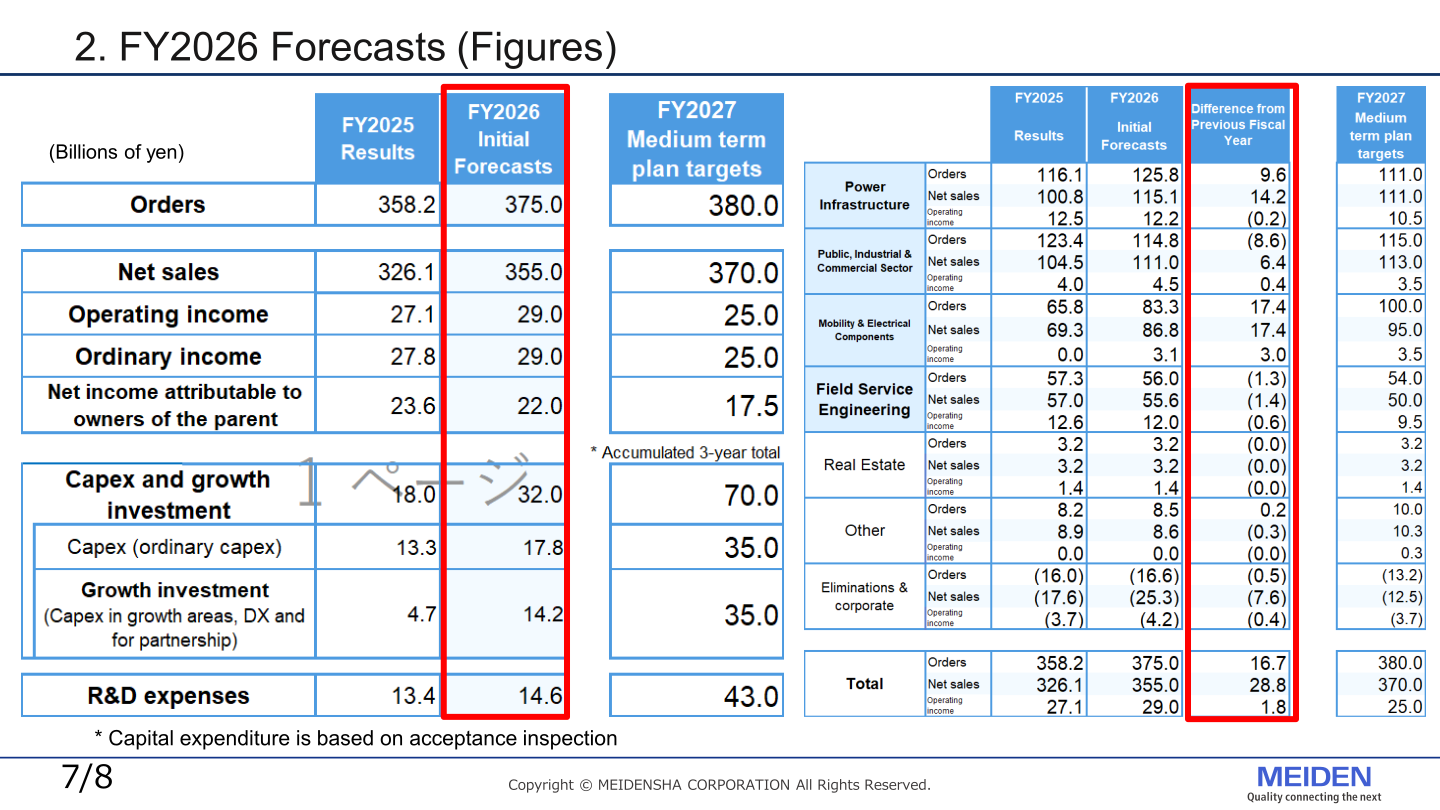
For FY2026, Meidensha forecasts orders of ¥375.0 billion, net sales of ¥355.0 billion, operating income of ¥29.0 billion, ordinary income of ¥29.0 billion, and net income attributable to owners of the parent of ¥22.0 billion. Capex and growth investment is planned at ¥32.0 billion and R&D expenses at ¥14.6 billion. By segment, net sales are forecast to increase in Power Infrastructure (¥115.1 billion) and Mobility & Electrical Components (¥86.8 billion), with total operating income rising ¥1.8 billion year on year.
| Item (Billions of yen) | FY2025 Results | FY2026 Initial Forecasts | FY2027 Medium-term plan targets |
|---|---|---|---|
| Orders | 358.2 | 375.0 | 380.0 |
| Net sales | 326.1 | 355.0 | 370.0 |
| Operating income | 27.1 | 29.0 | 25.0 |
| Ordinary income | 27.8 | 29.0 | 25.0 |
| Net income attributable to owners of the parent | 23.6 | 22.0 | 17.5 |
| Capex and growth investment | 18.0 | 32.0 | 70.0 (accumulated 3-year total) |
| R&D expenses | 13.4 | 14.6 | 43.0 (accumulated 3-year total) |
Shareholder Returns
The dividend payout ratio was 30.1% in FY2025, compared with 30.2% in FY2024 and a Medium-term management plan 2027 target of 30%. Per-share dividend amounts cannot be confirmed from the materials.
Medium-Term Plan / Topics
Against the Medium-term management plan 2027 (3-year plan), FY2025 results exceeded the plan’s profitability targets: ROE of 15.1% versus a plan of 10%, ROIC of 9.4% versus 8%, and an operating income margin of 8.3% versus 6.7%. The plan calls for capex and growth investment of ¥70.0 billion and R&D expenses of ¥43.0 billion on an accumulated 3-year basis, and FY2027 targets of ¥380.0 billion in orders, ¥370.0 billion in net sales and ¥25.0 billion in operating income.
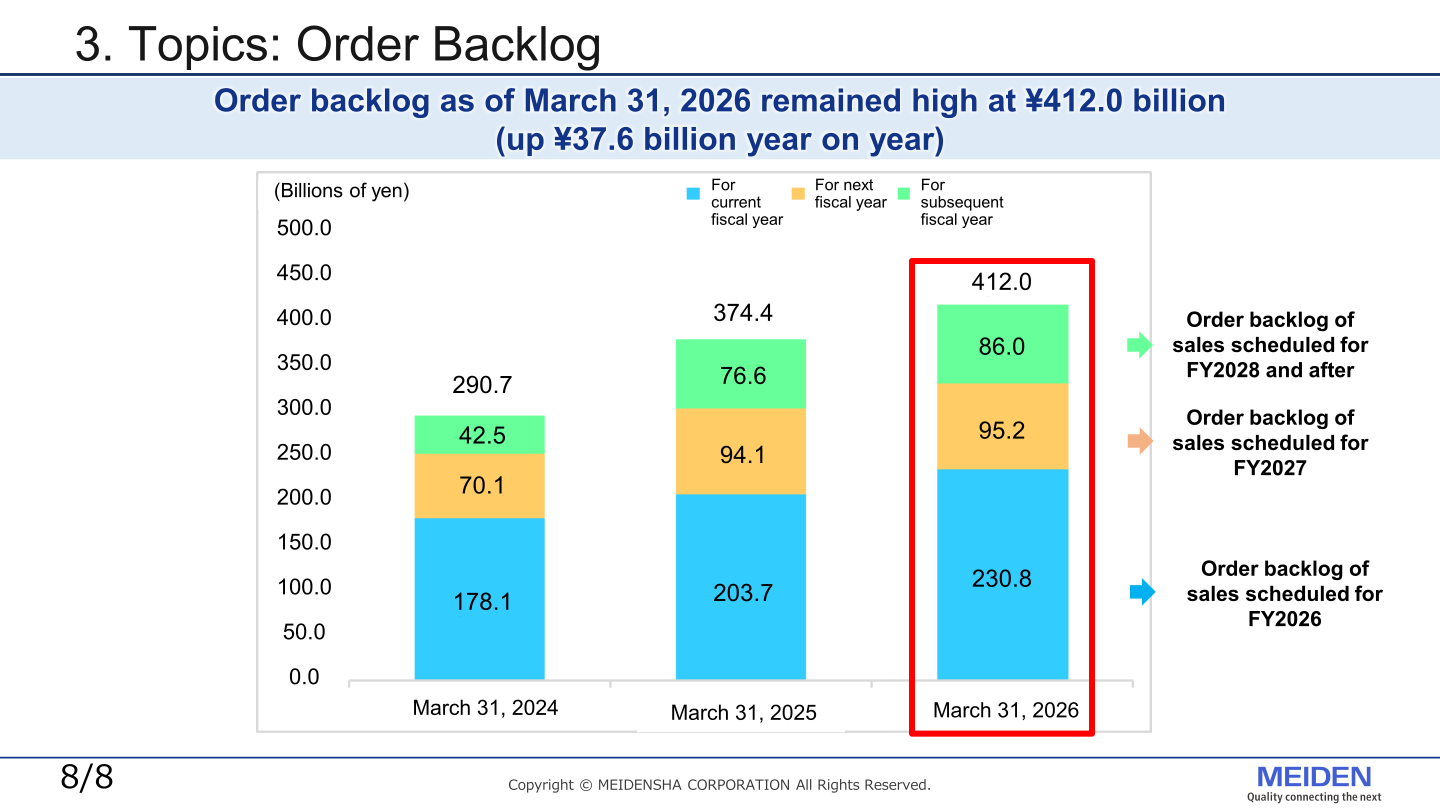
Order backlog as of March 31, 2026 remained high at ¥412.0 billion, up ¥37.6 billion year on year. Of this, ¥230.8 billion is backlog of sales scheduled for FY2026, ¥95.2 billion for FY2027, and ¥86.0 billion for FY2028 and after.
| Order backlog (Billions of yen) | March 31, 2024 | March 31, 2025 | March 31, 2026 |
|---|---|---|---|
| For current fiscal year | 178.1 | 203.7 | 230.8 |
| For next fiscal year | 70.1 | 94.1 | 95.2 |
| For subsequent fiscal year | 42.5 | 76.6 | 86.0 |
| Total | 290.7 | 374.4 | 412.0 |
This article is an analysis based on publicly available information and is not a recommendation to buy or sell any specific securities. Investment decisions are your own responsibility.
![[Obayashi] Investors’ Guide 2026 — The Complete 24-Article Breakdown](https://japan-equity.com/wp-content/uploads/2026/07/hub_cover-1024x1024.png)
![[Obayashi] IR & SR Policy — Feeding Dialogue Back into Management](https://japan-equity.com/wp-content/uploads/2026/07/p32_sq-1024x1024.jpg)
![[Obayashi] Real Estate Development — 18.7% Margin, ¥287.7bn Unrealized Gains](https://japan-equity.com/wp-content/uploads/2026/07/p20_sq-1024x1024.jpg)
![[Obayashi] Domestic Civil Engineering — Resilience Spending Supports 9.6% Margin](https://japan-equity.com/wp-content/uploads/2026/07/p11_sq-1024x1024.jpg)
![[Obayashi] Share Price & External Ratings — vs TOPIX, ESG Index Inclusion](https://japan-equity.com/wp-content/uploads/2026/07/p40_sq-1024x1024.jpg)
![[Construction] ¥75.5tn Investment, Shrinking Workforce — Big-5 Market Share](https://japan-equity.com/wp-content/uploads/2026/07/p12_sq-1024x1024.jpg)



![[Obayashi] Capital Policy & Shareholder Returns — ROE 10%+, DOE ~5%, ¥100bn Buyback](https://japan-equity.com/wp-content/uploads/2026/07/p27_sq-1024x1024.jpg)
![[Obayashi] Reducing Cross-Shareholdings — ¥285.2bn Sold in Five Years](https://japan-equity.com/wp-content/uploads/2026/07/p29_sq-1024x1024.jpg)
![[Obayashi] ¥750bn Investment Plan — ¥300bn to Development, ¥190bn to Tech/DX](https://japan-equity.com/wp-content/uploads/2026/07/p30_sq-1024x1024.jpg)
![[Obayashi] MTP2022 KPIs — Operating Profit ~2x Target, ROE 14.4%](https://japan-equity.com/wp-content/uploads/2026/07/p25_sq-1024x1024.jpg)
![[Obayashi] Cash Allocation — ¥420bn Investment CF Over Five Years](https://japan-equity.com/wp-content/uploads/2026/07/p26_sq-1024x1024.jpg)
![[Obayashi] Green Energy — 44 Plants, 344MW, and the Green Hydrogen Challenge](https://japan-equity.com/wp-content/uploads/2026/07/p21_sq-1024x1024.jpg)
![[Obayashi] Tackling the Labor Shortage — Robotics Construction®](https://japan-equity.com/wp-content/uploads/2026/07/p14_sq-1024x1024.jpg)
