
This article is based on publicly available IR materials and is not a recommendation to buy or sell any specific securities.
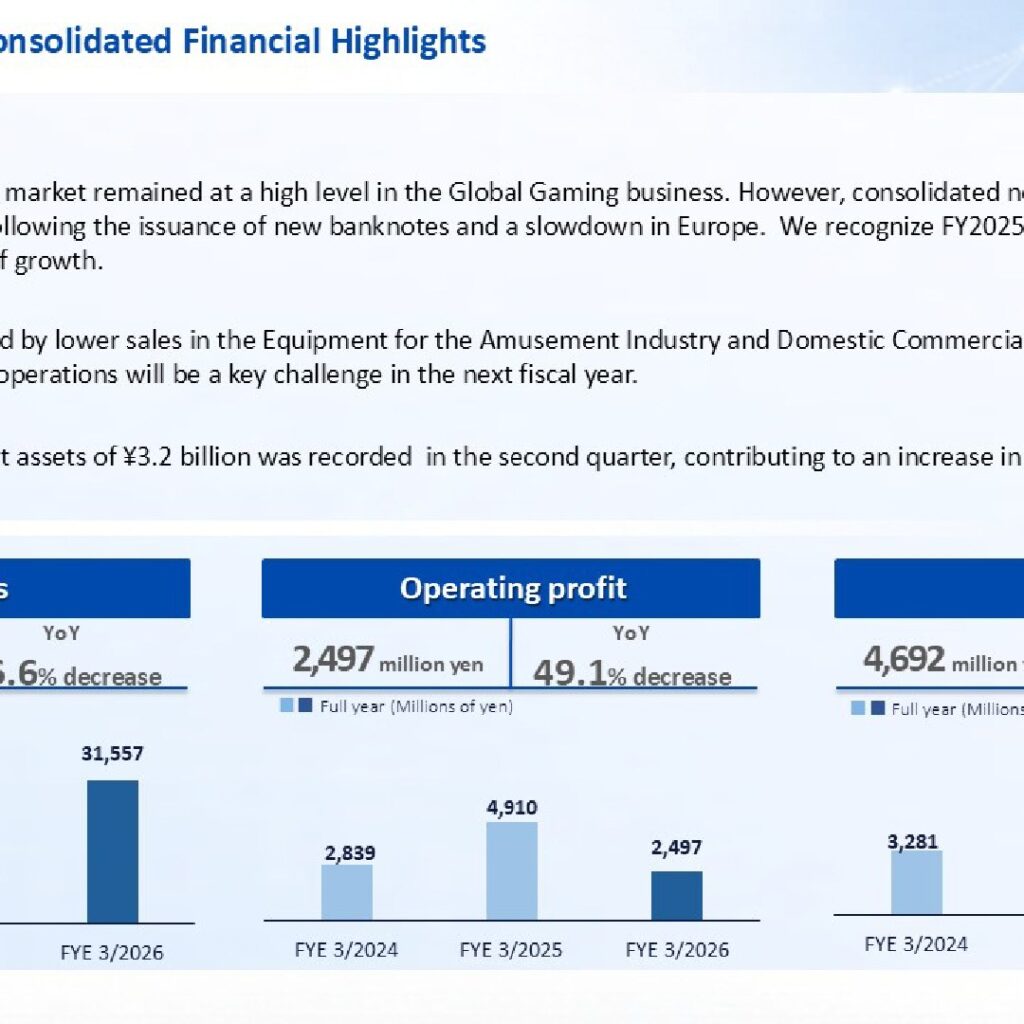
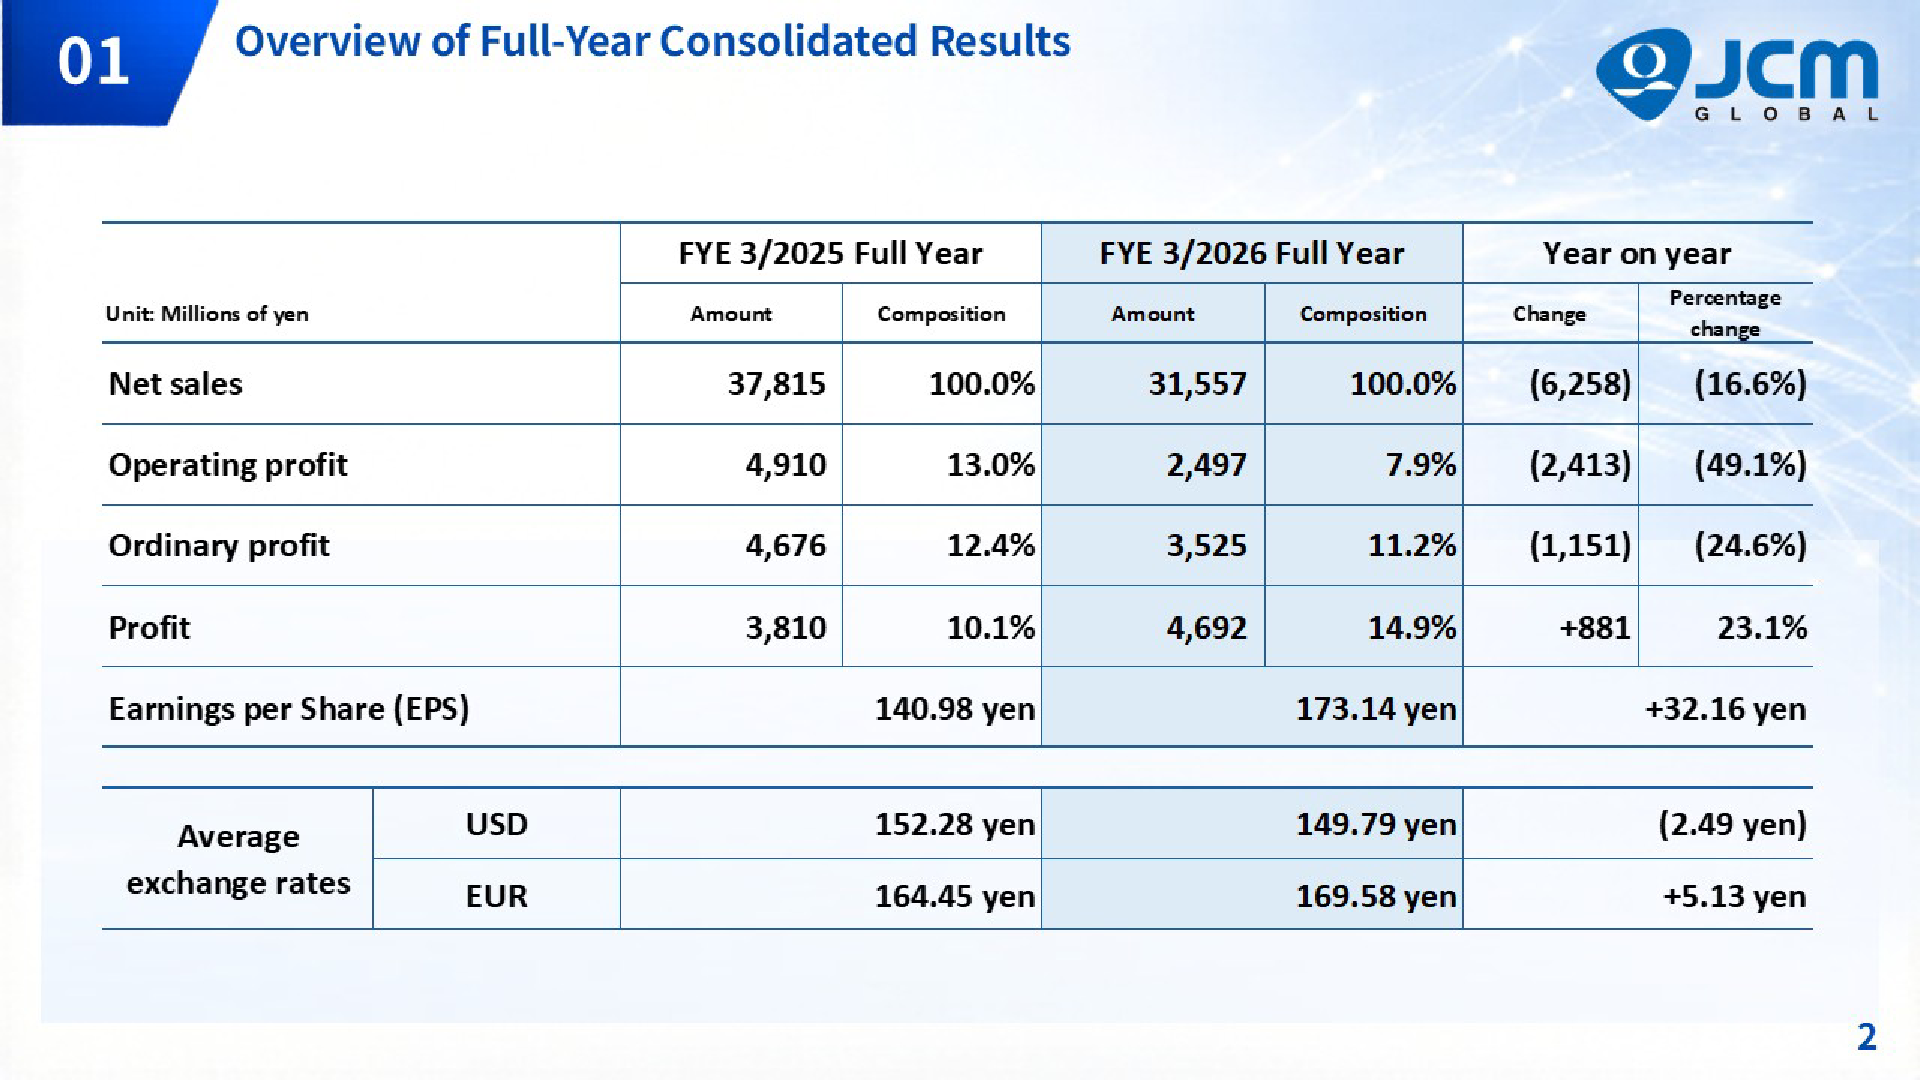
Japan Cash Machine Co., Ltd. (JCM GLOBAL, Securities code: 6418, TSE Prime Market) announced its financial results for the fiscal year ended March 31, 2026 on May 29, 2026, together with a new Medium-Term Management Plan for FY2026–FY2028. Note: the company labels the fiscal year ended March 31, 2026 as “FY2025” (shown as FYE 3/2026 in its tables), and this article follows the presentation’s labels. Consolidated net sales were 31,557 million yen, a 16.6% decrease year on year, and operating profit was 2,497 million yen, a 49.1% decrease. Profit was 4,692 million yen, a 23.1% increase, supported by a gain on sale of non-current assets recorded in the second quarter.
Consolidated Results (Full-Year Actual)
Sales in the North American market remained at a high level in the Global Gaming business. However, consolidated net sales declined due to the reactionary decline following the issuance of new banknotes and a slowdown in Europe; the company recognizes FY2025 as a transitional year before the next stage of growth. Operating profit was affected by lower sales in the Equipment for the Amusement Industry and Domestic Commercial businesses, and the company cites restoring earnings power in business operations as a key challenge in the next fiscal year. A gain on sale of non-current assets of ¥3.2 billion was recorded in the second quarter, contributing to an increase in profit attributable to owners of parent.
| Item (Millions of yen) | FYE 3/2025 Full Year | FYE 3/2026 Full Year | Change | Percentage change |
|---|---|---|---|---|
| Net sales | 37,815 | 31,557 | (6,258) | (16.6%) |
| Operating profit | 4,910 | 2,497 | (2,413) | (49.1%) |
| Ordinary profit | 4,676 | 3,525 | (1,151) | (24.6%) |
| Profit | 3,810 | 4,692 | +881 | 23.1% |
| Earnings per Share (EPS) | 140.98 yen | 173.14 yen | +32.16 yen | – |
Average exchange rates were 149.79 yen to the US dollar (152.28 yen in the previous year) and 169.58 yen to the euro (164.45 yen in the previous year). On the balance sheet, property, plant and equipment decreased by 1,453 million yen due to the sale of the Tokyo Head Office building, while net assets increased by 3,814 million yen on higher retained earnings. Operating cash flow was +5,876 million yen and free cash flows were +6,619 million yen, with cash and cash equivalents ending the year at 21,738 million yen.
Segment Results
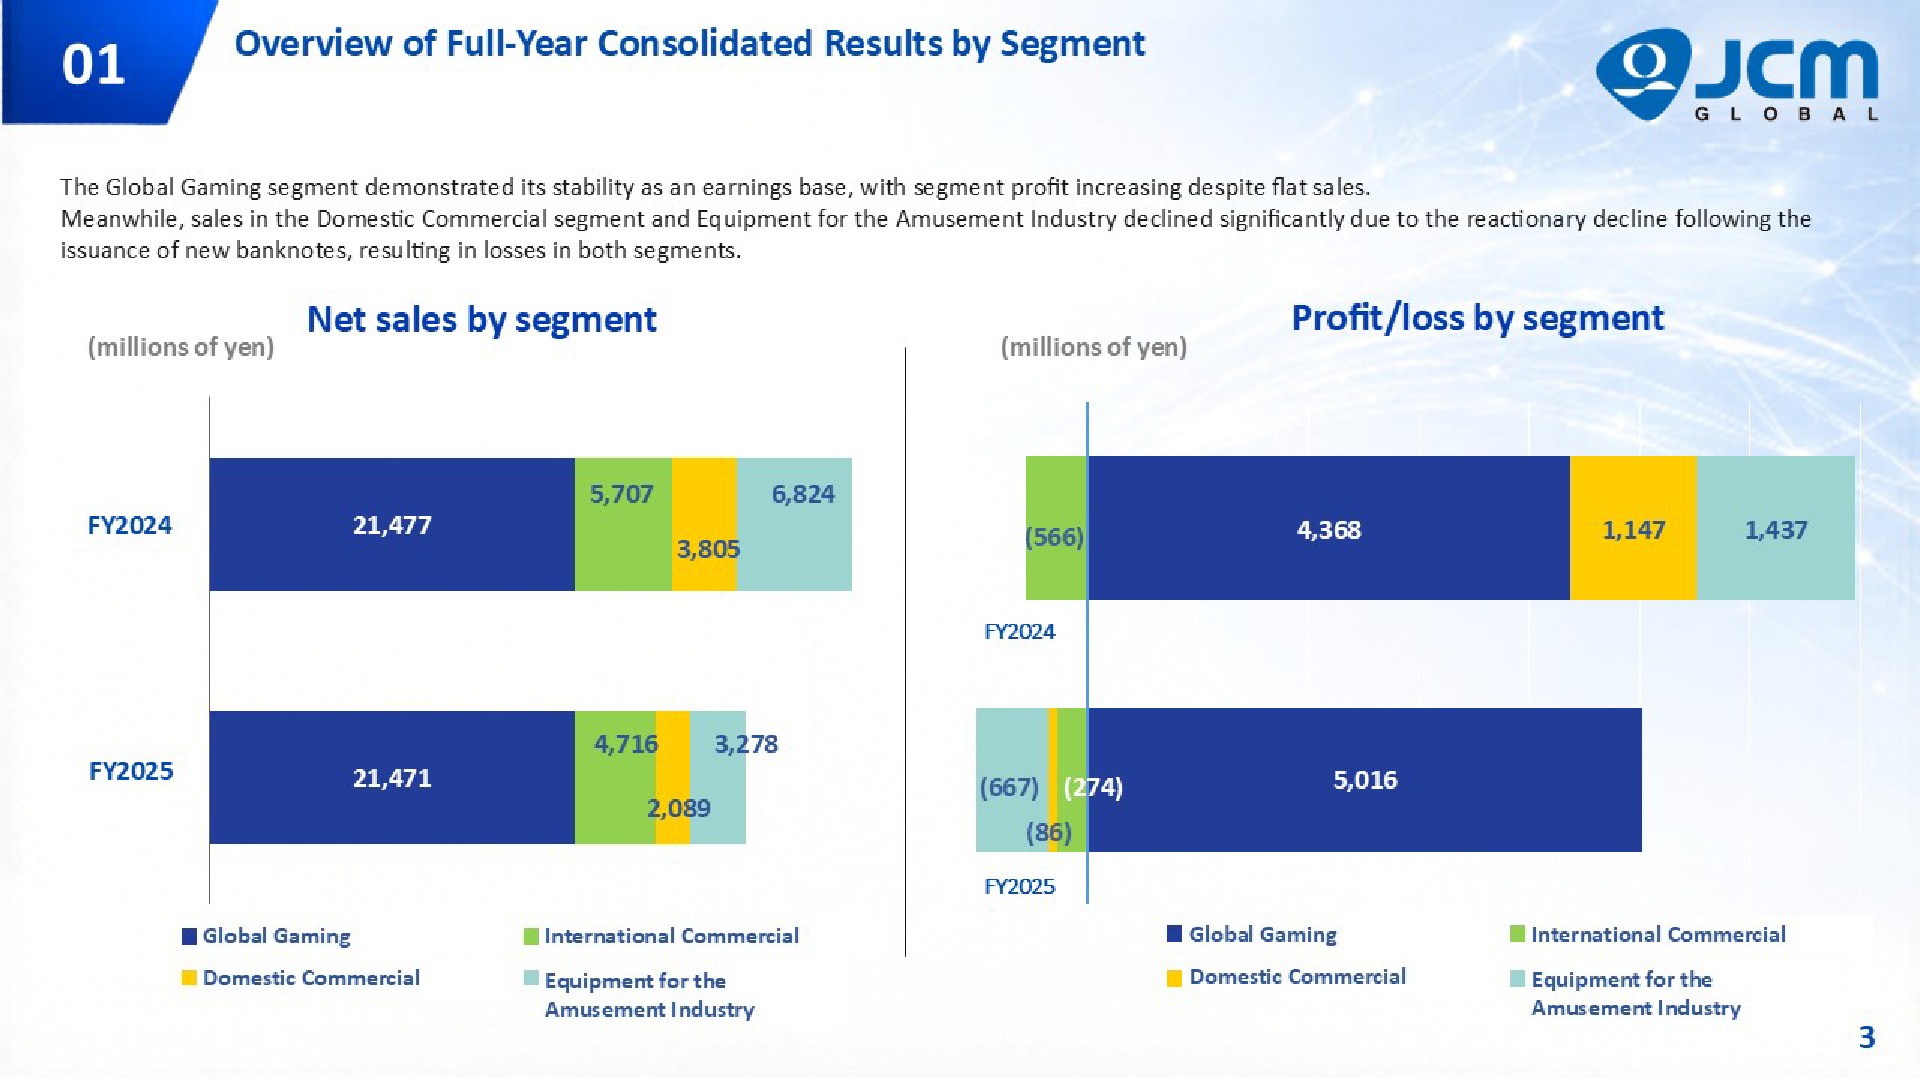
The Global Gaming segment demonstrated its stability as an earnings base, with segment profit increasing despite flat sales. Meanwhile, sales in the Domestic Commercial segment and Equipment for the Amusement Industry declined significantly due to the reactionary decline following the issuance of new banknotes, resulting in losses in both segments. In Global Gaming (68.0% of net sales), sales in North America remained at a high level, and although sales in Europe declined, segment profit increased due to an improved product mix with a higher proportion of high-margin products. In International Commercial (15.0% of net sales), sales declined due to lower sales in Europe; the segment remained in a loss position, but the loss was reduced from the previous fiscal year, and market development in Asia and Central & South America is progressing steadily.
| Segment (Millions of yen) | Net sales FY2025 | Net sales FY2024 | Profit/loss FY2025 | Profit/loss FY2024 |
|---|---|---|---|---|
| Global Gaming | 21,471 | 21,477 | 5,016 | 4,368 |
| International Commercial | 4,716 | 5,707 | (274) | (566) |
| Domestic Commercial | 2,089 | 3,805 | (86) | 1,147 |
| Equipment for the Amusement Industry | 3,278 | 6,824 | (667) | 1,437 |
FY2026 Targets and Medium-Term Plan Forecast
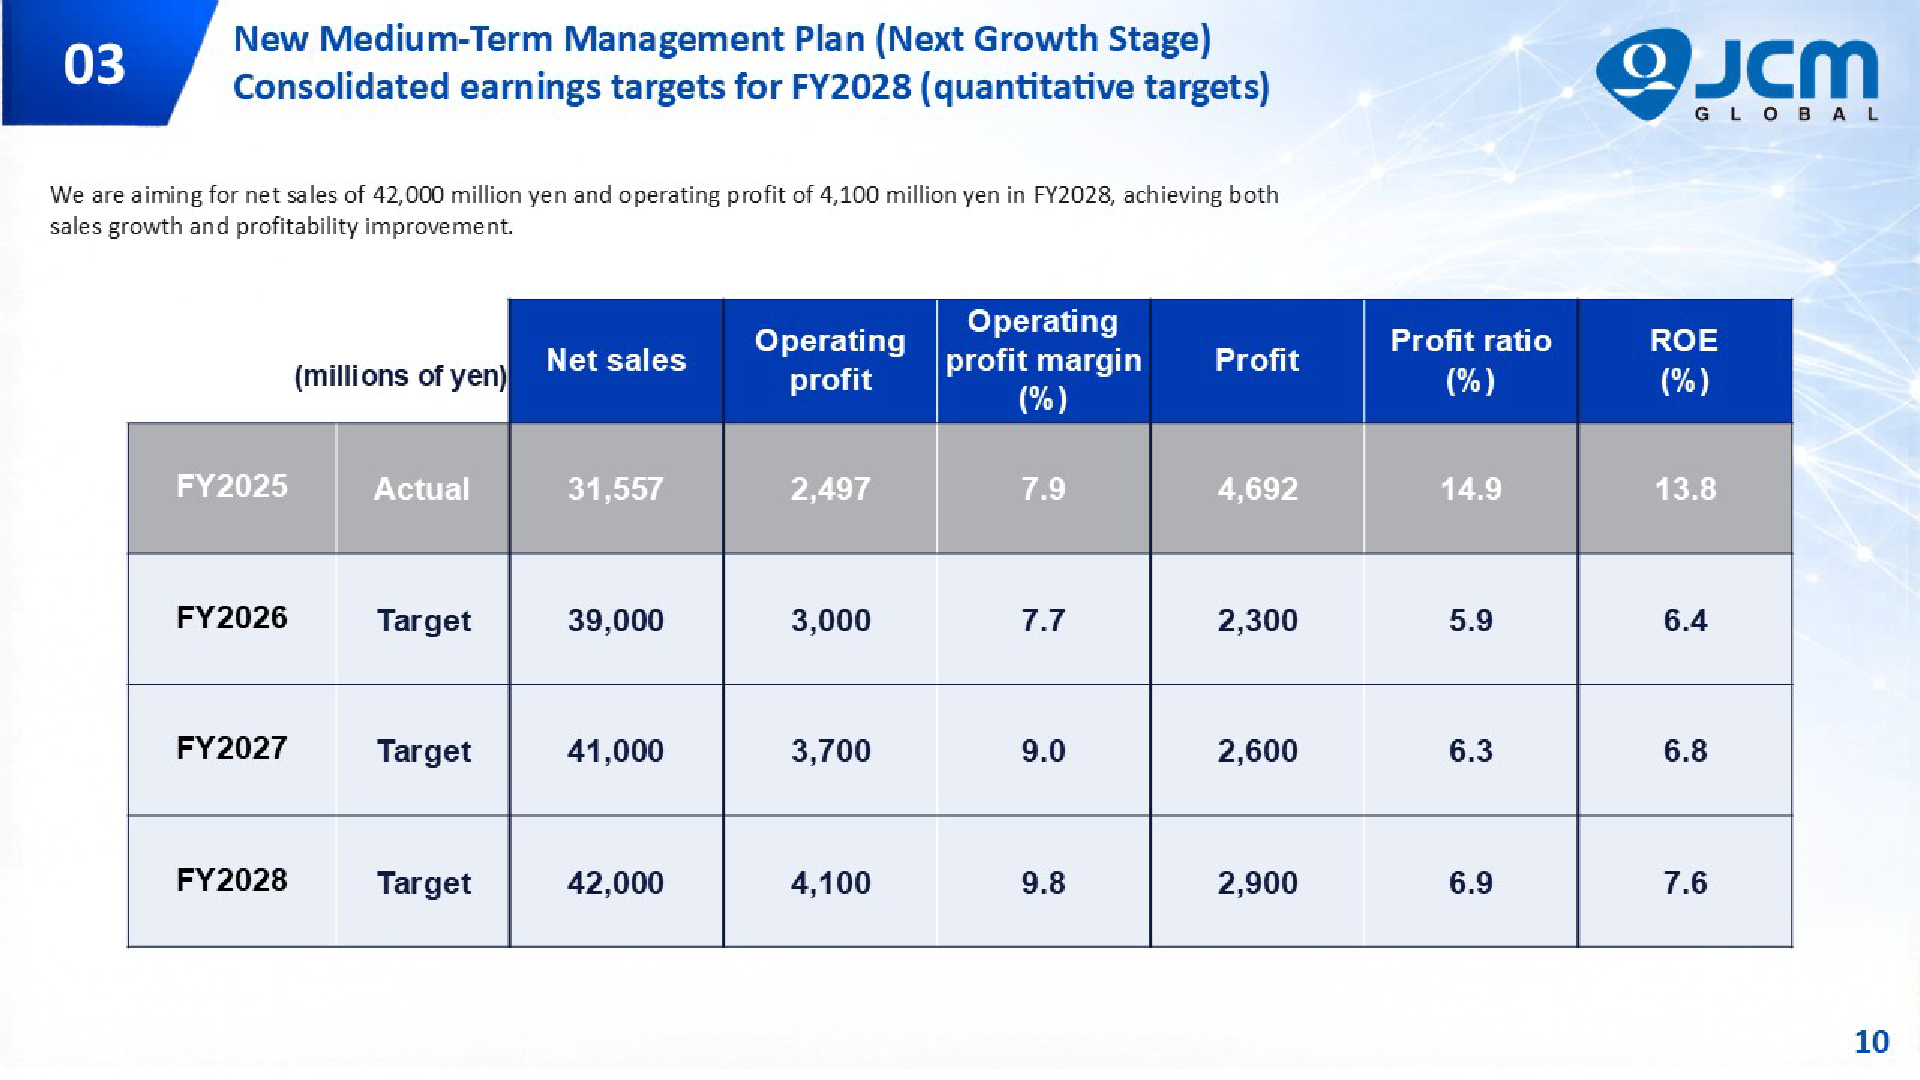
Under the new Medium-Term Management Plan (Next Growth Stage), the company is aiming for net sales of 42,000 million yen and operating profit of 4,100 million yen in FY2028, achieving both sales growth and profitability improvement. For FY2026, the plan targets net sales of 39,000 million yen and operating profit of 3,000 million yen. By segment, the FY2026 targets are net sales of 23,300 million yen in Global Gaming and 11,000 million yen in International Commercial, positioning the commercial business as a second pillar.
| Fiscal year (Millions of yen) | Net sales | Operating profit | Operating profit margin (%) | Profit | ROE (%) |
|---|---|---|---|---|---|
| FY2025 (Actual) | 31,557 | 2,497 | 7.9 | 4,692 | 13.8 |
| FY2026 (Target) | 39,000 | 3,000 | 7.7 | 2,300 | 6.4 |
| FY2027 (Target) | 41,000 | 3,700 | 9.0 | 2,600 | 6.8 |
| FY2028 (Target) | 42,000 | 4,100 | 9.8 | 2,900 | 7.6 |
Shareholder Returns
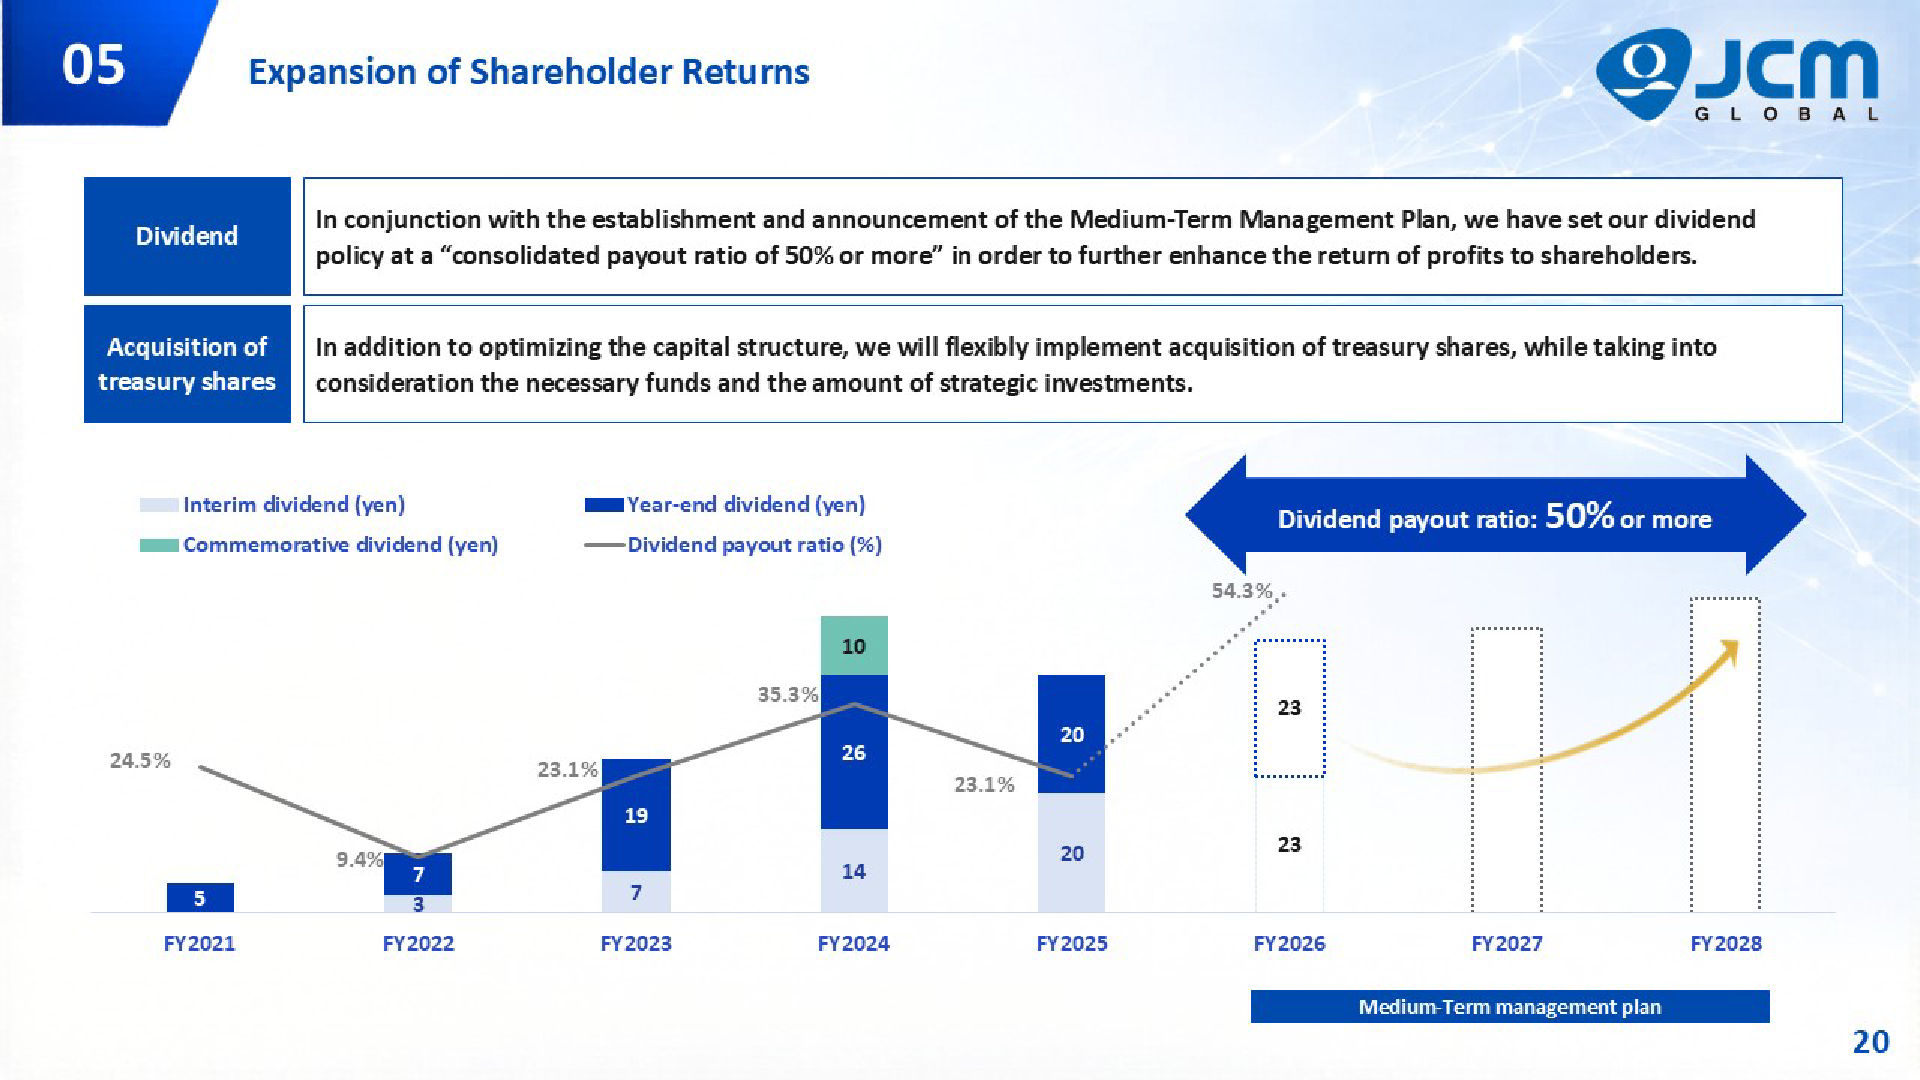
In conjunction with the establishment and announcement of the Medium-Term Management Plan, the company has set its dividend policy at a “consolidated payout ratio of 50% or more” in order to further enhance the return of profits to shareholders, raising the consolidated dividend payout ratio target from 30% or more to 50% or more. For FY2025, the dividend was an interim dividend of 20 yen and a year-end dividend of 20 yen, with a dividend payout ratio of 23.1%. For FY2026, the presentation shows an interim dividend of 23 yen and a year-end dividend of 23 yen, with a dividend payout ratio of 54.3%. In addition to optimizing the capital structure, the company will flexibly implement acquisition of treasury shares, while taking into consideration the necessary funds and the amount of strategic investments.
| Fiscal year | Interim dividend (yen) | Year-end dividend (yen) | Commemorative dividend (yen) | Dividend payout ratio (%) |
|---|---|---|---|---|
| FY2023 | 7 | 19 | – | 23.1% |
| FY2024 | 14 | 26 | 10 | 35.3% |
| FY2025 | 20 | 20 | – | 23.1% |
| FY2026 (Plan) | 23 | 23 | – | 54.3% |
Medium-Term Plan / Topics
The new Medium-Term Management Plan sets financial targets for FY2028 of net sales CAGR of 10% (2025–2028), an operating profit margin of 10%, ROE of 8%, and an international commercial sales ratio of 38% (15% in FY2025). The shareholder return policy is a dividend payout ratio of 50% or more. Cash allocation over FY2026–FY2028 draws on sources of 31,000 million yen — operating cash flow of 12,000 million yen and cash on hand of 19,000 million yen (including 5,000 million yen related to the sale of the Tokyo Head Office) — allocated to shareholder returns of 4,100 million yen, existing investment of 3,000 million yen, M&A and growth investments of 15,000 million yen, business acquisition of 3,000 million yen, and a flexible funding facility of 5,900 million yen. In March 2026, the company decided to acquire the medium- and small-sized recycler/dispenser manufacturing and sales business from Fujitsu Frontech Limited, strengthening development infrastructure and expanding the product lineup and customer network in the commercial business. Under the long-term vision “JCM Global Vision 2032,” the company positions FY2032 net sales of 55,000 million yen, aiming to become a company that continues to provide customers with trust in the increasingly diverse money transaction industry and a brand company in new business areas.
This article is an analysis based on publicly available information and is not a recommendation to buy or sell any specific securities. Investment decisions are your own responsibility.
![[Obayashi] Investors’ Guide 2026 — The Complete 24-Article Breakdown](https://japan-equity.com/wp-content/uploads/2026/07/hub_cover-1024x1024.png)
![[Obayashi] IR & SR Policy — Feeding Dialogue Back into Management](https://japan-equity.com/wp-content/uploads/2026/07/p32_sq-1024x1024.jpg)
![[Obayashi] Real Estate Development — 18.7% Margin, ¥287.7bn Unrealized Gains](https://japan-equity.com/wp-content/uploads/2026/07/p20_sq-1024x1024.jpg)
![[Obayashi] Domestic Civil Engineering — Resilience Spending Supports 9.6% Margin](https://japan-equity.com/wp-content/uploads/2026/07/p11_sq-1024x1024.jpg)
![[Obayashi] Share Price & External Ratings — vs TOPIX, ESG Index Inclusion](https://japan-equity.com/wp-content/uploads/2026/07/p40_sq-1024x1024.jpg)
![[Construction] ¥75.5tn Investment, Shrinking Workforce — Big-5 Market Share](https://japan-equity.com/wp-content/uploads/2026/07/p12_sq-1024x1024.jpg)



![[Obayashi] Capital Policy & Shareholder Returns — ROE 10%+, DOE ~5%, ¥100bn Buyback](https://japan-equity.com/wp-content/uploads/2026/07/p27_sq-1024x1024.jpg)
![[Obayashi] Reducing Cross-Shareholdings — ¥285.2bn Sold in Five Years](https://japan-equity.com/wp-content/uploads/2026/07/p29_sq-1024x1024.jpg)
![[Obayashi] ¥750bn Investment Plan — ¥300bn to Development, ¥190bn to Tech/DX](https://japan-equity.com/wp-content/uploads/2026/07/p30_sq-1024x1024.jpg)
![[Obayashi] MTP2022 KPIs — Operating Profit ~2x Target, ROE 14.4%](https://japan-equity.com/wp-content/uploads/2026/07/p25_sq-1024x1024.jpg)
![[Obayashi] Cash Allocation — ¥420bn Investment CF Over Five Years](https://japan-equity.com/wp-content/uploads/2026/07/p26_sq-1024x1024.jpg)
![[Obayashi] Green Energy — 44 Plants, 344MW, and the Green Hydrogen Challenge](https://japan-equity.com/wp-content/uploads/2026/07/p21_sq-1024x1024.jpg)
![[Obayashi] Tackling the Labor Shortage — Robotics Construction®](https://japan-equity.com/wp-content/uploads/2026/07/p14_sq-1024x1024.jpg)
