
This article is based on publicly available IR materials and is not a recommendation to buy or sell any specific securities.
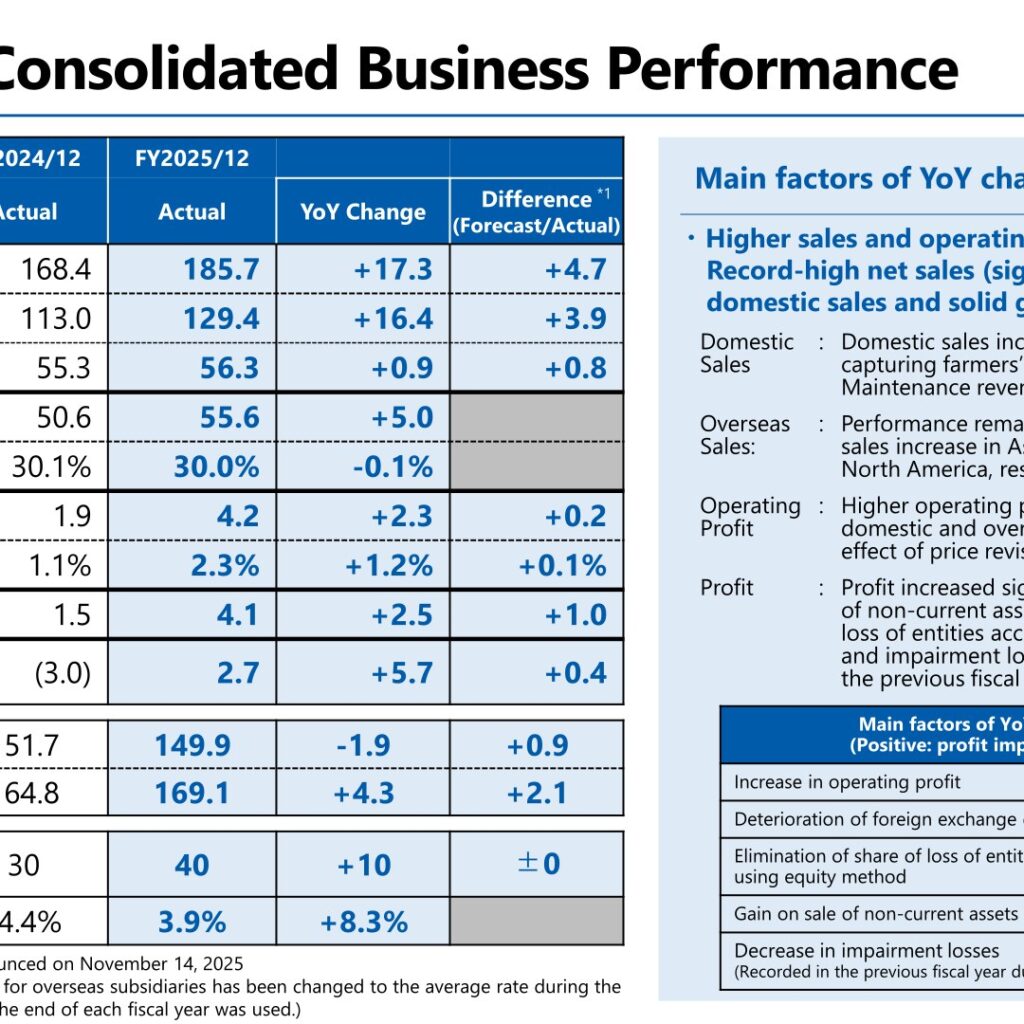
ISEKI & CO., LTD. posted record-high net sales of ¥185.7 billion for the fiscal year ended December 31, 2025, up ¥17.3 billion year on year and ¥4.7 billion above the forecast announced on November 14, 2025. Operating profit rose ¥2.3 billion to ¥4.2 billion and profit attributable to owners of parent came to ¥2.7 billion, against a loss of ¥(3.0) billion in the previous fiscal year. Inventories fell ¥9.1 billion and interest-bearing liabilities were reduced by ¥13.3 billion from December 31, 2024, while cash flows from operating activities reached a record high of positive ¥23.4 billion. The planned year-end dividend is ¥40 per share, an increase of ¥10 per share year on year.
Consolidated Results (Full-Year Actual)
The company describes the year as one of higher sales and operating profit, with record-high net sales driven by significant growth in domestic sales and solid growth in overseas sales. Domestic sales increased as a result of accurately capturing farmers’ strong purchasing appetite, and maintenance revenues continued to grow. Overseas, performance remained stable in Europe and a sales increase in Asia exceeded a sales decline in North America. Higher operating profit was due to the increases in domestic and overseas sales and the positive effect of price revisions. Profit increased significantly driven by gain on sale of non-current assets and the absence of share of loss of entities accounted for using equity method and impairment losses with structural reforms in the previous fiscal year. From 2025, the PL conversion rate for overseas subsidiaries has been changed to the average rate during the fiscal year (previously the rate at the end of each fiscal year was used).
| (JPY bn, unless otherwise noted) | FY2024/12 Actual | FY2025/12 Actual | YoY Change | Difference (Forecast/Actual) |
|---|---|---|---|---|
| Net Sales | 168.4 | 185.7 | +17.3 | +4.7 |
| (Domestic) | 113.0 | 129.4 | +16.4 | +3.9 |
| (Overseas) | 55.3 | 56.3 | +0.9 | +0.8 |
| Gross Profit | 50.6 | 55.6 | +5.0 | — |
| Gross Profit Margin (%) | 30.1% | 30.0% | -0.1% | — |
| Operating Profit | 1.9 | 4.2 | +2.3 | +0.2 |
| Operating Margin (%) | 1.1% | 2.3% | +1.2% | +0.1% |
| Ordinary Profit | 1.5 | 4.1 | +2.5 | +1.0 |
| Profit (Loss) Attributable to Owners of Parent | (3.0) | 2.7 | +5.7 | +0.4 |
| Average Exchange Rate US$ (JPY) | 151.7 | 149.9 | -1.9 | +0.9 |
| Average Exchange Rate Euro (JPY) | 164.8 | 169.1 | +4.3 | +2.1 |
| Year-end Dividend Per Share (JPY) | 30 | 40 | +10 | ±0 |
| ROE (%) | -4.4% | 3.9% | +8.3% | — |
The ¥2.3 billion increase in operating profit breaks down as higher sales +4.5, price +2.2, production costs -1.4, FOREX fluctuations +0.3, others -0.6 and SG&A -2.7 (JPY bn), with gross profit up ¥5.0 billion. SG&A expenses rose ¥2.7 billion to ¥51.4 billion, of which personnel expenses were ¥29.3 billion (+¥1.7 billion) and other expenses ¥22.0 billion (+¥0.9 billion).
Domestic Sales
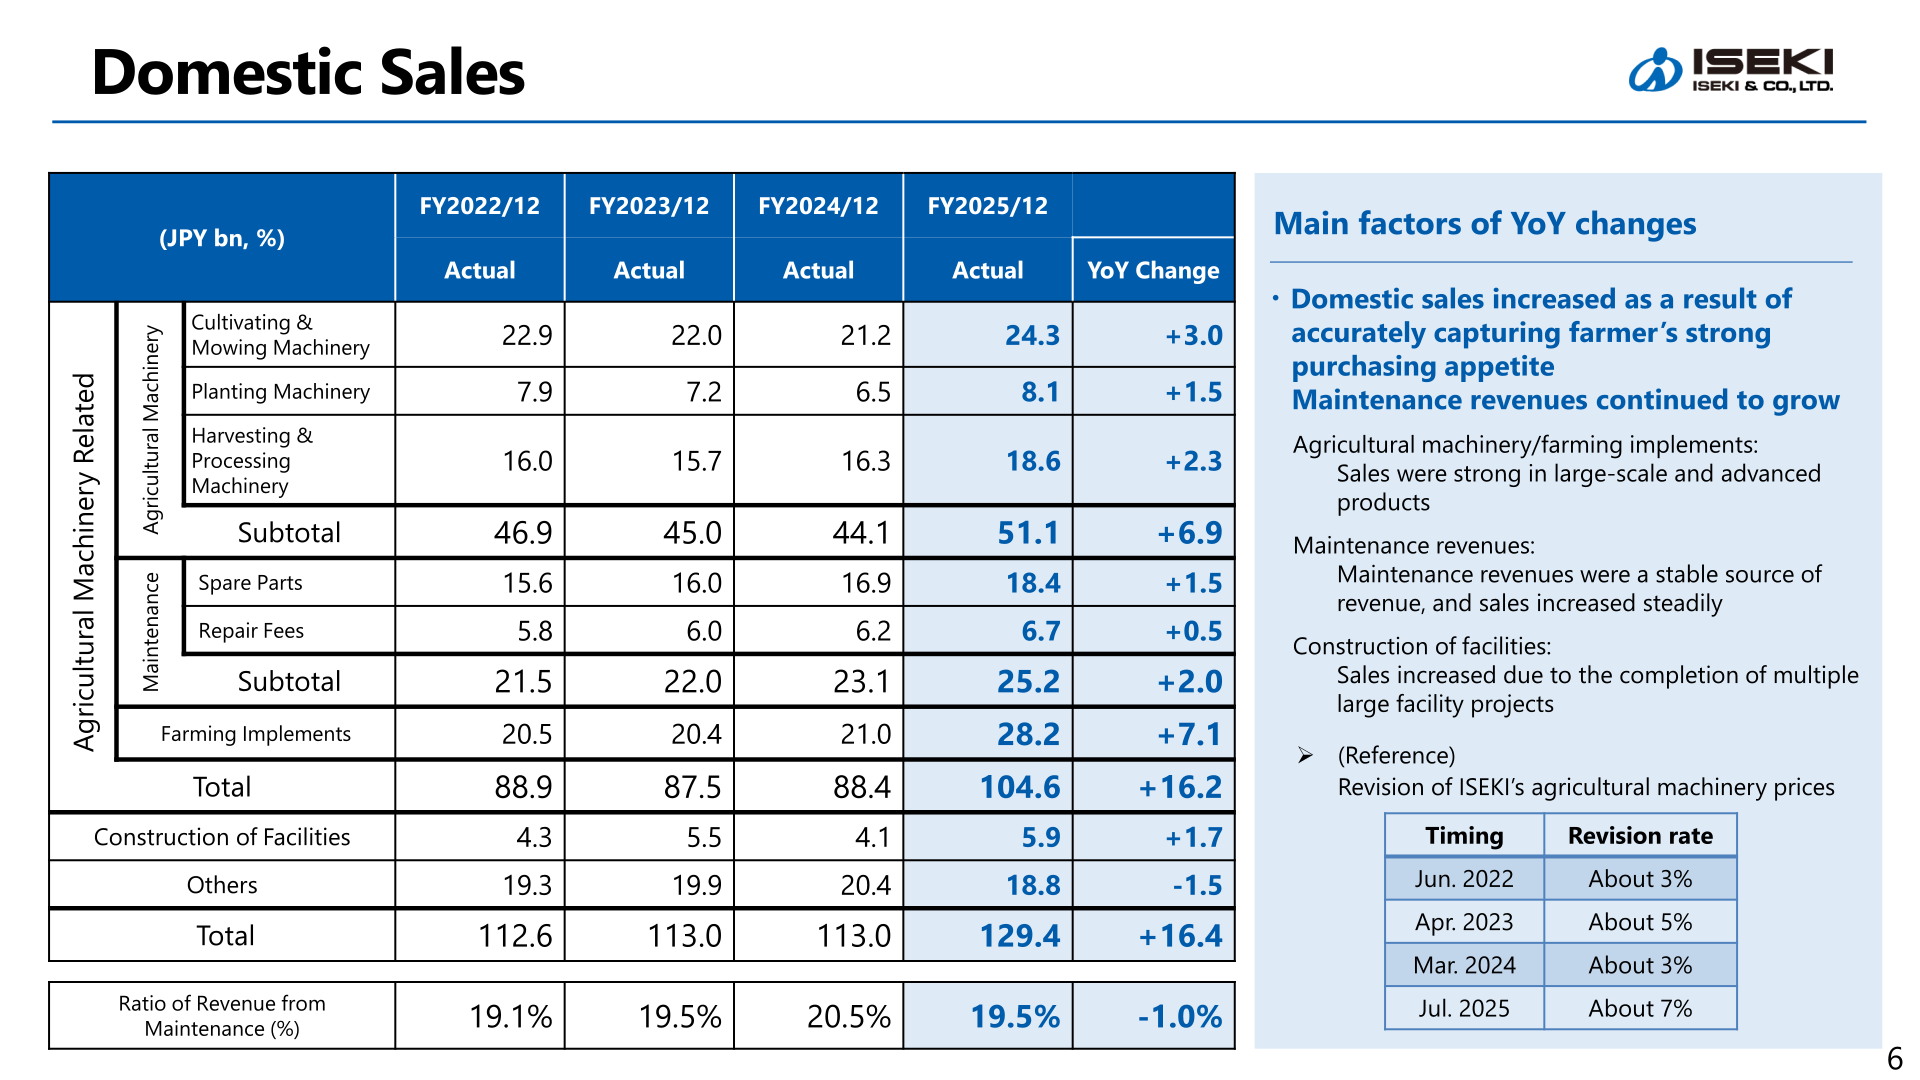
Domestic sales rose ¥16.4 billion to ¥129.4 billion. Sales of agricultural machinery and farming implements were strong in large-scale and advanced products, maintenance revenues were a stable source of revenue and increased steadily, and sales of construction of facilities increased due to the completion of multiple large facility projects. The ratio of revenue from maintenance was 19.5%, down 1.0 point. As a reference, the presentation lists ISEKI’s agricultural machinery price revisions: about 3% in June 2022, about 5% in April 2023, about 3% in March 2024 and about 7% in July 2025.
| Domestic Sales (JPY bn, %) | FY2024/12 Actual | FY2025/12 Actual | YoY Change |
|---|---|---|---|
| Cultivating & Mowing Machinery | 21.2 | 24.3 | +3.0 |
| Planting Machinery | 6.5 | 8.1 | +1.5 |
| Harvesting & Processing Machinery | 16.3 | 18.6 | +2.3 |
| Agricultural Machinery Subtotal | 44.1 | 51.1 | +6.9 |
| Spare Parts | 16.9 | 18.4 | +1.5 |
| Repair Fees | 6.2 | 6.7 | +0.5 |
| Maintenance Subtotal | 23.1 | 25.2 | +2.0 |
| Farming Implements | 21.0 | 28.2 | +7.1 |
| Agricultural Machinery Related Total | 88.4 | 104.6 | +16.2 |
| Construction of Facilities | 4.1 | 5.9 | +1.7 |
| Others | 20.4 | 18.8 | -1.5 |
| Total | 113.0 | 129.4 | +16.4 |
| Ratio of Revenue from Maintenance (%) | 20.5% | 19.5% | -1.0% |
Overseas Sales
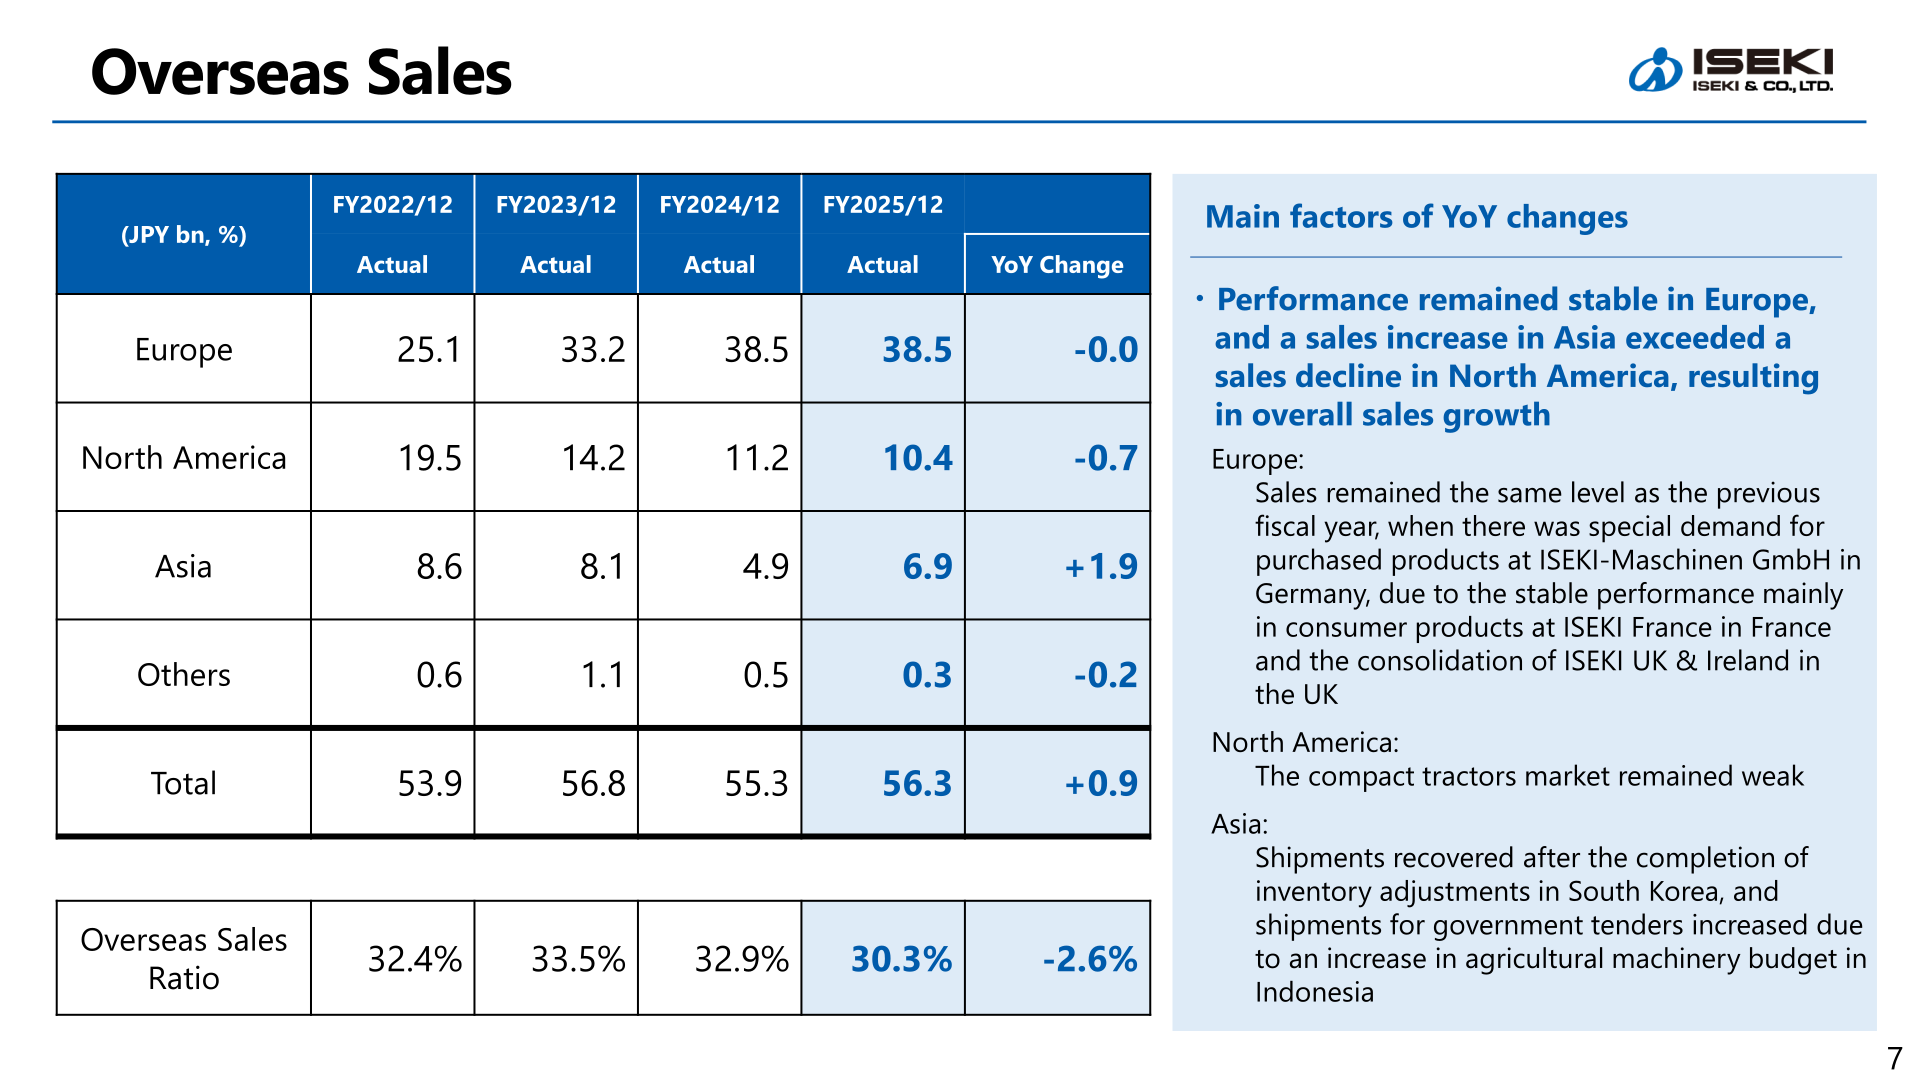
Overseas sales increased ¥0.9 billion to ¥56.3 billion, and the overseas sales ratio was 30.3%, down 2.6 points. In Europe, sales remained the same level as the previous fiscal year, when there was special demand for purchased products at ISEKI-Maschinen GmbH in Germany, due to the stable performance mainly in consumer products at ISEKI France in France and the consolidation of ISEKI UK & Ireland in the UK. In North America the compact tractors market remained weak; the company notes market unit sales for January to December 2025 of -8% year on year and its own local retail unit sales at -12% year on year. In Asia, shipments recovered after the completion of inventory adjustments in South Korea, and shipments for government tenders increased due to an increase in agricultural machinery budget in Indonesia.
| Overseas Sales (JPY bn, %) | FY2024/12 Actual | FY2025/12 Actual | YoY Change |
|---|---|---|---|
| Europe | 38.5 | 38.5 | -0.0 |
| North America | 11.2 | 10.4 | -0.7 |
| Asia | 4.9 | 6.9 | +1.9 |
| Others | 0.5 | 0.3 | -0.2 |
| Total | 55.3 | 56.3 | +0.9 |
| Overseas Sales Ratio | 32.9% | 30.3% | -2.6% |
Balance Sheet and Cash Flows
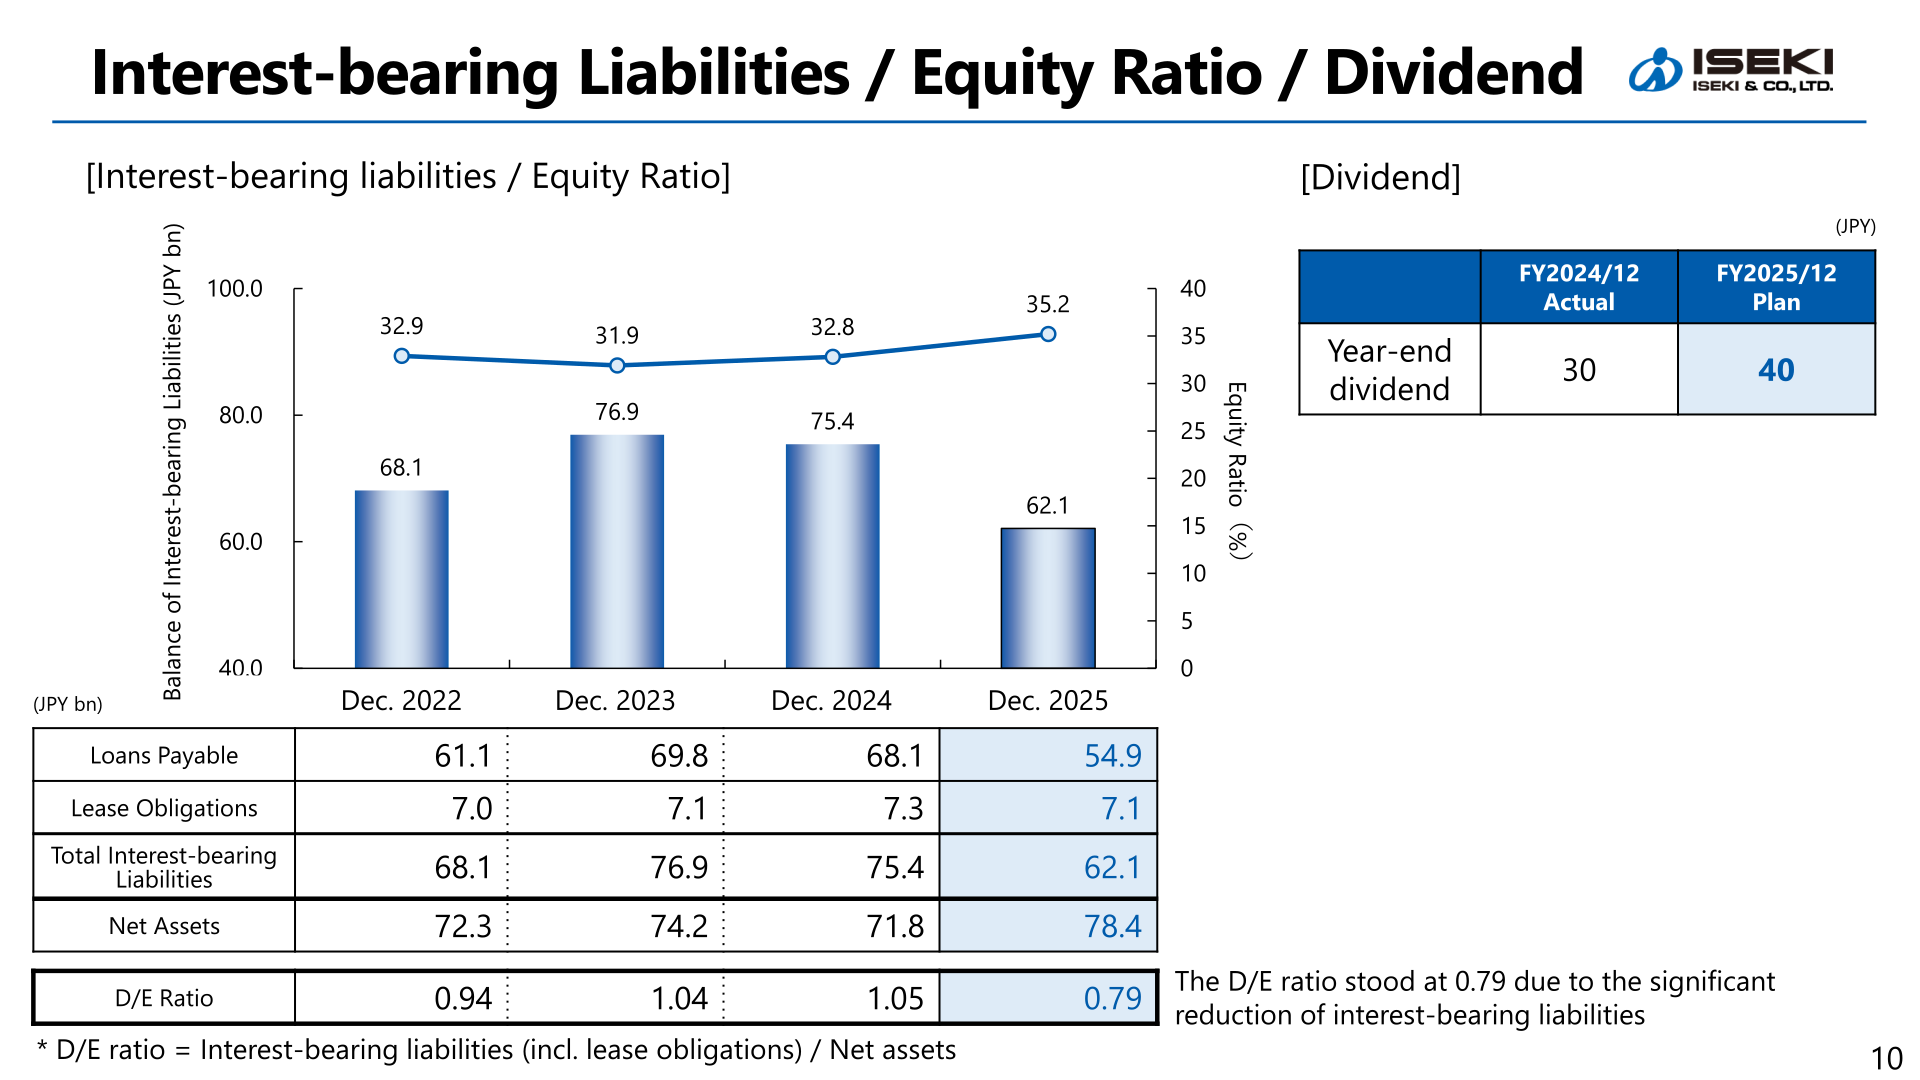
Total assets stood at ¥209.4 billion as of December 31, 2025, up ¥3.3 billion from a year earlier. Inventories decreased ¥9.1 billion to ¥57.7 billion on strong domestic sales, while cash and deposits rose ¥4.6 billion to ¥12.8 billion. Interest-bearing liabilities were cut ¥13.3 billion to ¥62.1 billion, of which loans payable were ¥54.9 billion, and net assets increased ¥6.5 billion to ¥78.4 billion. The D/E ratio stood at 0.79, compared with 1.05 a year earlier. Cash flows from operating activities improved ¥14.6 billion to positive ¥23.4 billion, and free cash flow was positive ¥19.0 billion, an improvement of ¥16.0 billion. Capital investment was ¥5.7 billion, depreciation ¥5.20 billion and research and development expenses ¥1.93 billion.
FY2026 Forecast
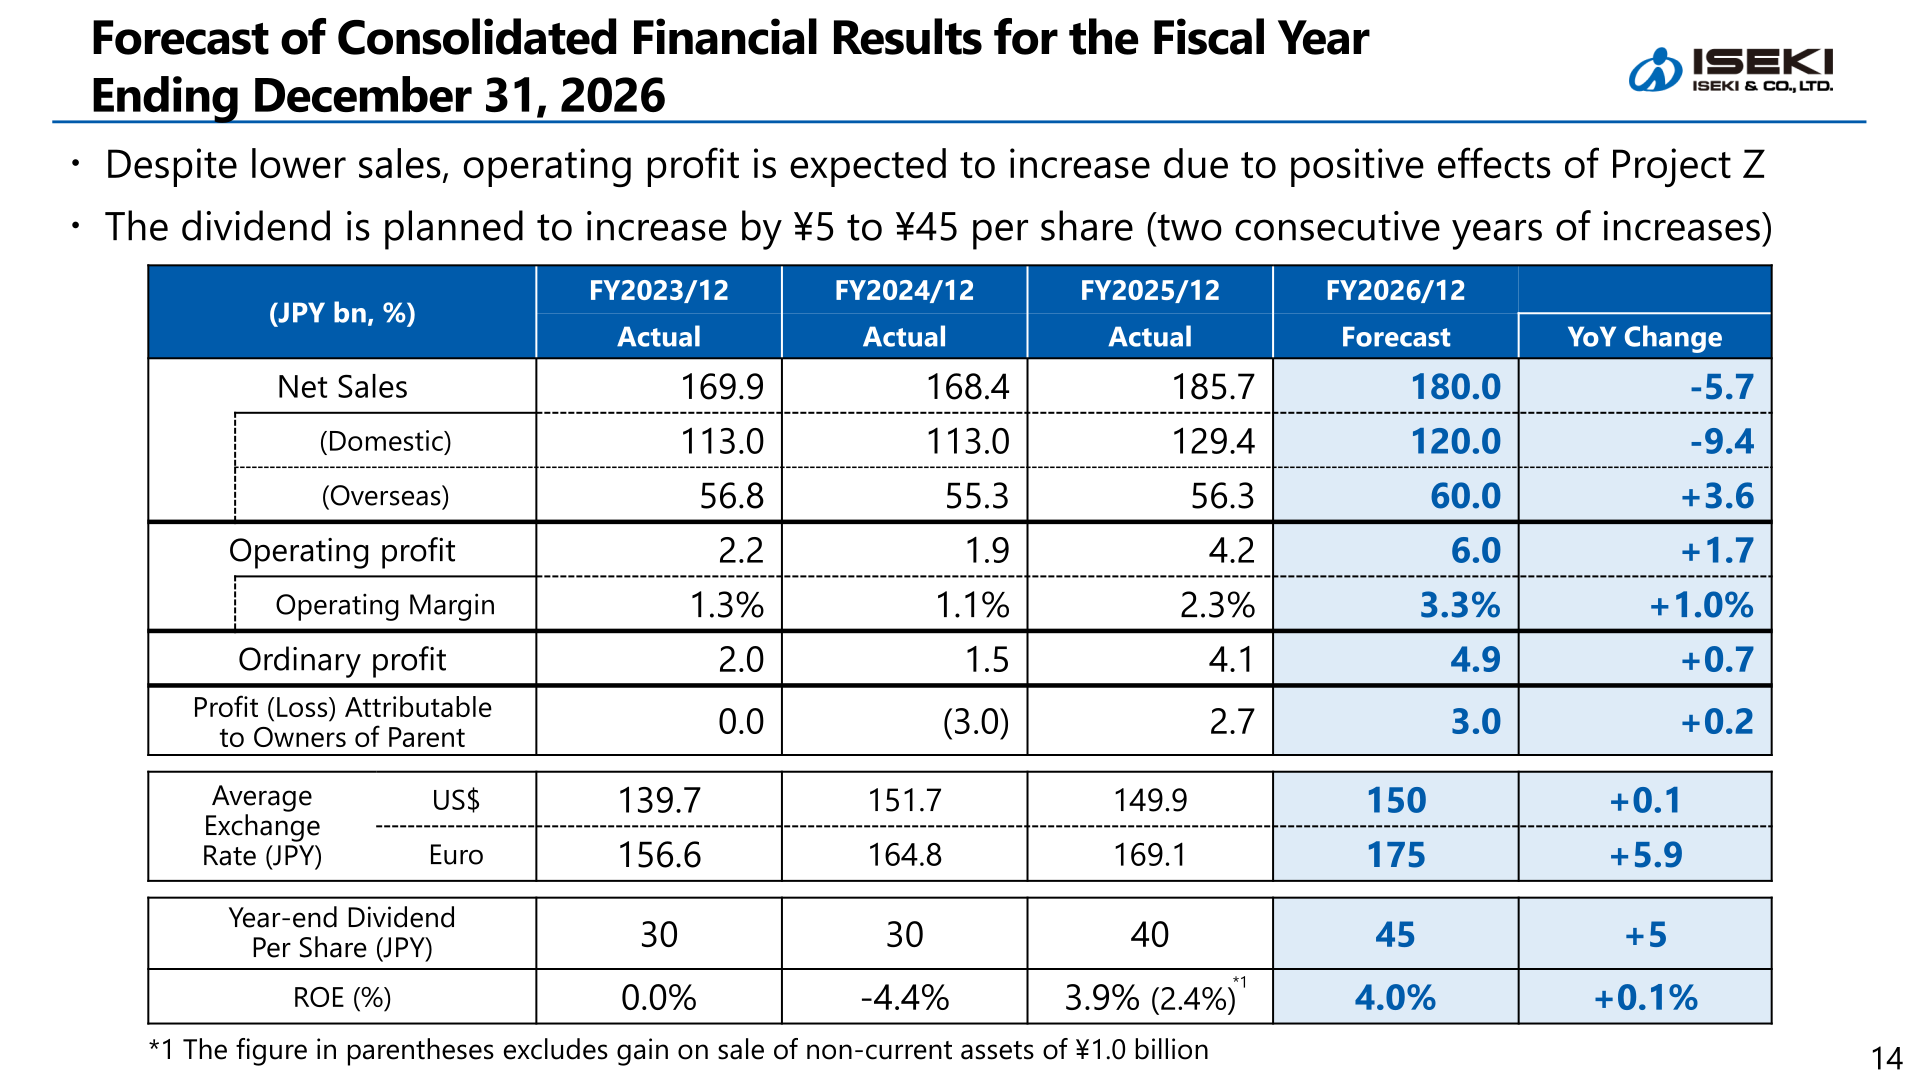
For the fiscal year ending December 31, 2026, ISEKI forecasts net sales of ¥180.0 billion (-¥5.7 billion year on year) and operating profit of ¥6.0 billion (+¥1.7 billion), for an operating margin of 3.3%. Despite lower sales, operating profit is expected to increase due to positive effects of Project Z. Domestic sales are forecast at ¥120.0 billion, down ¥9.4 billion, as sales are expected to decrease due to a temporary shortage in production capacity even though demand remains steady, while overseas sales are forecast at ¥60.0 billion, up ¥3.6 billion, on solid demand in Europe (¥41.8 billion) and the compact tractor market bottoming out in North America (¥11.3 billion). The exchange rate assumptions are ¥150 to the US dollar and ¥175 to the euro. The capital investment plan for 2026 is ¥12.5 billion, of which investment in optimization is ¥8.0 billion.
| (JPY bn, %) | FY2025/12 Actual | FY2026/12 Forecast | YoY Change |
|---|---|---|---|
| Net Sales | 185.7 | 180.0 | -5.7 |
| (Domestic) | 129.4 | 120.0 | -9.4 |
| (Overseas) | 56.3 | 60.0 | +3.6 |
| Operating profit | 4.2 | 6.0 | +1.7 |
| Operating Margin | 2.3% | 3.3% | +1.0% |
| Ordinary profit | 4.1 | 4.9 | +0.7 |
| Profit (Loss) Attributable to Owners of Parent | 2.7 | 3.0 | +0.2 |
| Average Exchange Rate US$ (JPY) | 149.9 | 150 | +0.1 |
| Average Exchange Rate Euro (JPY) | 169.1 | 175 | +5.9 |
| Year-end Dividend Per Share (JPY) | 40 | 45 | +5 |
| ROE (%) | 3.9% (2.4%) | 4.0% | +0.1% |
Shareholder Returns
The planned year-end dividend for FY2025/12 is ¥40 per share, an increase of ¥10 per share from the ¥30 paid for FY2024/12 and unchanged from the previous forecast. For FY2026/12 the dividend is planned to increase by a further ¥5 to ¥45 per share, which would mark two consecutive years of increases. ROE was 3.9% in FY2025/12 (2.4% excluding gain on sale of non-current assets of ¥1.0 billion), against -4.4% in the previous fiscal year, and is forecast at 4.0% for FY2026/12.
Project Z and Product Strategy
Expected effects of Project Z for 2025 progressed as planned: the effect on operating profit was +1.5 against a plan of +1.5, with temporary expenses of -0.8 against a plan of -0.8 (JPY bn). Measured against 2024, the cumulative effect is 1.5 for 2025 and 3.8 for 2026 (+2.3), with temporary expenses of 0.8 and 0.3 (-0.5), for a net impact of 0.7 and 3.5 (+2.8). In Japan, ISEKI is expanding its large-scale and advanced product lineup, with the BJ Series tractor launching in June 2026 and the HJ Series combine harvester launching at end-2026, and the FM Series combine harvester equipped with a straight driving assist function. In 2025, large-scale machinery accounted for over 40% of ISEKI’s product sales, and the company states it is likely to achieve its 2030 target of “50% or more” ahead of schedule.
This article is an analysis based on publicly available information and is not a recommendation to buy or sell any specific securities. Investment decisions are your own responsibility.
![[Obayashi] Investors’ Guide 2026 — The Complete 24-Article Breakdown](https://japan-equity.com/wp-content/uploads/2026/07/hub_cover-1024x1024.png)
![[Obayashi] IR & SR Policy — Feeding Dialogue Back into Management](https://japan-equity.com/wp-content/uploads/2026/07/p32_sq-1024x1024.jpg)
![[Obayashi] Real Estate Development — 18.7% Margin, ¥287.7bn Unrealized Gains](https://japan-equity.com/wp-content/uploads/2026/07/p20_sq-1024x1024.jpg)
![[Obayashi] Domestic Civil Engineering — Resilience Spending Supports 9.6% Margin](https://japan-equity.com/wp-content/uploads/2026/07/p11_sq-1024x1024.jpg)
![[Obayashi] Share Price & External Ratings — vs TOPIX, ESG Index Inclusion](https://japan-equity.com/wp-content/uploads/2026/07/p40_sq-1024x1024.jpg)
![[Construction] ¥75.5tn Investment, Shrinking Workforce — Big-5 Market Share](https://japan-equity.com/wp-content/uploads/2026/07/p12_sq-1024x1024.jpg)



![[Obayashi] Capital Policy & Shareholder Returns — ROE 10%+, DOE ~5%, ¥100bn Buyback](https://japan-equity.com/wp-content/uploads/2026/07/p27_sq-1024x1024.jpg)
![[Obayashi] Reducing Cross-Shareholdings — ¥285.2bn Sold in Five Years](https://japan-equity.com/wp-content/uploads/2026/07/p29_sq-1024x1024.jpg)
![[Obayashi] ¥750bn Investment Plan — ¥300bn to Development, ¥190bn to Tech/DX](https://japan-equity.com/wp-content/uploads/2026/07/p30_sq-1024x1024.jpg)
![[Obayashi] MTP2022 KPIs — Operating Profit ~2x Target, ROE 14.4%](https://japan-equity.com/wp-content/uploads/2026/07/p25_sq-1024x1024.jpg)
![[Obayashi] Cash Allocation — ¥420bn Investment CF Over Five Years](https://japan-equity.com/wp-content/uploads/2026/07/p26_sq-1024x1024.jpg)
![[Obayashi] Green Energy — 44 Plants, 344MW, and the Green Hydrogen Challenge](https://japan-equity.com/wp-content/uploads/2026/07/p21_sq-1024x1024.jpg)
![[Obayashi] Tackling the Labor Shortage — Robotics Construction®](https://japan-equity.com/wp-content/uploads/2026/07/p14_sq-1024x1024.jpg)
