
This article is based on publicly available IR materials and is not a recommendation to buy or sell any specific securities.
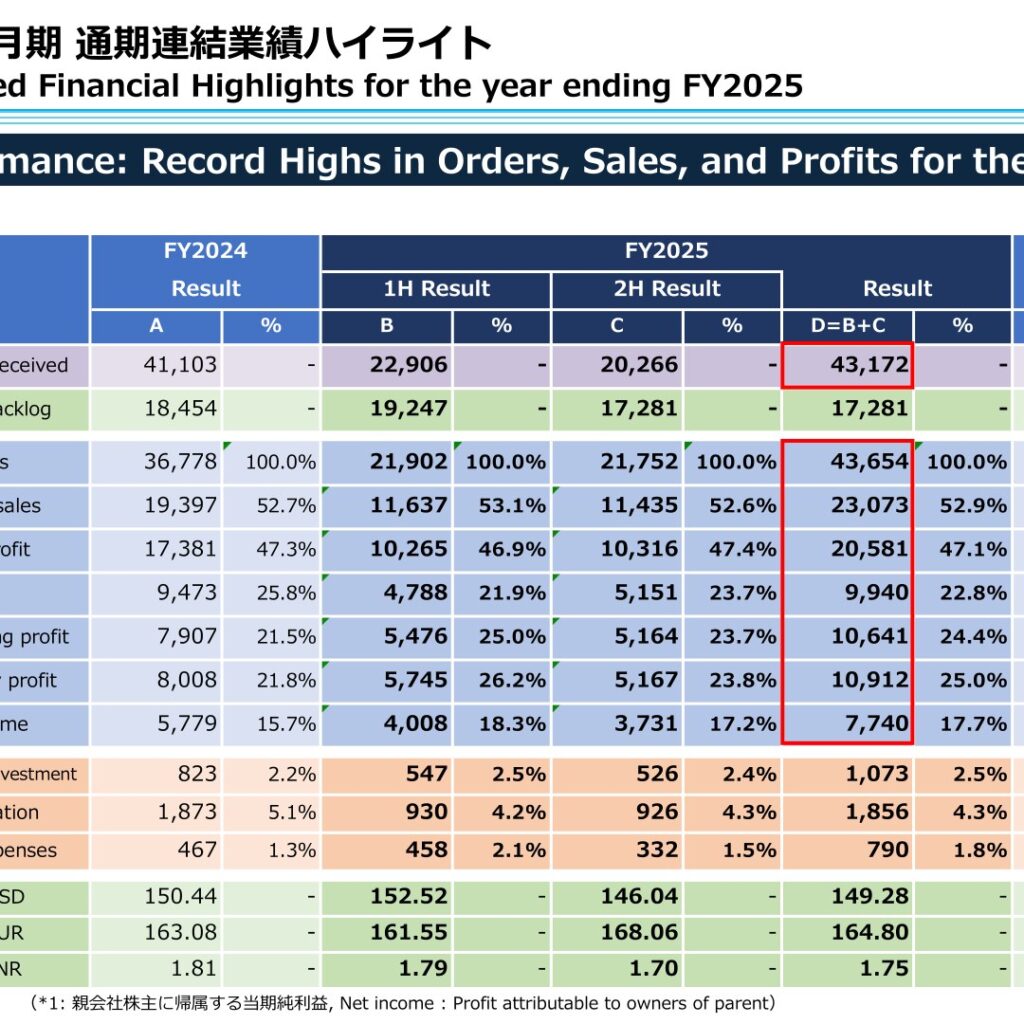
Nissei ASB Machine Co., Ltd. (TSE Prime market, 6284), a maker of stretch blow molding machines for PET and other plastic containers, reported its results for the year ending September 2025 (FY2025) on November 26, 2025. The company described the year as “Excellent Performance: Record Highs in Orders, Sales, and Profits for the Full Fiscal Year.” Net sales rose 18.7% year on year to 43,654 million yen, operating profit rose 34.6% to 10,641 million yen, and net income rose 33.9% to 7,740 million yen. Orders received also reached a record high of 43,172 million yen, up 5.0%.
Consolidated Results (Full-Year Actual)
All figures are in millions of yen (Mn JPY) as presented in the materials. Gross profit increased 18.4% to 20,581 million yen, and the gross margin was 47.1% versus 47.3% in FY2024. SG&A expenses rose only 4.9% to 9,940 million yen, so the operating margin improved to 24.4% from 21.5%. Ordinary profit rose 36.3% to 10,912 million yen. Order backlog fell 6.4% to 17,281 million yen; the company notes that sales progressed and backlog decreased but remained at a high level of JPY 17.2 billion. Average FX rates for the period were USD 149.28, EUR 164.80 and INR 1.75.
| Item (Mn JPY) | FY2024 Result | FY2025 Result | YoY |
|---|---|---|---|
| Orders received | 41,103 | 43,172 | +2,069 (+5.0%) |
| Order backlog | 18,454 | 17,281 | -1,172 (-6.4%) |
| Net sales | 36,778 | 43,654 | +6,875 (+18.7%) |
| Cost of sales | 19,397 | 23,073 | +3,675 (+18.9%) |
| Gross profit | 17,381 | 20,581 | +3,200 (+18.4%) |
| SG&A | 9,473 | 9,940 | +466 (+4.9%) |
| Operating profit | 7,907 | 10,641 | +2,733 (+34.6%) |
| Ordinary profit | 8,008 | 10,912 | +2,903 (+36.3%) |
| Net income (Profit attributable to owners of parent) | 5,779 | 7,740 | +1,961 (+33.9%) |
| Capital investment | 823 | 1,073 | +250 (+30.4%) |
| Depreciation | 1,873 | 1,856 | -17 (-0.9%) |
| R&D expenses | 467 | 790 | +323 (+69.2%) |
The materials break down the 2,733 million yen increase in operating profit as follows: FX impact -237 million yen (gross profit -417 million yen, SG&A +180 million yen), net increase in sales volume excluding FX impact +3,669 million yen, changes in product mix etc. -51 million yen, increase in R&D expenses -323 million yen, and net increase in other SG&A expenses excluding FX impact -324 million yen. The company notes that the negative impact from FX fluctuations expanded due to the appreciation of the yen against the Brazilian real (-10.1%), Mexican peso (-10.9%) and Indian rupee (-3.3%).
On the balance sheet, total assets increased 5,624 million yen to 78,386 million yen and total net assets increased 6,097 million yen to 58,946 million yen. Cash and deposits rose 4,029 million yen to 32,469 million yen, which the company describes as securing high levels of cash liquidity for future growth investments. Inventories declined 463 million yen to 17,714 million yen, and borrowings fell 1,493 million yen to 6,118 million yen. For the year, EPS was 516.36 yen, BPS was 3,928.27 yen, ROE was 13.9%, ROIC 11.4% and ROA 10.2%.
Segment Results
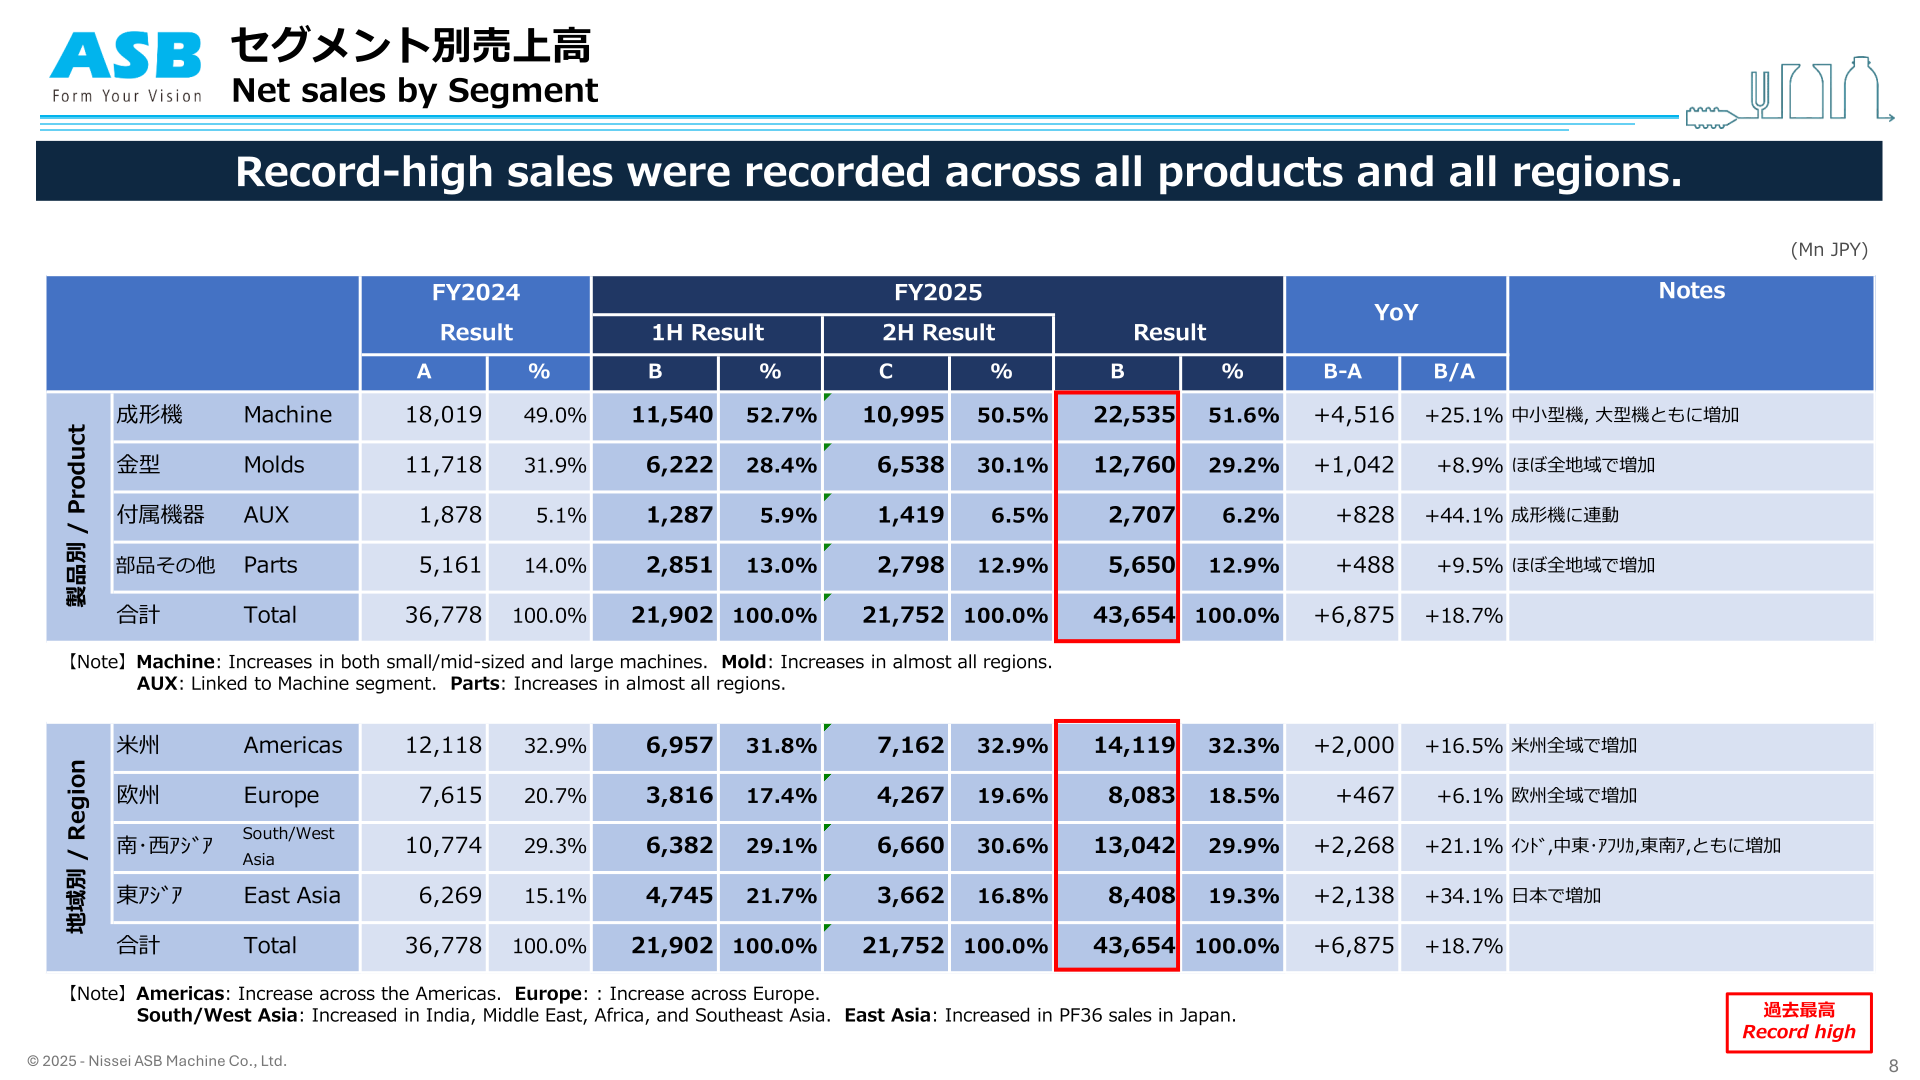
The company reports by product (Machine, Molds, AUX, Parts) and by region (Americas, Europe, South/West Asia, East Asia). On sales, record-high sales were recorded across all products and all regions. Machine sales rose 25.1% to 22,535 million yen on increases in both small/mid-sized and large machines, Molds rose 8.9% to 12,760 million yen, AUX rose 44.1% to 2,707 million yen linked to the Machine segment, and Parts rose 9.5% to 5,650 million yen. By region, East Asia grew the most at +34.1%, which the company attributes to increased PF36 sales in Japan.
| Category | Item (Mn JPY) | FY2024 Result | FY2025 Result | YoY |
|---|---|---|---|---|
| Product | Machine | 18,019 | 22,535 | +4,516 (+25.1%) |
| Product | Molds | 11,718 | 12,760 | +1,042 (+8.9%) |
| Product | AUX | 1,878 | 2,707 | +828 (+44.1%) |
| Product | Parts | 5,161 | 5,650 | +488 (+9.5%) |
| Product | Total | 36,778 | 43,654 | +6,875 (+18.7%) |
| Region | Americas | 12,118 | 14,119 | +2,000 (+16.5%) |
| Region | Europe | 7,615 | 8,083 | +467 (+6.1%) |
| Region | South/West Asia | 10,774 | 13,042 | +2,268 (+21.1%) |
| Region | East Asia | 6,269 | 8,408 | +2,138 (+34.1%) |
| Region | Total | 36,778 | 43,654 | +6,875 (+18.7%) |
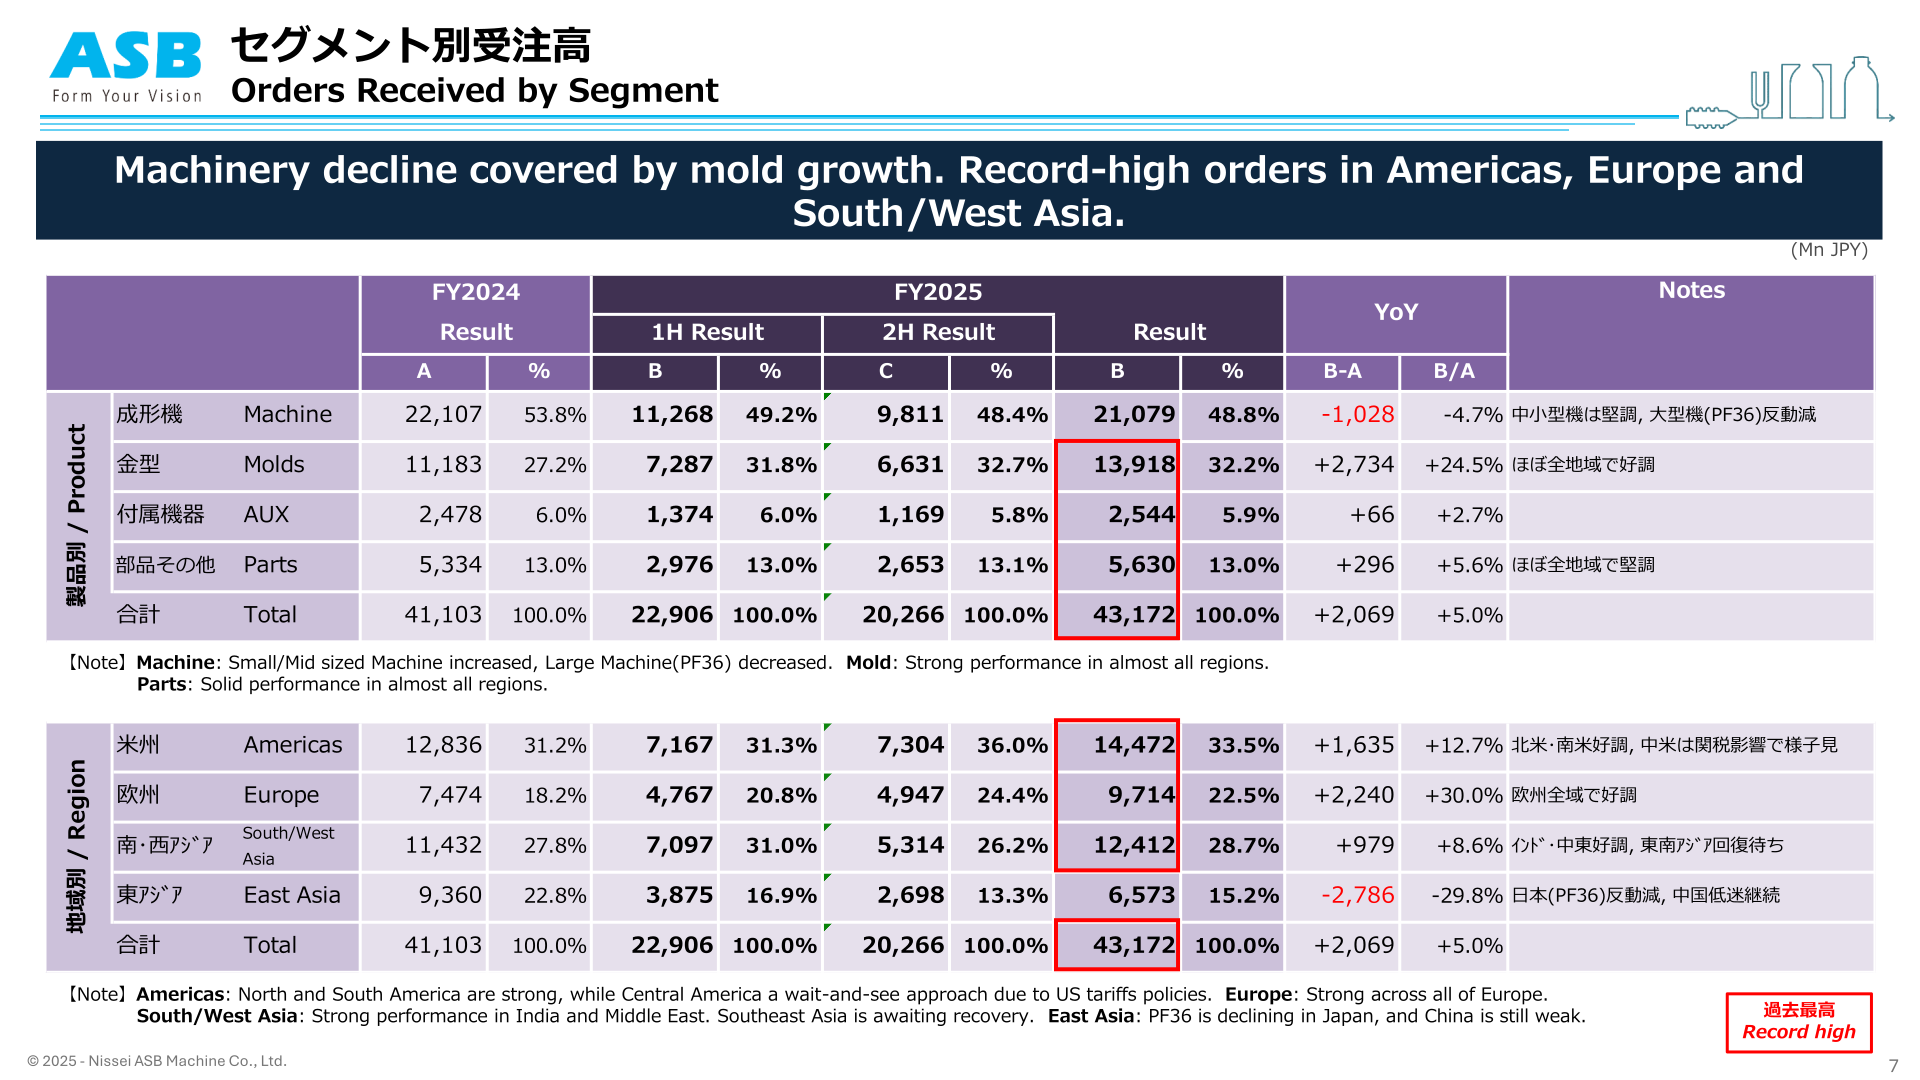
On orders received, the company summarises the year as “Machinery decline covered by mold growth. Record-high orders in Americas, Europe and South/West Asia.” Machine orders fell 4.7% to 21,079 million yen because small/mid sized machines increased while large machine (PF36) orders declined, while Molds orders rose 24.5% to 13,918 million yen on strong performance in almost all regions. By region, East Asia orders fell 29.8% to 6,573 million yen, reflecting the PF36 decline in Japan and continued weakness in China.
| Category | Item (Mn JPY) | FY2024 Result | FY2025 Result | YoY |
|---|---|---|---|---|
| Product | Machine | 22,107 | 21,079 | -1,028 (-4.7%) |
| Product | Molds | 11,183 | 13,918 | +2,734 (+24.5%) |
| Product | AUX | 2,478 | 2,544 | +66 (+2.7%) |
| Product | Parts | 5,334 | 5,630 | +296 (+5.6%) |
| Product | Total | 41,103 | 43,172 | +2,069 (+5.0%) |
| Region | Americas | 12,836 | 14,472 | +1,635 (+12.7%) |
| Region | Europe | 7,474 | 9,714 | +2,240 (+30.0%) |
| Region | South/West Asia | 11,432 | 12,412 | +979 (+8.6%) |
| Region | East Asia | 9,360 | 6,573 | -2,786 (-29.8%) |
| Region | Total | 41,103 | 43,172 | +2,069 (+5.0%) |
Order backlog by segment at the end of FY2025 was: Machine 8,997 million yen (-17.2%), Molds 6,679 million yen (+15.7%), AUX 1,290 million yen (-12.6%) and Parts 314 million yen (-8.0%). By region, Americas was 5,652 million yen (+4.1%), Europe 3,625 million yen (+81.7%), South/West Asia 4,035 million yen (-18.7%) and East Asia 3,967 million yen (-34.6%).
FY2026 Forecast
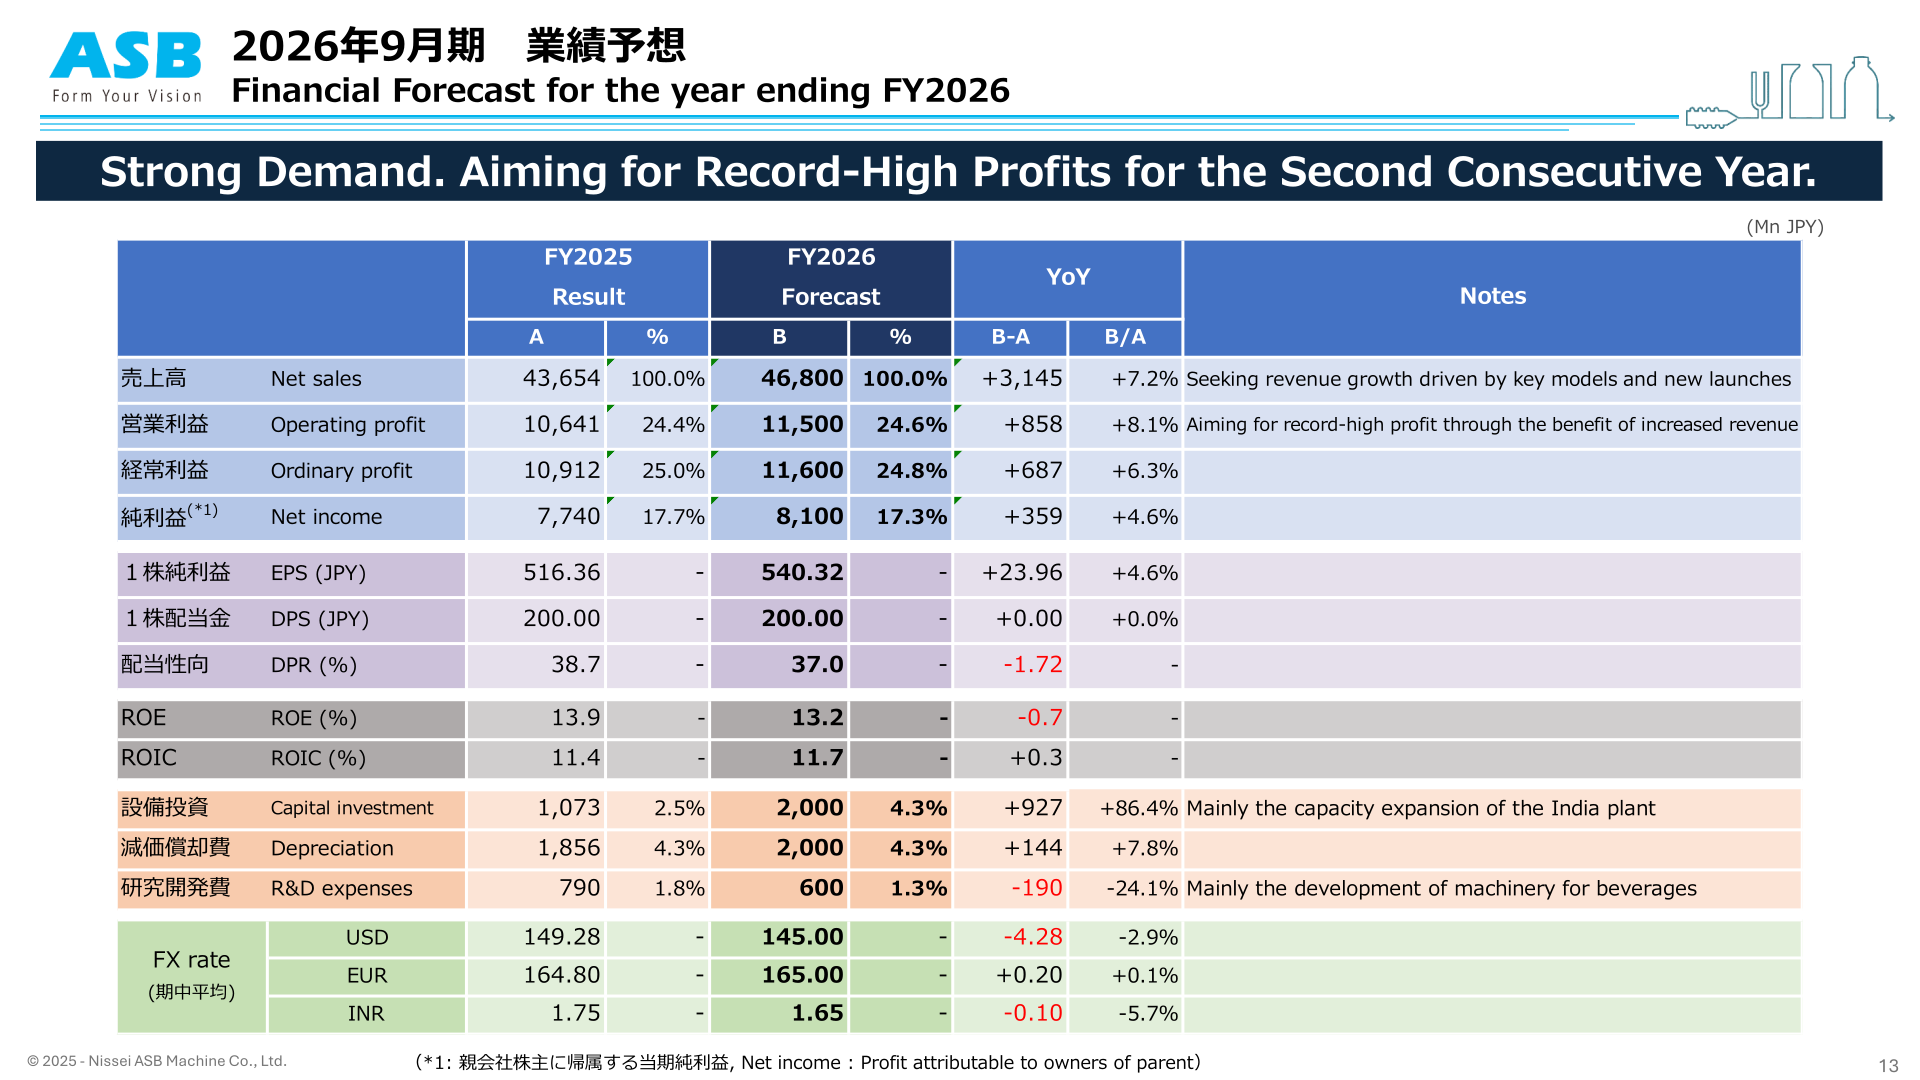
For the year ending September 2026 (FY2026), the company guides for “Strong Demand. Aiming for Record-High Profits for the Second Consecutive Year.” Net sales are forecast at 46,800 million yen (+7.2%), seeking revenue growth driven by key models and new launches, with operating profit of 11,500 million yen (+8.1%), ordinary profit of 11,600 million yen (+6.3%) and net income of 8,100 million yen (+4.6%). Capital investment is planned to rise 86.4% to 2,000 million yen, mainly for the capacity expansion of the India plant, while R&D expenses are planned to fall 24.1% to 600 million yen, mainly the development of machinery for beverages. Assumed FX rates are USD 145.00, EUR 165.00 and INR 1.65.
| Item | FY2025 Result | FY2026 Forecast | YoY |
|---|---|---|---|
| Net sales (Mn JPY) | 43,654 | 46,800 | +3,145 (+7.2%) |
| Operating profit (Mn JPY) | 10,641 | 11,500 | +858 (+8.1%) |
| Ordinary profit (Mn JPY) | 10,912 | 11,600 | +687 (+6.3%) |
| Net income (Mn JPY) | 7,740 | 8,100 | +359 (+4.6%) |
| EPS (JPY) | 516.36 | 540.32 | +23.96 (+4.6%) |
| DPS (JPY) | 200.00 | 200.00 | +0.00 (+0.0%) |
| DPR (%) | 38.7 | 37.0 | -1.72 |
| ROE (%) | 13.9 | 13.2 | -0.7 |
| ROIC (%) | 11.4 | 11.7 | +0.3 |
| Capital investment (Mn JPY) | 1,073 | 2,000 | +927 (+86.4%) |
| Depreciation (Mn JPY) | 1,856 | 2,000 | +144 (+7.8%) |
| R&D expenses (Mn JPY) | 790 | 600 | -190 (-24.1%) |
| FX rate USD | 149.28 | 145.00 | -4.28 (-2.9%) |
| FX rate EUR | 164.80 | 165.00 | +0.20 (+0.1%) |
| FX rate INR | 1.75 | 1.65 | -0.10 (-5.7%) |
On U.S. tariff policy, the company states that tariff costs will be minimized through price pass-through and the strategic shift of production from India to Japan. Additional tariff rates cited are 15% on machines (incl. AUX) shipped from Japan (large models) and 50% on those shipped from India (small/mid models); 50% on molds shipped from India; and 15% and 50% on parts shipped from Japan and India respectively. Countermeasures are price pass-through and shifting production from India to Japan for machines, partial pass-through to price for molds, and a tariff surcharge for parts. The P&L impact of tariff costs is approximately JPY 300 million, reflected in the FY2026 full-year plan.
Shareholder Returns
The dividend policy is “striving for continuous and stable dividends, aiming for a consolidated dividend payout ratio of 40%.” The materials note that the policy of aiming for 40% was established in FY2024 and the dividend level was raised, and that the company maintains a substantive progressive dividend policy, with no dividend reduction since FY2009 following the Global Financial Crisis. DPS for FY2025 was 200 yen with a payout ratio of 38.7% (FY2024: 150 yen, 38.9%), and the FY2026 plan is 200 yen with a payout ratio of 37.0%. DOE was 5.4% in FY2025 versus 4.4% in FY2024.
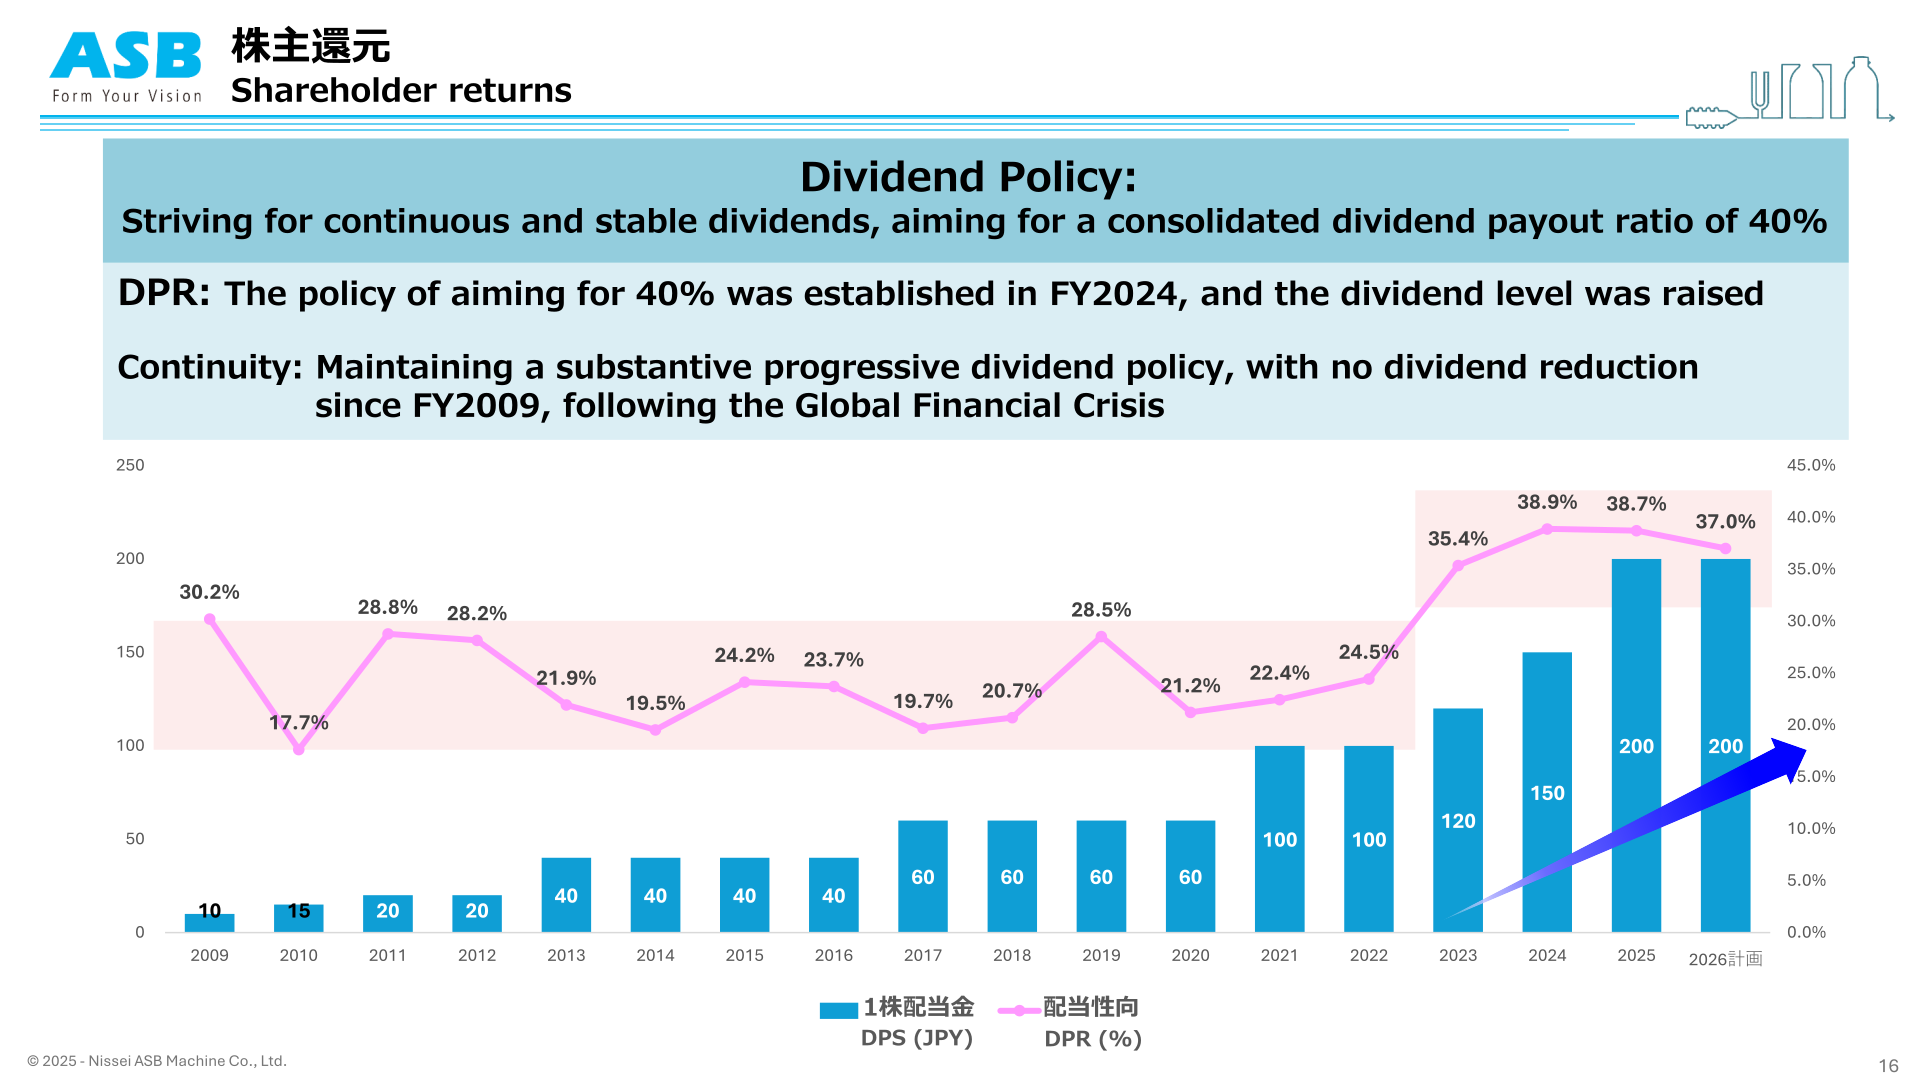
On corporate value, the company lists improvement of ROE through profit expansion under Project 50:50, enhancing shareholder returns (consolidated dividend payout ratio of 40%) and improving asset efficiency (reduction of inventory), together with reduction of capital costs through strengthened dialogue with shareholders. Cost of equity is calculated using the CAPM method; the indicators for the previous period are given as risk-free rate (1.5%) plus beta (1.02) multiplied by equity risk premium (6%).
Growth Strategy and Topics
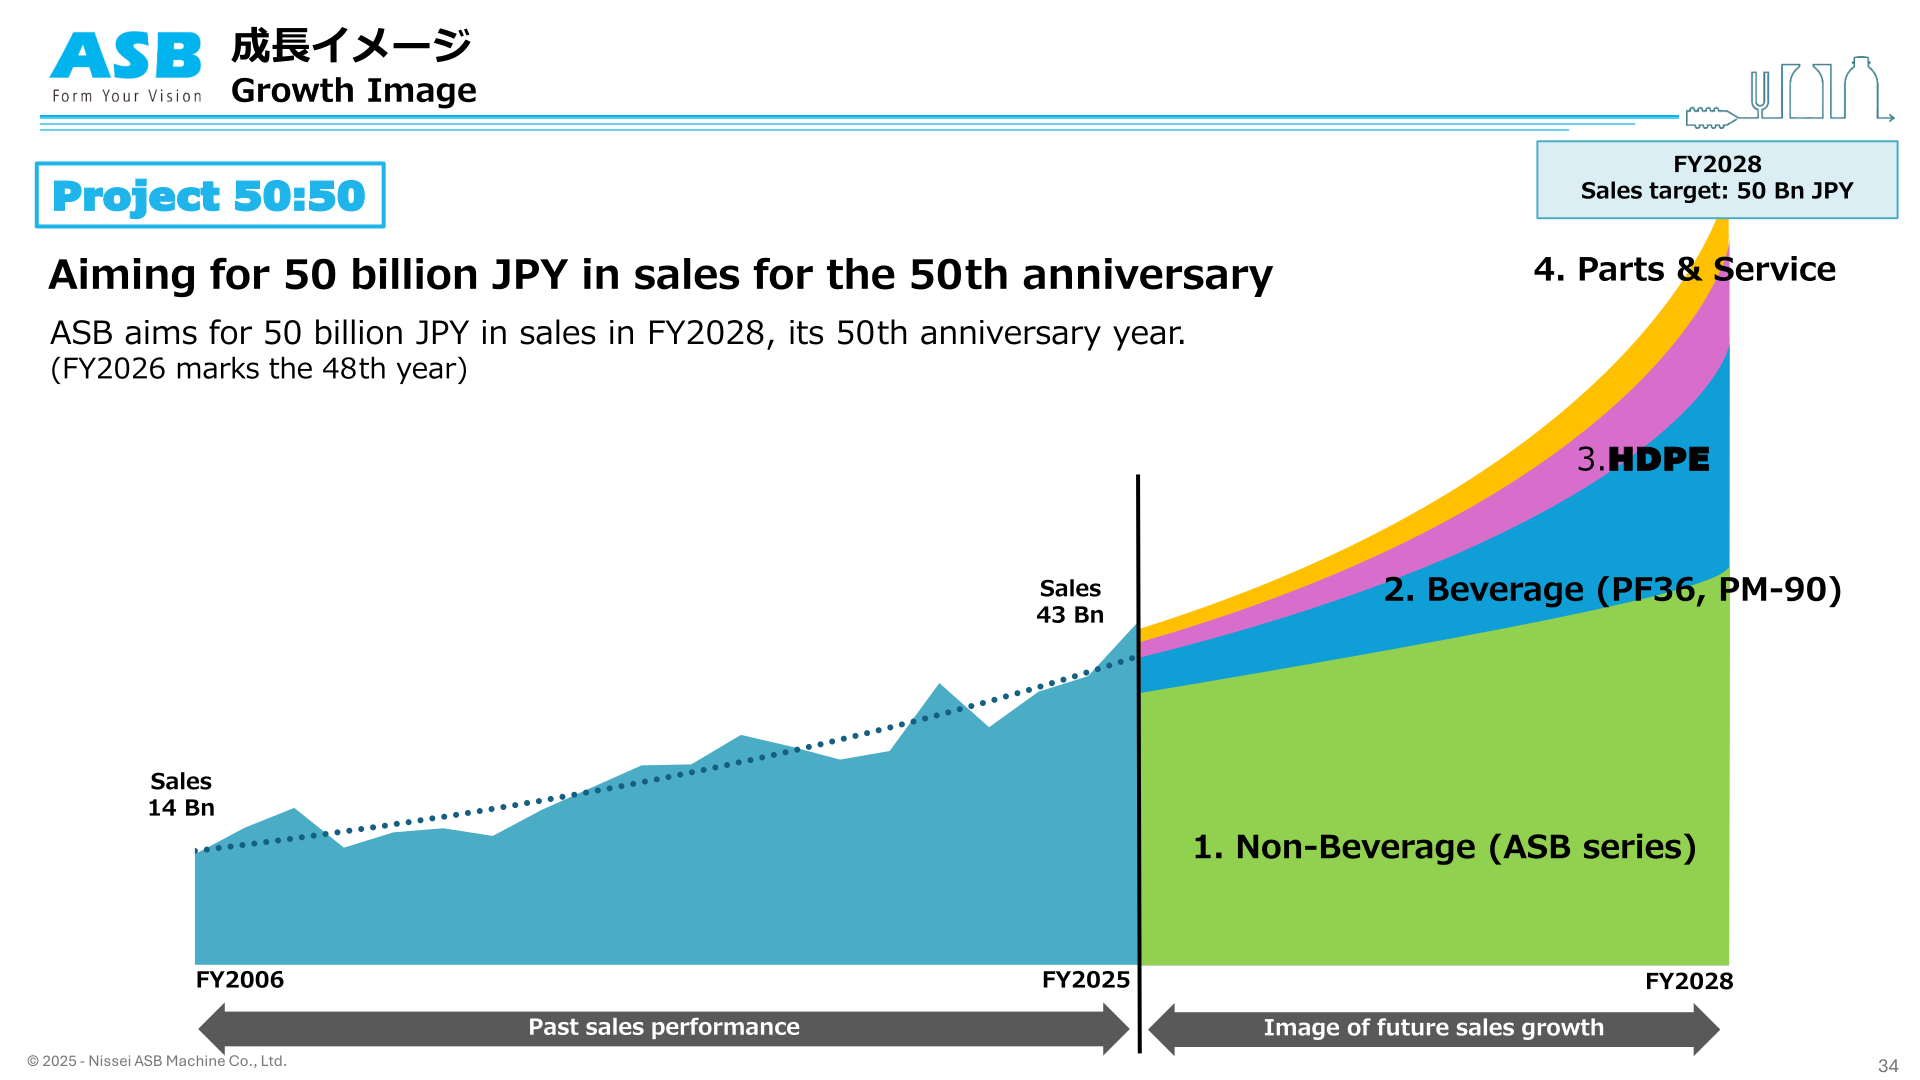
The company aims for 50 billion JPY in sales in FY2028, its 50th anniversary year, under “Project 50:50” (FY2026 marks the 48th year). Four growth strategies are set out: (1) Non-Beverage, achieving stable growth with the ASB Series; (2) Beverage, achieving expanded sales scale with the PF36 and PM-90; (3) New Materials, achieving entry into competitors’ domains through HDPE container development; and (4) Customer Support, enhancing customer satisfaction through the expansion of parts and service. Parts sales were 5,650 million yen in FY2025, and the company aims to grow the Parts and Service business to achieve a sales ratio of 20% in the future.
At K2025 in Dusseldorf, Germany (October 8-15, 2025), the company exhibited four latest models from a booth area of 713 square metres. ASB’s booth received 1,019 people from 90 countries based on scan data, against 458 people from 80 countries at the previous K 2022, while the exhibition overall drew approximately 175,000 visitors from 160 countries. The company reports that the PF36 was successfully promoted as “the ASB for beverage bottles” and that the PM-90 secured numerous inquiries due to its high competitiveness, with sales realization expected in the second half of the fiscal year; PM-90 sales will commence in 2026.
By market, the company describes North America, Europe and India as Strong, Central and South America, the Middle East & Africa and Japan as Steady, Southeast Asia as in Recovery, and China as Weak, where the market slump continues due to economic stagnation and intensifying competition.
This article is an analysis based on publicly available information and is not a recommendation to buy or sell any specific securities. Investment decisions are your own responsibility.
![[Obayashi] Investors’ Guide 2026 — The Complete 24-Article Breakdown](https://japan-equity.com/wp-content/uploads/2026/07/hub_cover-1024x1024.png)
![[Obayashi] IR & SR Policy — Feeding Dialogue Back into Management](https://japan-equity.com/wp-content/uploads/2026/07/p32_sq-1024x1024.jpg)
![[Obayashi] Real Estate Development — 18.7% Margin, ¥287.7bn Unrealized Gains](https://japan-equity.com/wp-content/uploads/2026/07/p20_sq-1024x1024.jpg)
![[Obayashi] Domestic Civil Engineering — Resilience Spending Supports 9.6% Margin](https://japan-equity.com/wp-content/uploads/2026/07/p11_sq-1024x1024.jpg)
![[Obayashi] Share Price & External Ratings — vs TOPIX, ESG Index Inclusion](https://japan-equity.com/wp-content/uploads/2026/07/p40_sq-1024x1024.jpg)
![[Construction] ¥75.5tn Investment, Shrinking Workforce — Big-5 Market Share](https://japan-equity.com/wp-content/uploads/2026/07/p12_sq-1024x1024.jpg)



![[Obayashi] Capital Policy & Shareholder Returns — ROE 10%+, DOE ~5%, ¥100bn Buyback](https://japan-equity.com/wp-content/uploads/2026/07/p27_sq-1024x1024.jpg)
![[Obayashi] Reducing Cross-Shareholdings — ¥285.2bn Sold in Five Years](https://japan-equity.com/wp-content/uploads/2026/07/p29_sq-1024x1024.jpg)
![[Obayashi] ¥750bn Investment Plan — ¥300bn to Development, ¥190bn to Tech/DX](https://japan-equity.com/wp-content/uploads/2026/07/p30_sq-1024x1024.jpg)
![[Obayashi] MTP2022 KPIs — Operating Profit ~2x Target, ROE 14.4%](https://japan-equity.com/wp-content/uploads/2026/07/p25_sq-1024x1024.jpg)
![[Obayashi] Cash Allocation — ¥420bn Investment CF Over Five Years](https://japan-equity.com/wp-content/uploads/2026/07/p26_sq-1024x1024.jpg)
![[Obayashi] Green Energy — 44 Plants, 344MW, and the Green Hydrogen Challenge](https://japan-equity.com/wp-content/uploads/2026/07/p21_sq-1024x1024.jpg)
![[Obayashi] Tackling the Labor Shortage — Robotics Construction®](https://japan-equity.com/wp-content/uploads/2026/07/p14_sq-1024x1024.jpg)
