
This article is based on publicly available IR materials and is not a recommendation to buy or sell any specific securities.
Note: PEGASUS labels the fiscal year covered by these materials as FY3/2026 (Fiscal Year Ending March 31, 2026); this site classifies the most recently completed fiscal year as FY2025, and the labels used in the text, tables and segment data below follow the materials. PEGASUS CO., LTD. reported net sales of 21,657 million yen for FY3/2026, down 382 million yen or 1.7% year on year, with operating profit of 946 million yen (-39.8%) and profit attributable to owners of parent of 323 million yen (-66.5%). Apparel machinery sales were almost flat, while automotive sales declined, and profits fell on higher cost ratios, higher selling, general and administrative expenses and the effects of foreign exchange. The materials were announced on May 13, 2026.
Consolidated Results (Full-Year Actual)
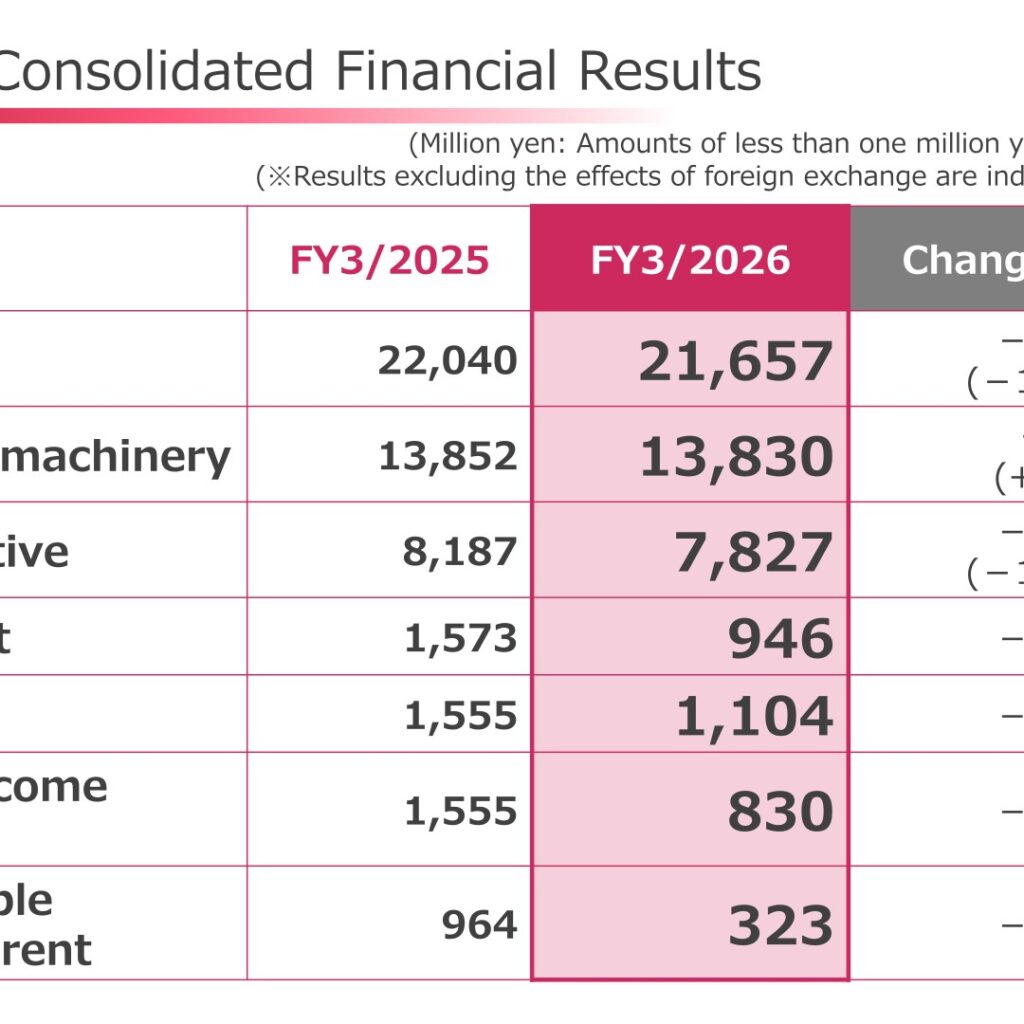
Net sales came to 21,657 million yen, a decrease of 382 million yen (-1.7%) year on year; excluding the effects of foreign exchange the decrease was 156 million yen (-0.7%). By business, apparel machinery sales were 13,830 million yen (-22 million yen, -0.2%; +20 million yen, +0.1% excluding the effects of foreign exchange) and automotive sales were 7,827 million yen (-360 million yen, -4.4%; -176 million yen, -2.2% excluding the effects of foreign exchange). Operating profit was 946 million yen (-626 million yen, -39.8%), ordinary profit 1,104 million yen (-451 million yen, -29.0%), profit before income taxes 830 million yen (-724 million yen, -46.6%) and profit attributable to owners of parent 323 million yen (-641 million yen, -66.5%). Apparel machinery accounted for 63.9% of net sales and automotive for 36.1%.
| Item (million yen) | FY3/2025 | FY3/2026 | Change | Percentage change |
|---|---|---|---|---|
| Net sales | 22,040 | 21,657 | -382 (-156) | -1.7% (-0.7%) |
| Apparel machinery | 13,852 | 13,830 | -22 (+20) | -0.2% (+0.1%) |
| Automotive | 8,187 | 7,827 | -360 (-176) | -4.4% (-2.2%) |
| Operating profit | 1,573 | 946 | -626 | -39.8% |
| Ordinary profit | 1,555 | 1,104 | -451 | -29.0% |
| Profit before income taxes | 1,555 | 830 | -724 | -46.6% |
| Profit attributable to owners of parent | 964 | 323 | -641 | -66.5% |
Amounts of less than one million yen are rounded down. Figures in parentheses are results excluding the effects of foreign exchange.
Segment Results (Net Sales by Business and Location)
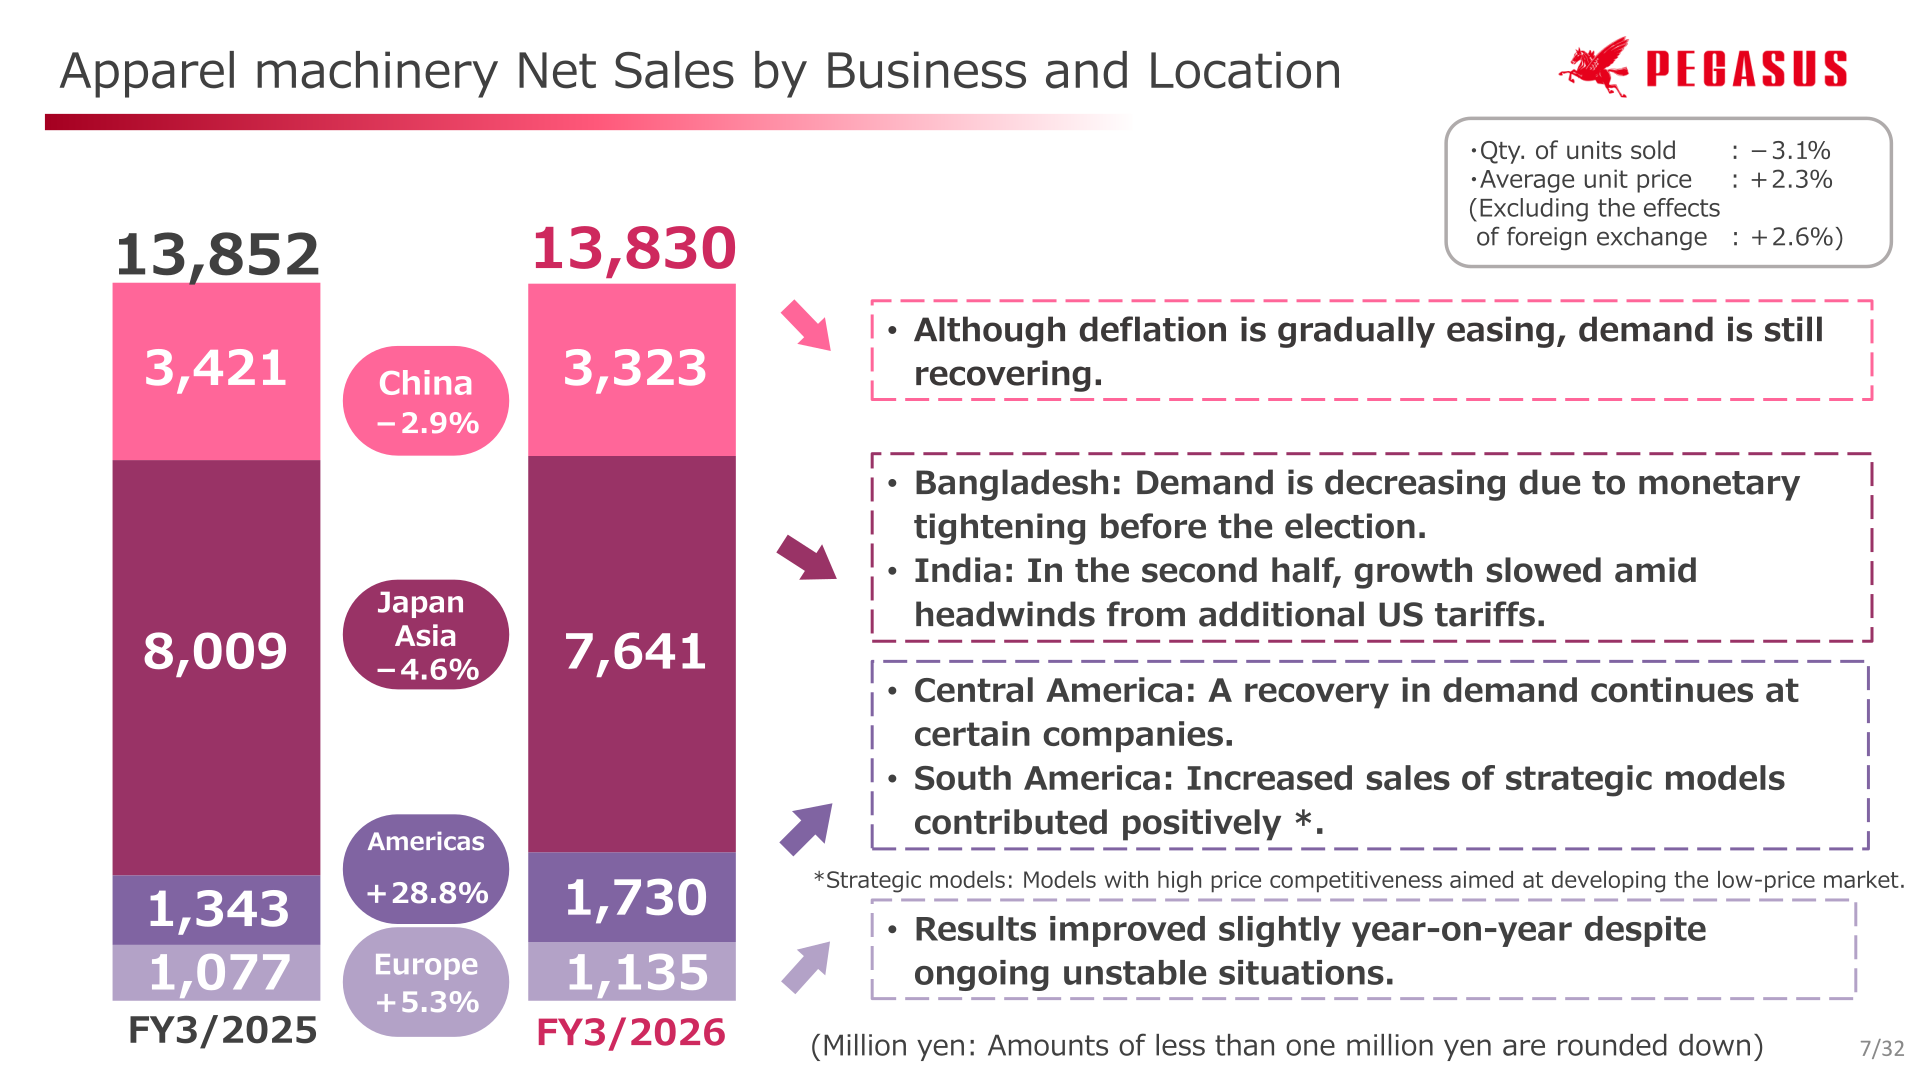
In apparel machinery, the materials note that demand for industrial sewing machines remained steady in Central and South America, that in China deflationary trends showed slight signs of easing but demand is still recovering, and that in Bangladesh monetary tightening associated with the general election, together with the impact of US tariffs on India, continued to make customers cautious about capital investment. Sales of strategic models — models with high price competitiveness aimed at developing the low-price market — reached 982 million yen in FY3/2026, and the number of countries sold to expanded from 15 to 18. In the automotive business, downward pricing pressure continued in China and market momentum weakened against the backdrop of uncertainty surrounding the outlook for the Chinese automotive industry as a whole, while efforts to develop new customers in the Americas were insufficient to offset that weakening. Quantity of units sold for apparel machinery changed -3.1% and the average unit price +2.3% (+2.6% excluding the effects of foreign exchange).
| Business / Location (million yen) | FY3/2026 | FY3/2025 | YoY change (%) | YoY change excluding the effects of foreign exchange (%) |
|---|---|---|---|---|
| Apparel machinery: China | 3,323 | 3,421 | -2.9 | -2.4 |
| Apparel machinery: Japan, Asia | 7,641 | 8,009 | -4.6 | -4.0 |
| Apparel machinery: Americas | 1,730 | 1,343 | +28.8 | +29.7 |
| Apparel machinery: Europe | 1,135 | 1,077 | +5.3 | +2.0 |
| Apparel machinery: Total | 13,830 | 13,852 | -0.2 | +0.1 |
| Automotive: China | 2,590 | 2,966 | -12.7 | -12.3 |
| Automotive: Asia | 2,502 | 2,637 | -5.1 | -4.5 |
| Automotive: Americas | 2,734 | 2,582 | +5.9 | +11.8 |
| Automotive: Total | 7,827 | 8,187 | -4.4 | -2.2 |
Operating Profit Bridge and Financial Position
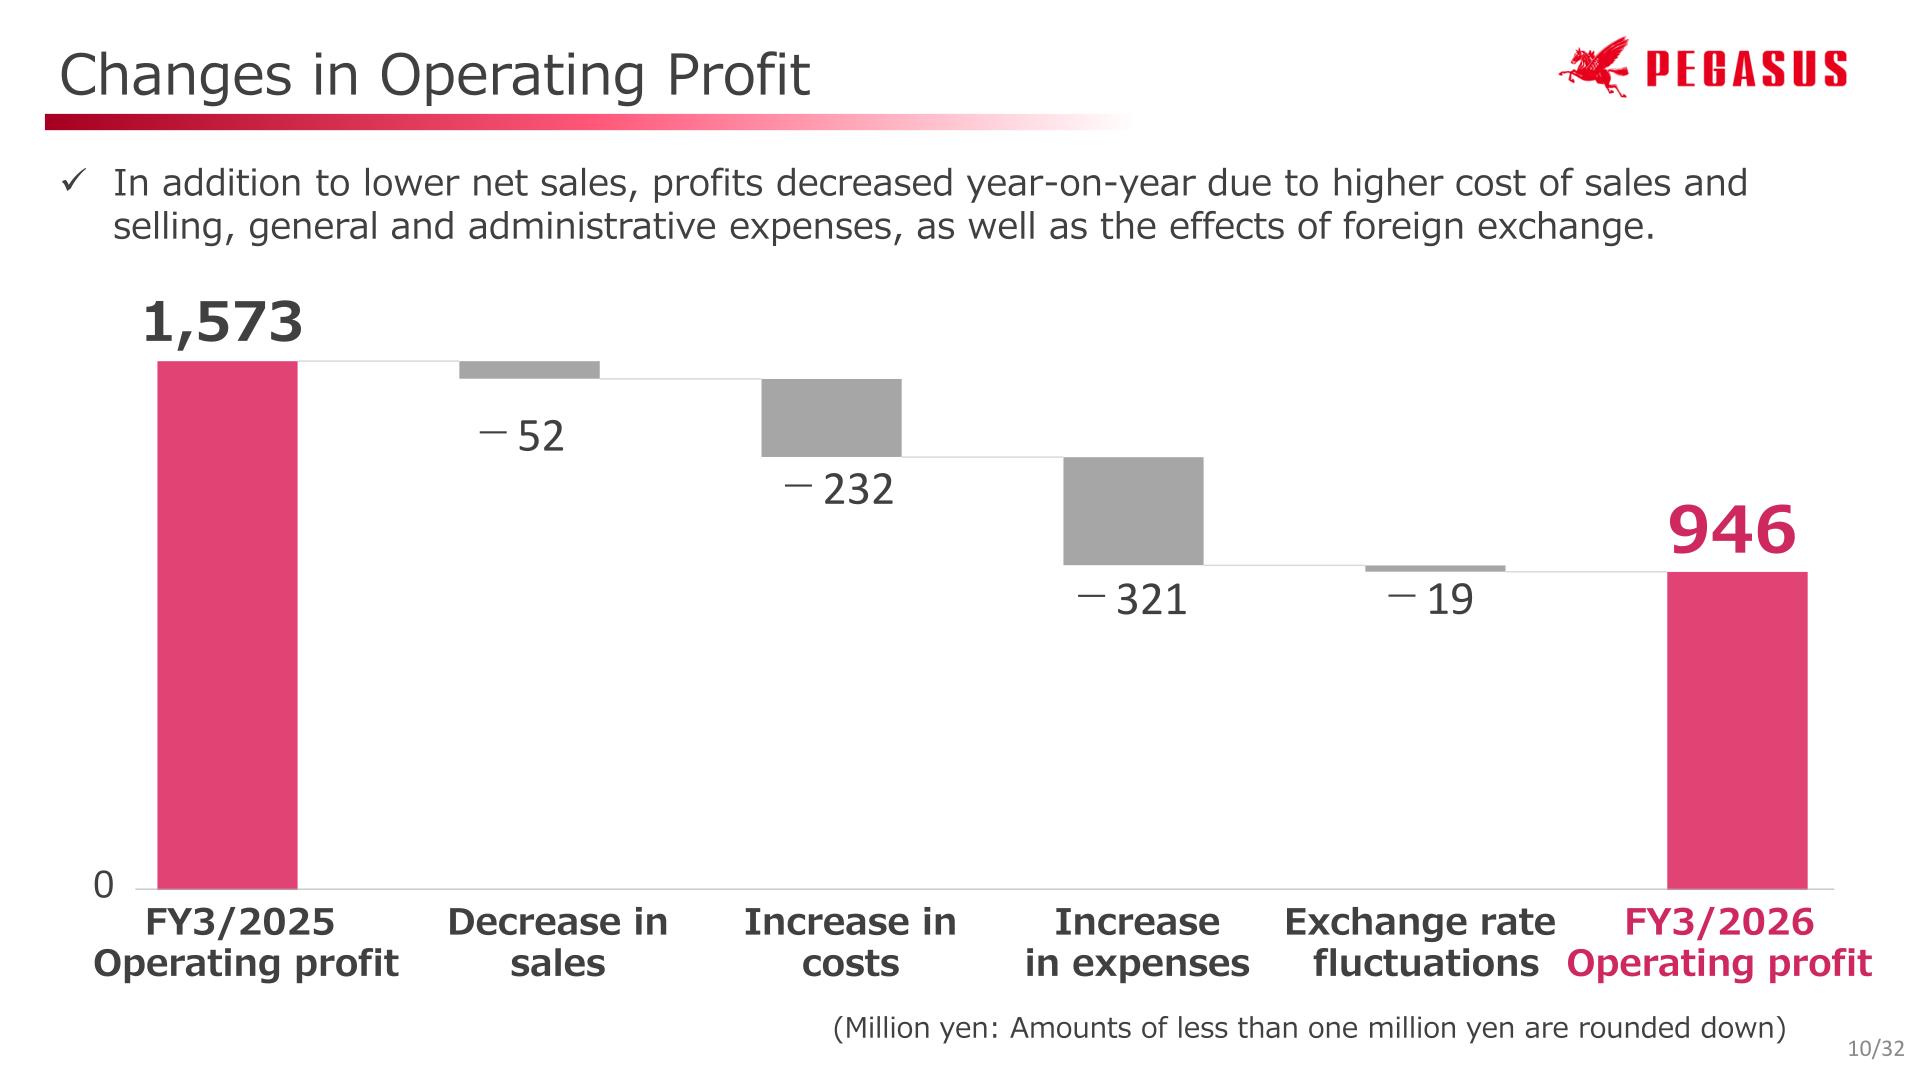
The materials break the year-on-year decline in operating profit, from 1,573 million yen in FY3/2025 to 946 million yen in FY3/2026, into a decrease in sales of -52 million yen, an increase in costs of -232 million yen, an increase in expenses of -321 million yen and exchange rate fluctuations of -19 million yen. Total assets stood at 44,963 million yen at the end of FY3/2026, down 1,427 million yen from the end of the previous year, with current assets of 30,622 million yen (-452 million yen) and non-current assets of 14,341 million yen (-975 million yen). Current liabilities were 6,994 million yen (-780 million yen) and non-current liabilities 4,152 million yen (-827 million yen), while net assets rose 179 million yen to 33,817 million yen, including a foreign currency translation adjustment of 9,153 million yen (+838 million yen). Equity was 32,615 million yen and the capital adequacy ratio 72.5%, versus 32,477 million yen and 70.0% a year earlier. BVPS was 1,362.29 yen, the year-end share price 750 yen and PBR 0.55 times, against 1,309.02 yen, 525 yen and 0.40 times respectively at the end of the previous year; EPS was 13.22 yen versus 38.89 yen. Capital investment was 486 million yen (1,748 million yen in FY3/2025), depreciation 1,222 million yen (1,320 million yen) and R&D expenses 570 million yen (609 million yen).
FY3/2027 Forecast
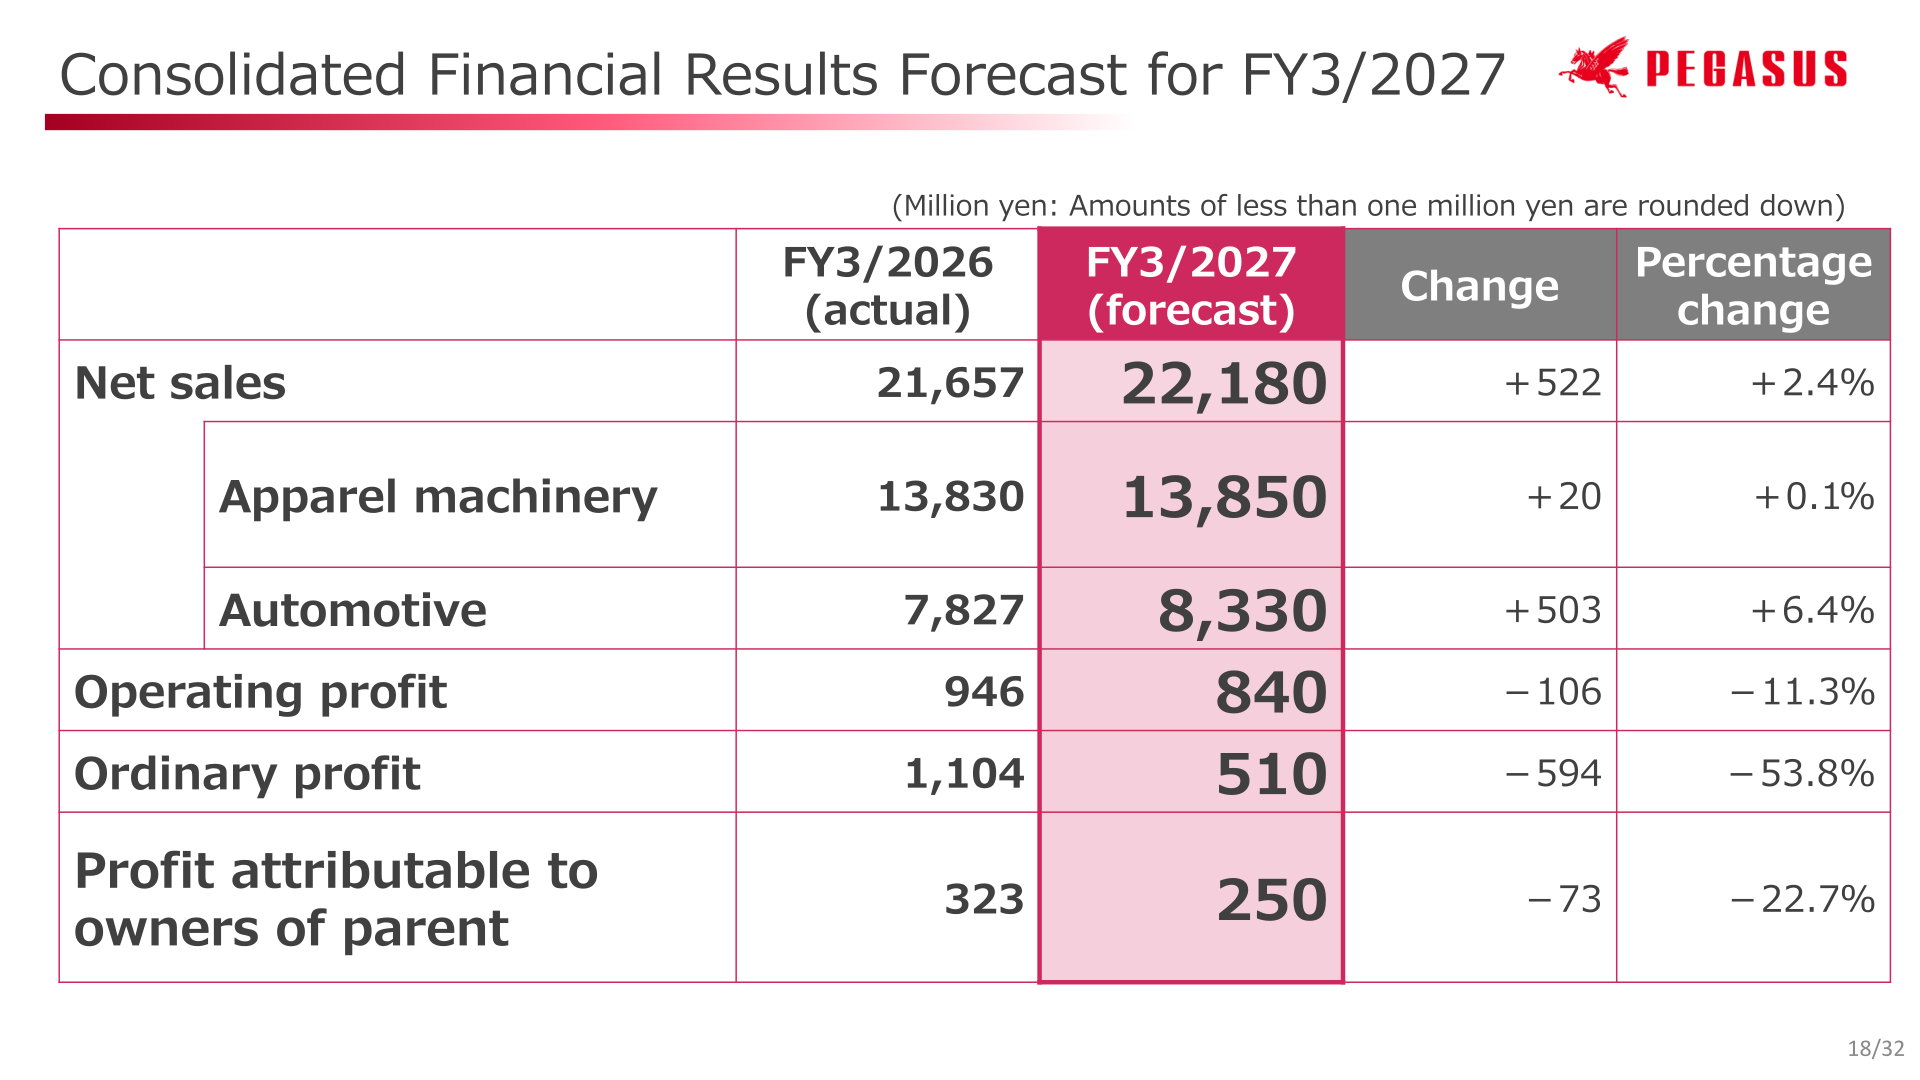
For FY3/2027 the company forecasts net sales of 22,180 million yen (+522 million yen, +2.4%), with apparel machinery at 13,850 million yen (+20 million yen, +0.1%) and automotive at 8,330 million yen (+503 million yen, +6.4%). Operating profit is forecast at 840 million yen (-106 million yen, -11.3%), ordinary profit at 510 million yen (-594 million yen, -53.8%) and profit attributable to owners of parent at 250 million yen (-73 million yen, -22.7%). The assumptions cited include concerns about the impact of the USMCA review scheduled for July 2026, further acquisition of new customers and new components at the company’s base in Mexico, an expected recovery in China driven primarily by domestic demand, a cautious stance toward capital investment in Bangladesh and India as chemical fiber prices rise amid worsening tensions in the Middle East, and expansion of sales networks with price-competitive strategic models in emerging markets such as South America and the Middle East/Africa. On the profit side, the materials state that although net sales are expected to increase, rising cost ratios due to price reductions in China within the automotive business and higher selling, general and administrative expenses associated with workforce expansion are expected to result in decreases in profits including operating profit. Capital investment is planned at 745 million yen, with depreciation of 1,268 million yen and R&D expenses of 595 million yen.
| Item (million yen) | FY3/2026 (actual) | FY3/2027 (forecast) | Change | Percentage change |
|---|---|---|---|---|
| Net sales | 21,657 | 22,180 | +522 | +2.4% |
| Apparel machinery | 13,830 | 13,850 | +20 | +0.1% |
| Automotive | 7,827 | 8,330 | +503 | +6.4% |
| Operating profit | 946 | 840 | -106 | -11.3% |
| Ordinary profit | 1,104 | 510 | -594 | -53.8% |
| Profit attributable to owners of parent | 323 | 250 | -73 | -22.7% |
Shareholder Returns
For FY3/2026 the annual dividend was 30 yen per share (interim 10 yen, year-end 20 yen), up from 13 yen per share (interim 5 yen, year-end 8 yen) in FY3/2025. Against EPS of 13.22 yen, the total payout ratio for FY3/2026 was 479.4%, compared with 33.4% in FY3/2025 on EPS of 38.89 yen. For FY3/2027 the company forecasts an interim dividend of 15 yen per share and EPS of 10.44 yen; the year-end dividend, the annual dividend and the total payout ratio are shown as “—” in the materials.
| Interim | Year-end | Annual | EPS | Total payout ratio | |
|---|---|---|---|---|---|
| FY3/2025 | 5yen | 8yen | 13yen | 38.89yen | 33.4% |
| FY3/2026 | 10yen | 20yen | 30yen | 13.22yen | 479.4% |
| FY3/2027 (forecast) | 15yen | — | — | 10.44yen | —% |
Basic Policies of the New Mid-Term Management Plan
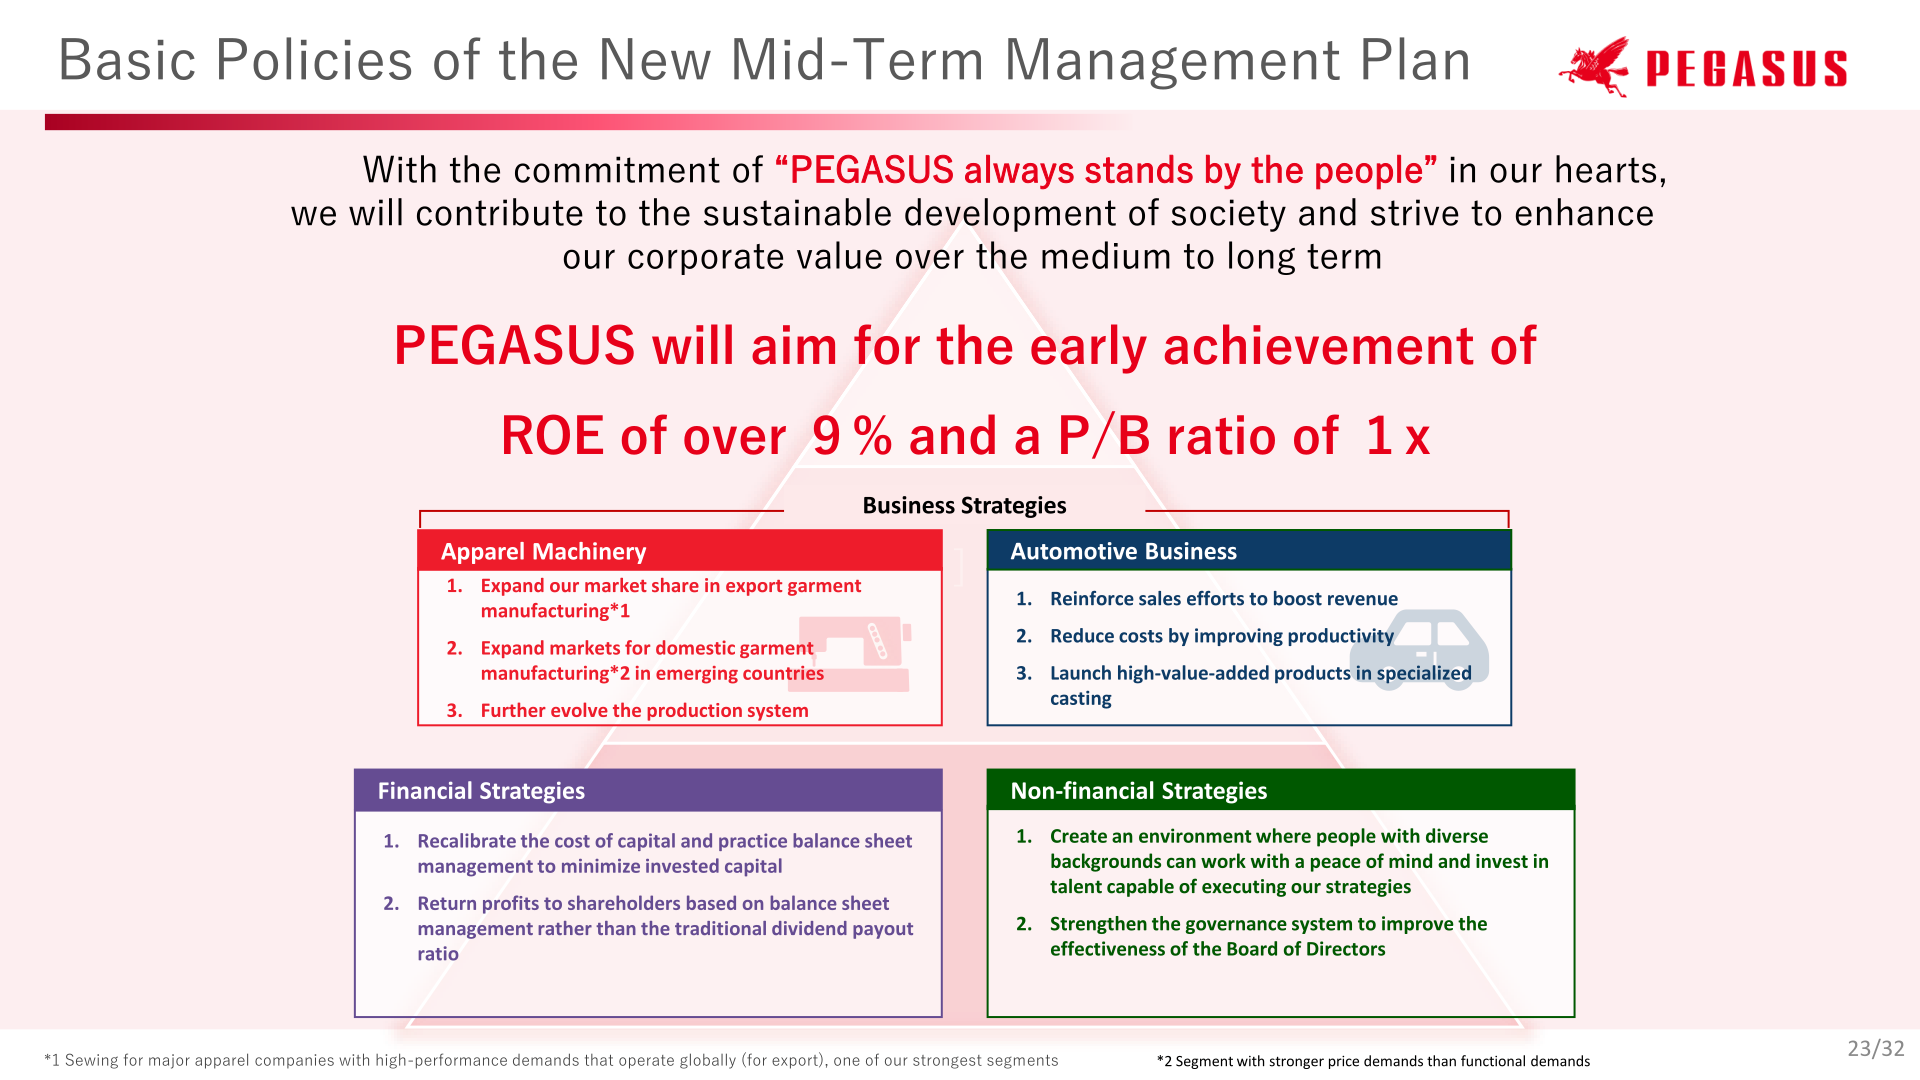
The materials set out the basic policies of the new mid-term management plan, under which PEGASUS states that, with the commitment of “PEGASUS always stands by the people” in its hearts, it will contribute to the sustainable development of society and strive to enhance corporate value over the medium to long term, aiming for the early achievement of ROE of over 9% and a P/B ratio of 1x. In apparel machinery the strategies are to expand market share in export garment manufacturing, expand markets for domestic garment manufacturing in emerging countries, and further evolve the production system; in the automotive business, to reinforce sales efforts to boost revenue, reduce costs by improving productivity, and launch high-value-added products in specialized casting. The financial strategies are to recalibrate the cost of capital and practice balance sheet management to minimize invested capital, and to return profits to shareholders based on balance sheet management rather than the traditional dividend payout ratio. The non-financial strategies are to create an environment where people with diverse backgrounds can work with peace of mind and invest in talent capable of executing the strategies, and to strengthen the governance system to improve the effectiveness of the Board of Directors.
This article is an analysis based on publicly available information and is not a recommendation to buy or sell any specific securities. Investment decisions are your own responsibility.
![[Obayashi] Investors’ Guide 2026 — The Complete 24-Article Breakdown](https://japan-equity.com/wp-content/uploads/2026/07/hub_cover-1024x1024.png)
![[Obayashi] IR & SR Policy — Feeding Dialogue Back into Management](https://japan-equity.com/wp-content/uploads/2026/07/p32_sq-1024x1024.jpg)
![[Obayashi] Real Estate Development — 18.7% Margin, ¥287.7bn Unrealized Gains](https://japan-equity.com/wp-content/uploads/2026/07/p20_sq-1024x1024.jpg)
![[Obayashi] Domestic Civil Engineering — Resilience Spending Supports 9.6% Margin](https://japan-equity.com/wp-content/uploads/2026/07/p11_sq-1024x1024.jpg)
![[Obayashi] Share Price & External Ratings — vs TOPIX, ESG Index Inclusion](https://japan-equity.com/wp-content/uploads/2026/07/p40_sq-1024x1024.jpg)
![[Construction] ¥75.5tn Investment, Shrinking Workforce — Big-5 Market Share](https://japan-equity.com/wp-content/uploads/2026/07/p12_sq-1024x1024.jpg)



![[Obayashi] Capital Policy & Shareholder Returns — ROE 10%+, DOE ~5%, ¥100bn Buyback](https://japan-equity.com/wp-content/uploads/2026/07/p27_sq-1024x1024.jpg)
![[Obayashi] Reducing Cross-Shareholdings — ¥285.2bn Sold in Five Years](https://japan-equity.com/wp-content/uploads/2026/07/p29_sq-1024x1024.jpg)
![[Obayashi] ¥750bn Investment Plan — ¥300bn to Development, ¥190bn to Tech/DX](https://japan-equity.com/wp-content/uploads/2026/07/p30_sq-1024x1024.jpg)
![[Obayashi] MTP2022 KPIs — Operating Profit ~2x Target, ROE 14.4%](https://japan-equity.com/wp-content/uploads/2026/07/p25_sq-1024x1024.jpg)
![[Obayashi] Cash Allocation — ¥420bn Investment CF Over Five Years](https://japan-equity.com/wp-content/uploads/2026/07/p26_sq-1024x1024.jpg)
![[Obayashi] Green Energy — 44 Plants, 344MW, and the Green Hydrogen Challenge](https://japan-equity.com/wp-content/uploads/2026/07/p21_sq-1024x1024.jpg)
![[Obayashi] Tackling the Labor Shortage — Robotics Construction®](https://japan-equity.com/wp-content/uploads/2026/07/p14_sq-1024x1024.jpg)
