
This article is based on publicly available IR materials and is not a recommendation to buy or sell any specific securities.
Note: The company’s results briefing labels the fiscal year ended March 31, 2026 as “FY2026” and the following year as “FY2027”; japan-equity.com classifies the most recently completed fiscal year as FY2025 in the title and URL, while all figures, tables and year labels below follow the materials as reported. The deck is dated May 22, 2026 and states on its cover that it was “Revised on June 16, 2026”; the revised version is the source used here.
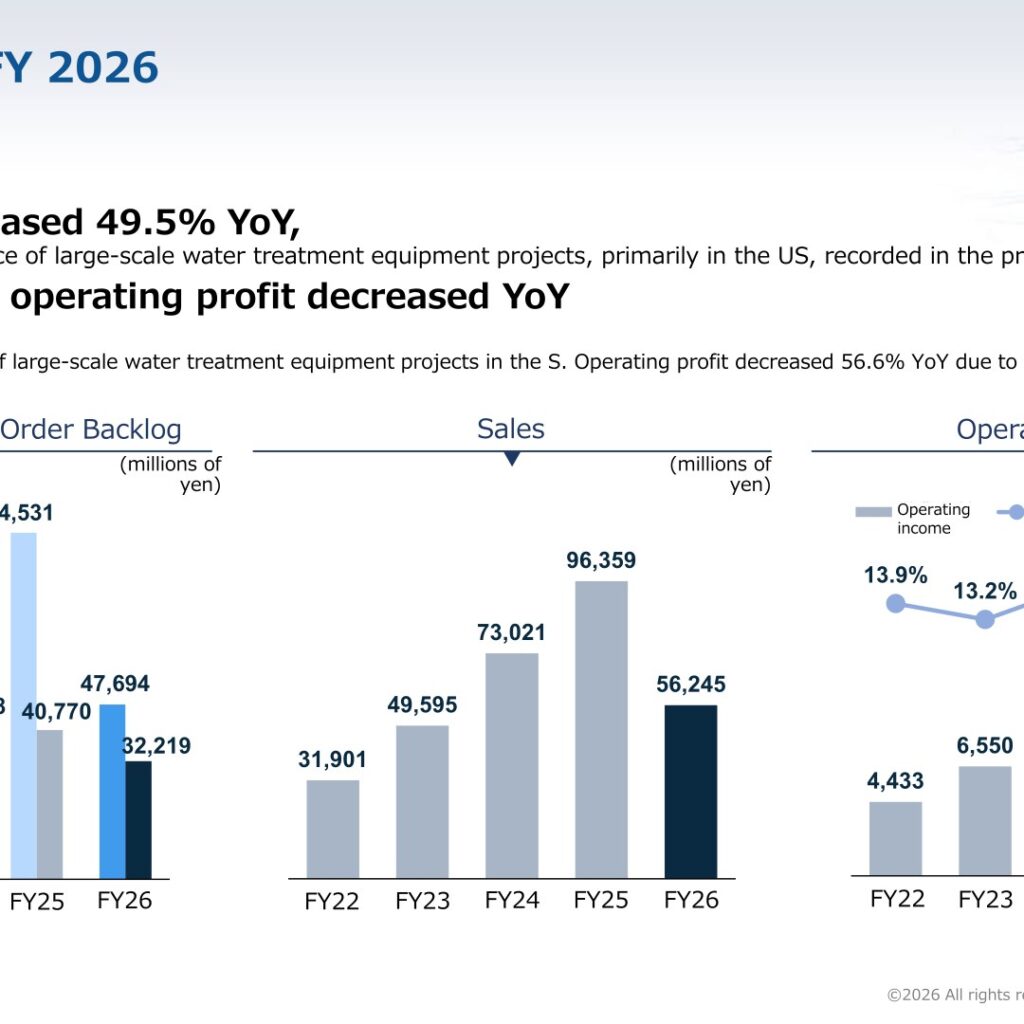
Nomura Micro Science reported sharply lower results for FY2026, with net sales of 56,245 million yen, down 41.6% year on year, and operating income of 6,667 million yen, down 56.6%. The company attributes the decline to the completion of large-scale water treatment equipment projects in the US that had driven the previous year, together with an increase in selling, general and administrative expenses. Net sales fell short of the initial plan of 60,000 million yen because of delays in the start of certain construction projects, but operating income and ordinary income exceeded plan, supported by cost reductions achieved through reforms to the engineering process. For FY2027 the company forecasts net sales of 97,000 million yen and operating income of 16,000 million yen, and expects both order intake and order backlog to reach record-high levels.
Consolidated Results (Full-Year Actual)
The presentation shows a decline across every profit line. Gross profit margin nevertheless improved to 22.6% from 21.9%, and came in above the initial plan of 20.1%. Achievement rates against the initial plan were 93.7% for sales, 107.5% for operating income, 108.6% for ordinary income and 99.5% for profit attributable to owners of parent.
| Item (millions of yen) | FY25 Results | FY26 Results | Amount of increase/decrease | Rate of increase/decrease | FY26 Initial plan | Achievement rate |
|---|---|---|---|---|---|---|
| Sales | 96,359 | 56,245 | -40,114 | -41.6% | 60,000 | 93.7% |
| Gross profit | 21,110 | 12,707 | -8,403 | -39.8% | 12,065 | 105.3% |
| Gross profit margin | 21.9% | 22.6% | – | – | 20.1% | – |
| Operating income | 15,372 | 6,667 | -8,704 | -56.6% | 6,200 | 107.5% |
| Operating income ratio | 16.0% | 11.9% | – | – | 10.3% | – |
| Ordinary income | 13,399 | 5,629 | -7,770 | -58.0% | 5,184 | 108.6% |
| Ordinary income ratio | 13.9% | 10.0% | – | – | 8.6% | – |
| Profit attributable to owners of parent | 10,199 | 3,818 | -6,381 | -62.6% | 3,837 | 99.5% |
| Current income ratio | 10.6% | 6.8% | – | – | 6.4% | – |
The balance sheet shows total assets of 110,290 million yen at the end of FY26, down 6,492 million yen, with contract assets rising to 77,360 million yen while cash and deposits fell to 10,425 million yen. Net assets increased by 2,838 million yen to 39,852 million yen. Cash flow from business activities turned positive at 4,363 million yen against -20,202 million yen a year earlier, and free cash flow was 3,213 million yen versus -22,944 million yen.
Segment and Regional Breakdown
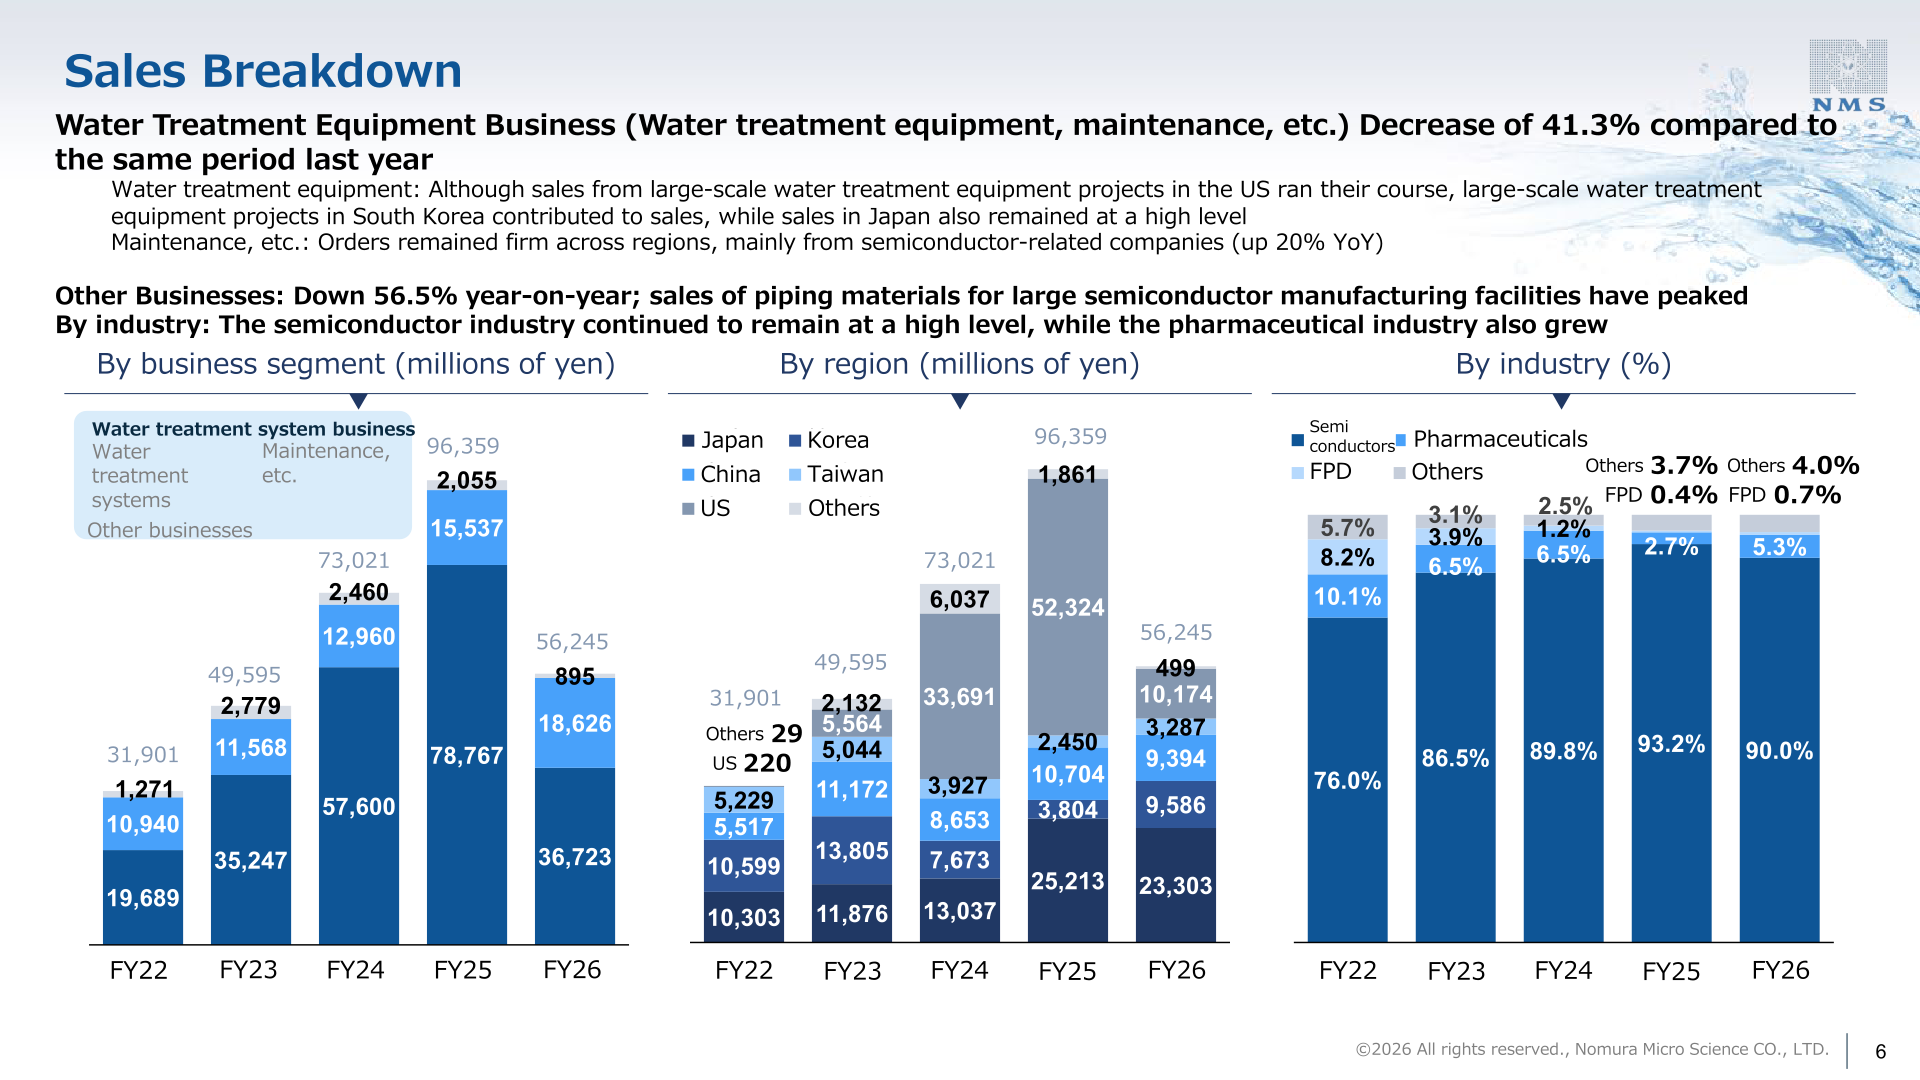
Within the water treatment system business, sales of water treatment systems fell to 36,723 million yen while maintenance and related sales rose to 18,626 million yen; the presentation notes that maintenance orders remained firm across regions, mainly from semiconductor-related companies, up 20% year on year. The water treatment equipment business as a whole decreased 41.3% year on year and other businesses decreased 56.5%, as sales of piping materials for large semiconductor manufacturing facilities have peaked. By region, US sales dropped to 10,174 million yen from 52,324 million yen, while Korea rose to 9,586 million yen as new large-scale projects progressed. By industry, semiconductors accounted for 90.0% of sales, pharmaceuticals 5.3%, FPD 0.7% and others 4.0%.
| Breakdown of sales (millions of yen) | FY26 | FY25 |
|---|---|---|
| Water treatment systems | 36,723 | 78,767 |
| Maintenance, etc. | 18,626 | 15,537 |
| Other businesses | 895 | 2,055 |
| Japan | 23,303 | 25,213 |
| Korea | 9,586 | 3,804 |
| China | 9,394 | 10,704 |
| Taiwan | 3,287 | 2,450 |
| US | 10,174 | 52,324 |
| Others | 499 | 1,861 |
| Total | 56,245 | 96,359 |
Orders Received and Order Backlog
Orders received and order backlog are reported separately from net sales. Order intake fell 49.5% year on year to 47,694 million yen, mainly due to the absence of the large-scale water treatment equipment projects, primarily in the US, that were recorded in the previous fiscal year, and reached only 40.7% of the initial plan of 117,229 million yen. Order backlog at the end of the term stood at 32,219 million yen, down 21.0%. By region, Taiwan received orders for new large-scale water treatment equipment projects during the year.
| Orders received by region (millions of yen) | FY26 | FY25 |
|---|---|---|
| Japan | 12,693 | 15,273 |
| Korea | 4,205 | 9,721 |
| China | 11,394 | 7,468 |
| Taiwan | 10,474 | 1,802 |
| US | 5,254 | 53,478 |
| Others | 3,671 | 6,786 |
| Total | 47,694 | 94,531 |
FY2027 Forecast
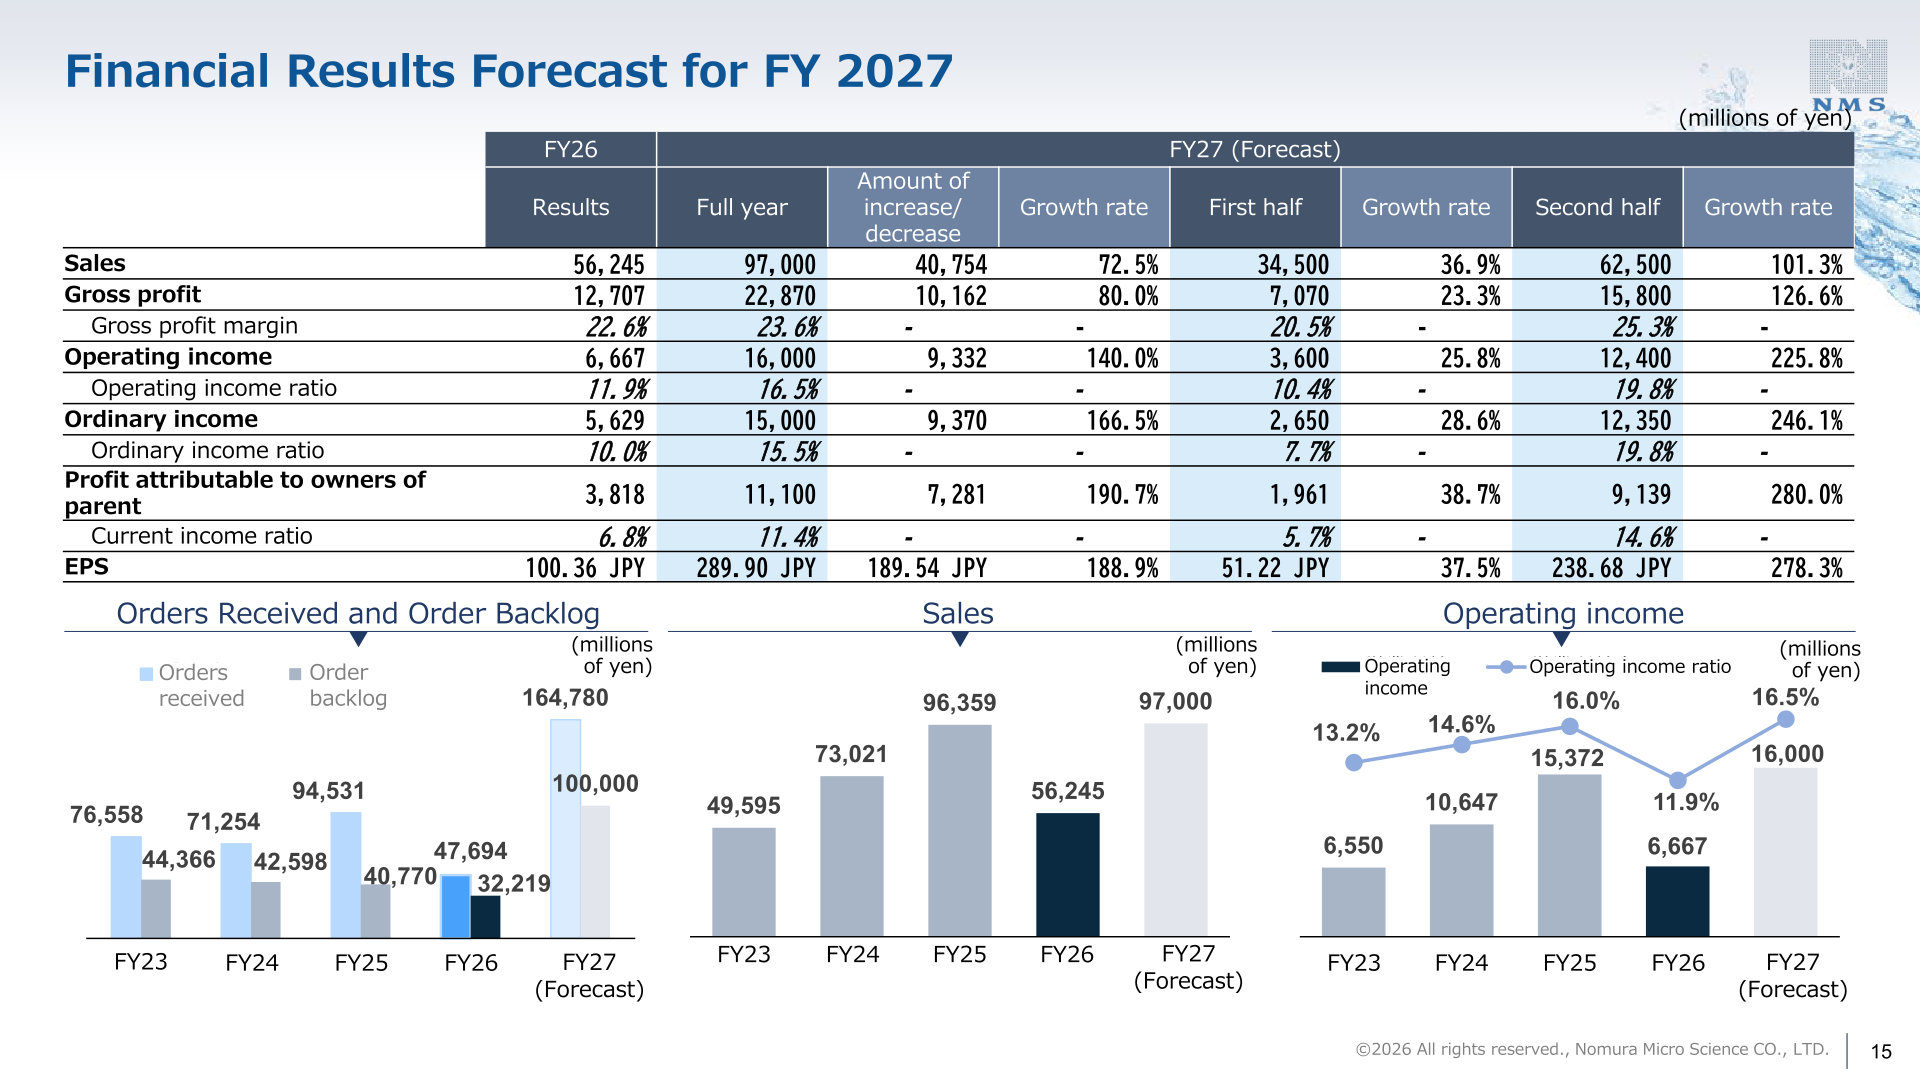
The company guides for a strong rebound, with net sales of 97,000 million yen (up 72.5%) and operating income of 16,000 million yen (up 140.0%), lifting the operating income ratio to 16.5%. The recovery is weighted to the second half, where sales are forecast at 62,500 million yen (up 101.3%) against 34,500 million yen in the first half. Orders received are forecast at 164,780 million yen and order backlog at 100,000 million yen, which the presentation describes as record-high levels, on the back of strong and increasingly large-scale semiconductor-related capital investment. Sales by region are forecast at 42,490 million yen for the US, 18,935 million yen for Japan, 13,506 million yen for China, 11,410 million yen for Korea, 7,504 million yen for Taiwan and 3,151 million yen for others.
| Item (millions of yen) | FY26 Results | FY27 Full-year forecast | Amount of increase/decrease | Growth rate |
|---|---|---|---|---|
| Sales | 56,245 | 97,000 | 40,754 | 72.5% |
| Gross profit | 12,707 | 22,870 | 10,162 | 80.0% |
| Gross profit margin | 22.6% | 23.6% | – | – |
| Operating income | 6,667 | 16,000 | 9,332 | 140.0% |
| Operating income ratio | 11.9% | 16.5% | – | – |
| Ordinary income | 5,629 | 15,000 | 9,370 | 166.5% |
| Profit attributable to owners of parent | 3,818 | 11,100 | 7,281 | 190.7% |
| EPS | 100.36 JPY | 289.90 JPY | 189.54 JPY | 188.9% |
| Orders received | 47,694 | 164,780 | – | – |
| Order backlog at end of term | 32,219 | 100,000 | – | – |
On the demand backdrop, the presentation notes that demand for generative AI and data centers is expanding rapidly for both logic semiconductors such as GPUs and memory semiconductors including HBM and NAND for SSDs, and is expected to remain at a high level from 2026 onward. In pharmaceuticals, investment in regenerative medicine, biopharmaceuticals and CDMO expansion continues, supported by Japanese government subsidies for strengthening pharmaceutical-related supply chains.
Shareholder Returns
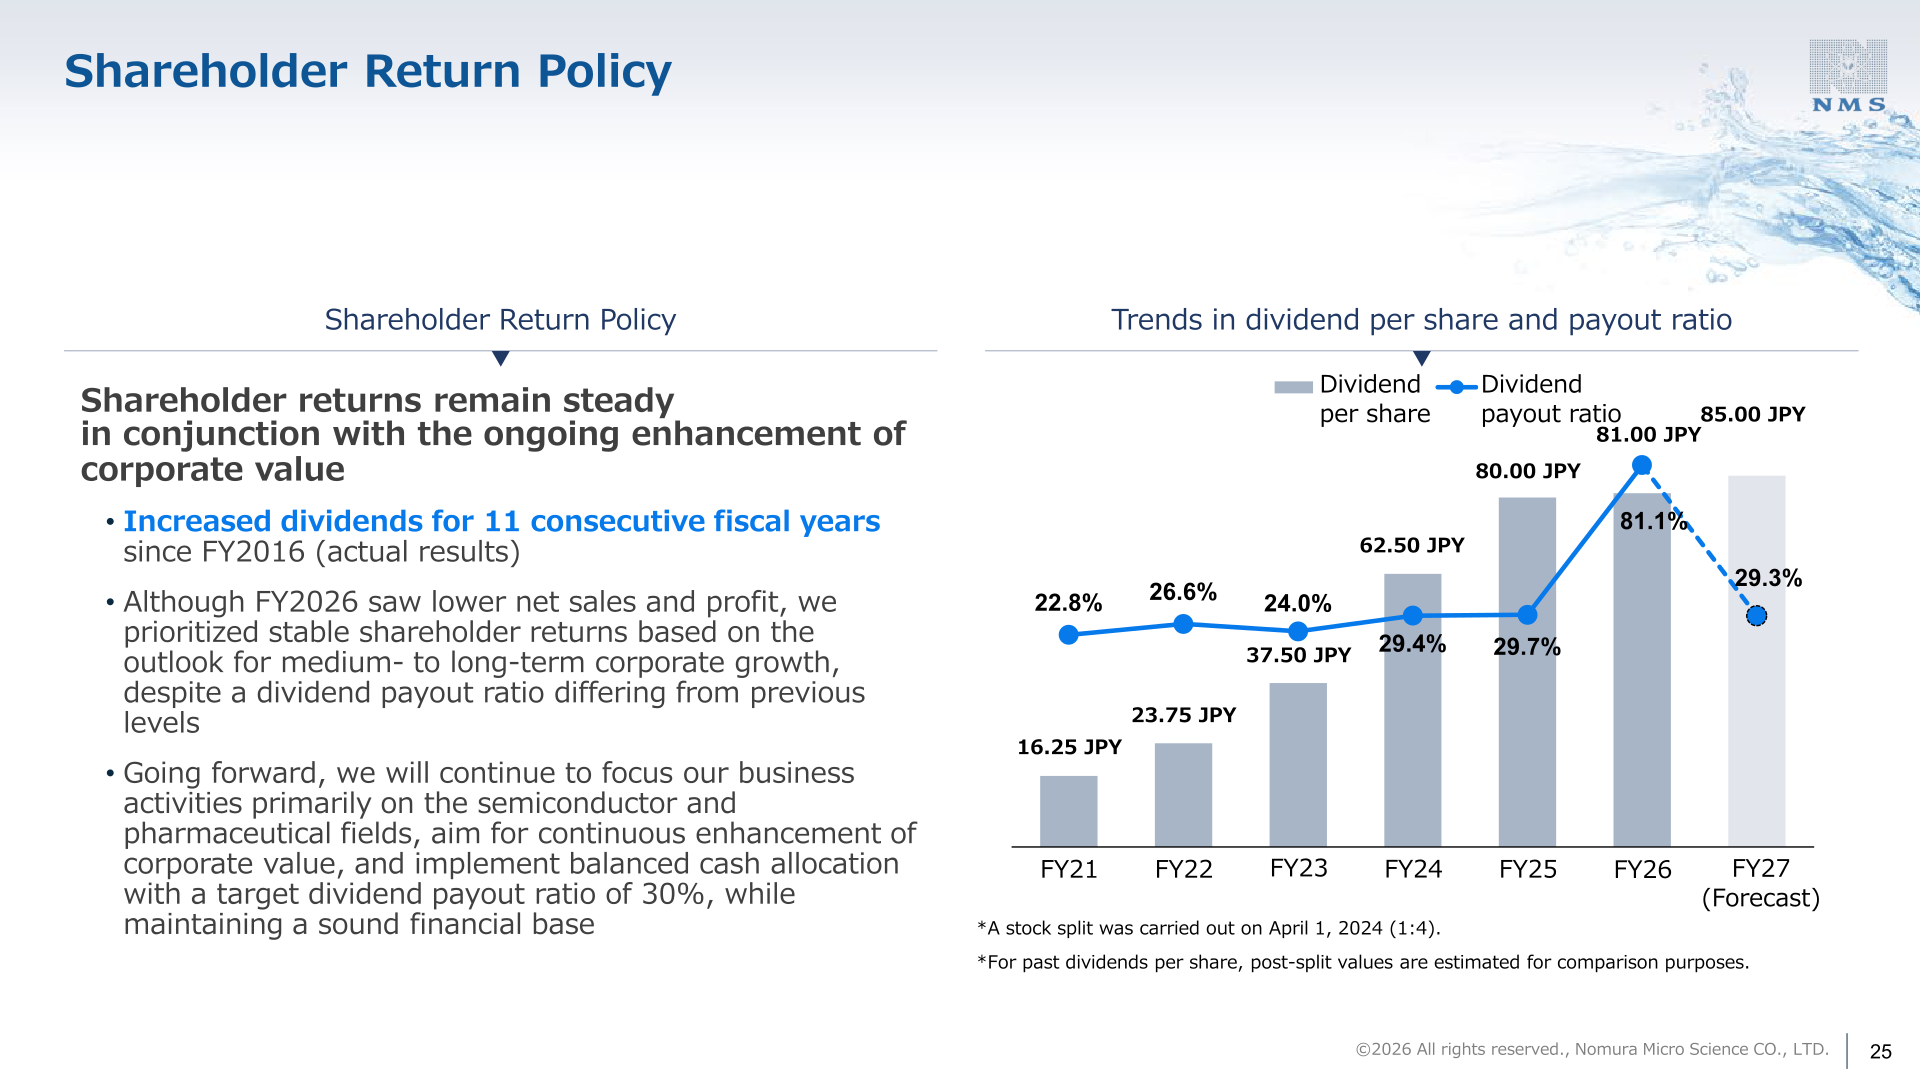
The dividend per share for FY26 was 81.00 JPY, up from 80.00 JPY in FY25; the presentation states that the company has increased dividends for 11 consecutive fiscal years since FY2016 on an actual-results basis. The payout ratio rose to 81.1% because net sales and profit declined. The company states that it prioritized stable shareholder returns based on the outlook for medium- to long-term corporate growth despite a payout ratio differing from previous levels. For FY27 it forecasts a dividend of 85.00 JPY with a payout ratio of 29.3%, and going forward it targets a dividend payout ratio of 30% with balanced cash allocation while maintaining a sound financial base. A 1:4 stock split was carried out on April 1, 2024, and past dividends per share are shown on a post-split basis for comparison.
| Item | FY24 | FY25 | FY26 | FY27 (Forecast) |
|---|---|---|---|---|
| Dividend per share | 62.50 JPY | 80.00 JPY | 81.00 JPY | 85.00 JPY |
| Dividend payout ratio | 29.4% | 29.7% | 81.1% | 29.3% |
Medium-Term Management Plan TTT-26
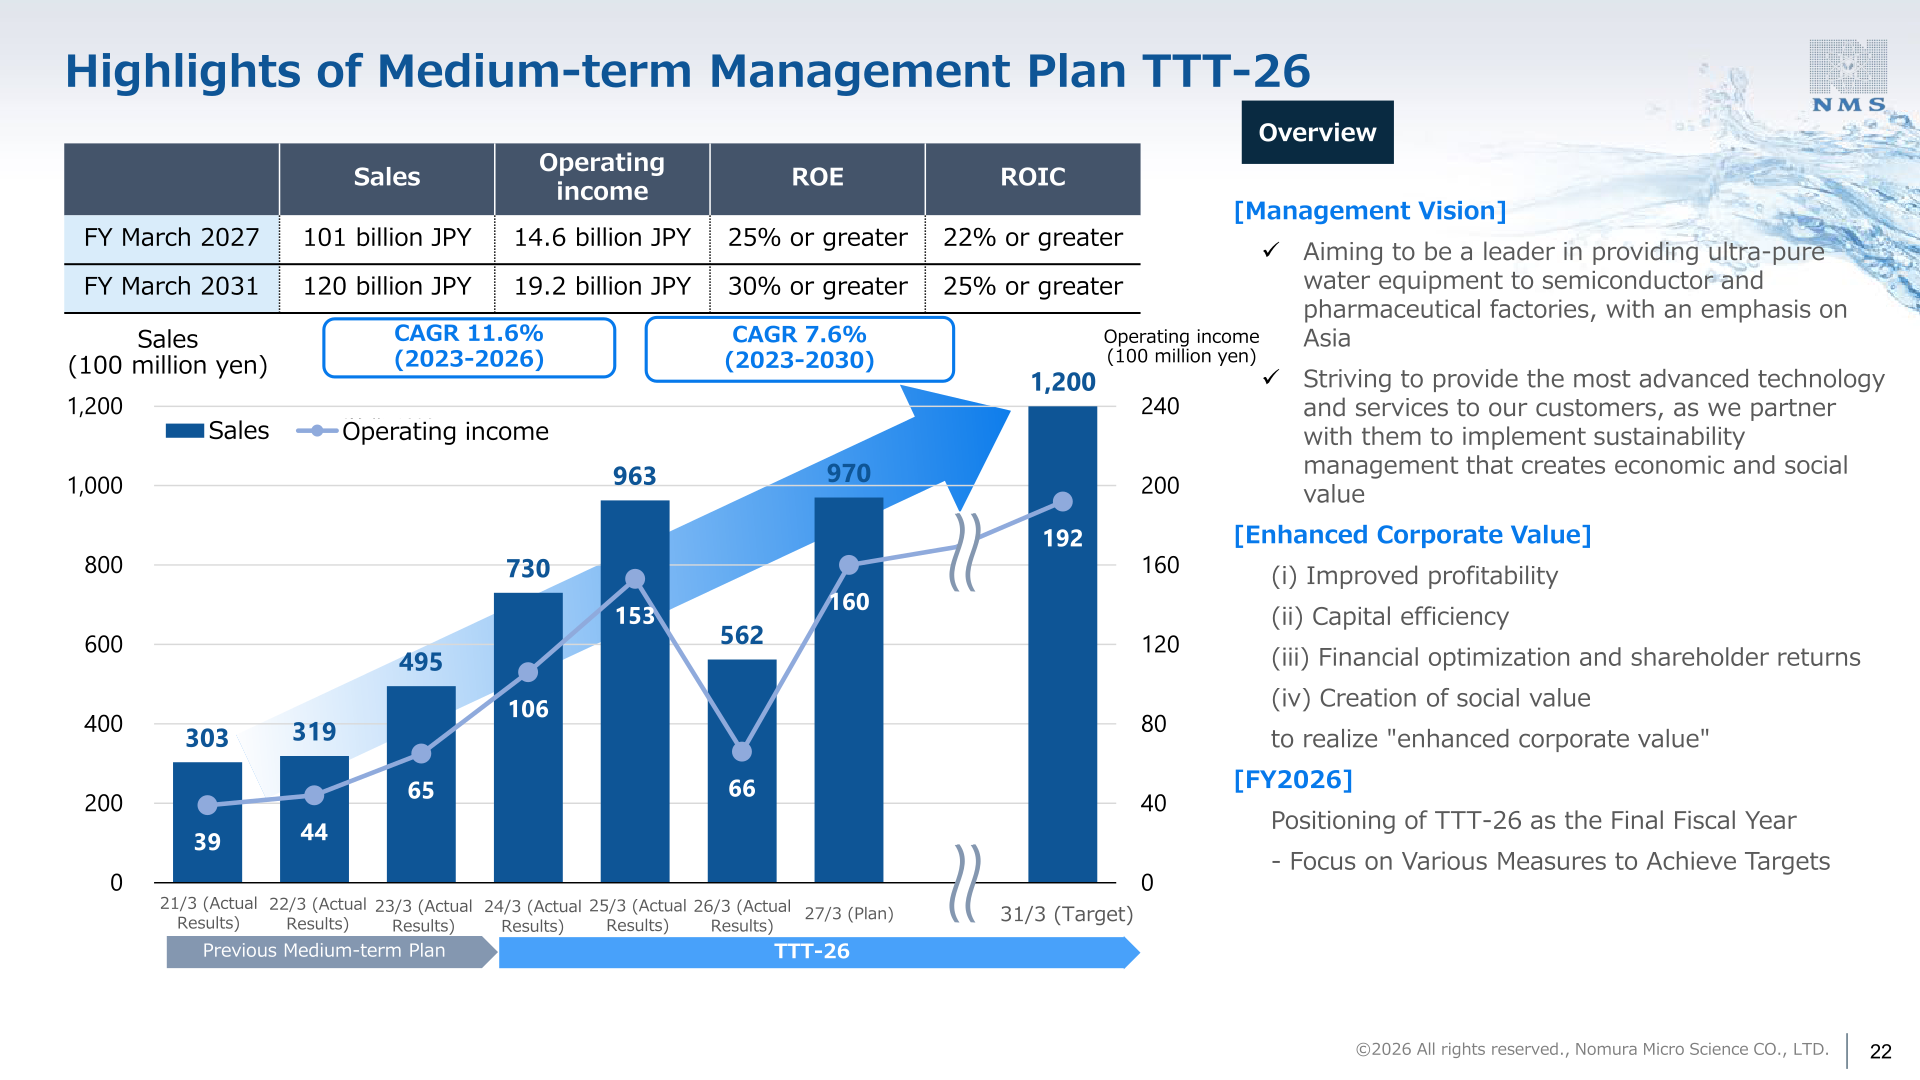
FY2026 is positioned as the final fiscal year of the medium-term management plan TTT-26 (Together Toward Transformation-26). The plan targets sales of 101 billion JPY and operating income of 14.6 billion JPY with ROE of 25% or greater and ROIC of 22% or greater for FY March 2027, and sales of 120 billion JPY and operating income of 19.2 billion JPY with ROE of 30% or greater and ROIC of 25% or greater for FY March 2031. On capital efficiency, the company puts its estimated cost of equity based on CAPM at around 13-15%; ROE declined to 10.1% in FY2026 on the significant decrease in net sales, although the five-year historical average exceeds 25%, and earnings levels are expected to recover in FY2027. PBR increased from 2.49x to 2.95x, remaining above 1x since FY2021.
| Medium-term targets | Sales | Operating income | ROE | ROIC |
|---|---|---|---|---|
| FY March 2027 | 101 billion JPY | 14.6 billion JPY | 25% or greater | 22% or greater |
| FY March 2031 | 120 billion JPY | 19.2 billion JPY | 30% or greater | 25% or greater |
On progress, the company reports that local subsidiary operations began in Singapore, that it is strengthening initiatives for semiconductor-related projects in India and Southeast Asia beyond TATA, and that it is pursuing pharmaceutical-related projects in South Korea and the US. In engineering process reform it introduced actual prefabrication construction equipment at project sites, achieving cost reductions and shorter delivery times. In R&D it established what it describes as the world’s first 5 nm particle measurement technology for trace analysis, began customer evaluation of endotoxin monitors, and constructed a new development building for ultrapure water production systems for cutting-edge semiconductors. Capital investment was 1,419 million yen in FY26 against depreciation of 1,692 million yen, and R&D expenses were 493 million yen, forecast to rise to 750 million yen in FY27 as depreciation on the new development building is planned to be recorded as R&D expenses.
This article is an analysis based on publicly available information and is not a recommendation to buy or sell any specific securities. Investment decisions are your own responsibility.
![[Obayashi] Investors’ Guide 2026 — The Complete 24-Article Breakdown](https://japan-equity.com/wp-content/uploads/2026/07/hub_cover-1024x1024.png)
![[Obayashi] IR & SR Policy — Feeding Dialogue Back into Management](https://japan-equity.com/wp-content/uploads/2026/07/p32_sq-1024x1024.jpg)
![[Obayashi] Domestic Civil Engineering — Resilience Spending Supports 9.6% Margin](https://japan-equity.com/wp-content/uploads/2026/07/p11_sq-1024x1024.jpg)
![[Obayashi] Overseas Construction — Orders Reach ¥1.2tn](https://japan-equity.com/wp-content/uploads/2026/07/p15_sq-1024x1024.jpg)
![[Obayashi] Share Price & External Ratings — vs TOPIX, ESG Index Inclusion](https://japan-equity.com/wp-content/uploads/2026/07/p40_sq-1024x1024.jpg)
![[Construction] ¥75.5tn Investment, Shrinking Workforce — Big-5 Market Share](https://japan-equity.com/wp-content/uploads/2026/07/p12_sq-1024x1024.jpg)



![[Obayashi] Capital Policy & Shareholder Returns — ROE 10%+, DOE ~5%, ¥100bn Buyback](https://japan-equity.com/wp-content/uploads/2026/07/p27_sq-1024x1024.jpg)
![[Obayashi] Reducing Cross-Shareholdings — ¥285.2bn Sold in Five Years](https://japan-equity.com/wp-content/uploads/2026/07/p29_sq-1024x1024.jpg)
![[Obayashi] ¥750bn Investment Plan — ¥300bn to Development, ¥190bn to Tech/DX](https://japan-equity.com/wp-content/uploads/2026/07/p30_sq-1024x1024.jpg)
![[Obayashi] MTP2022 KPIs — Operating Profit ~2x Target, ROE 14.4%](https://japan-equity.com/wp-content/uploads/2026/07/p25_sq-1024x1024.jpg)
![[Obayashi] Cash Allocation — ¥420bn Investment CF Over Five Years](https://japan-equity.com/wp-content/uploads/2026/07/p26_sq-1024x1024.jpg)
![[Obayashi] Green Energy — 44 Plants, 344MW, and the Green Hydrogen Challenge](https://japan-equity.com/wp-content/uploads/2026/07/p21_sq-1024x1024.jpg)
![[Obayashi] Tackling the Labor Shortage — Robotics Construction®](https://japan-equity.com/wp-content/uploads/2026/07/p14_sq-1024x1024.jpg)
