
This article is based on publicly available IR materials and is not a recommendation to buy or sell any specific securities.
Note: Yamabiko’s fiscal term ends December 31, and the presentation labels the year ended December 31, 2025 as “FY25/12” (FY2025). Figures, tables and segment labels below follow the presentation.
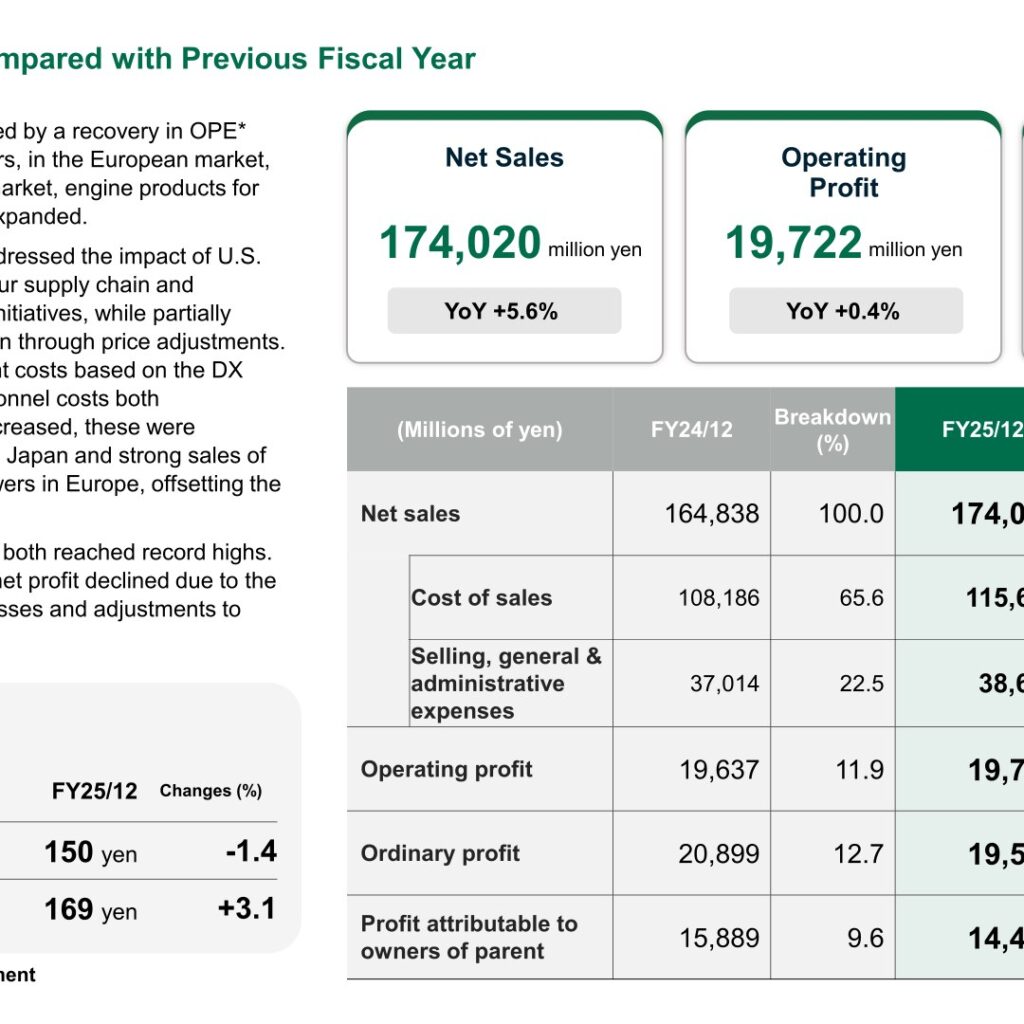
YAMABIKO CORPORATION reported net sales of 174,020 million yen for FY25/12, up 5.6% year on year, and operating profit of 19,722 million yen, up 0.4%. The company states that net sales and operating profit both reached record highs. Ordinary profit was 19,537 million yen, down 6.5%, and profit attributable to owners of parent was 14,444 million yen, down 9.1%, which the company attributes to the impact of foreign exchange losses and adjustments to corporate taxes. Alongside the results, Yamabiko presented its new Medium-Term Management Plan 2028.
Consolidated Results (Full-Year Actual)
Yamabiko says net sales increased, supported by a recovery in Outdoor Power Equipment (OPE) sales, including robotic mowers, in the European market, while in the North American market engine products for home improvement centers expanded. On profitability, the company states that it addressed the impact of U.S. tariff policies by reallocating its supply chain and implementing cost reduction initiatives, while partially passing the increased costs on through price adjustments. Increased IT-related investment costs based on the DX strategy and higher total personnel costs in Japan and overseas were absorbed by price revisions in Japan and strong sales of high-value-added robotic mowers in Europe. Assumed exchange rates moved from 152 yen to 150 yen per dollar (-1.4%) and from 164 yen to 169 yen per euro (+3.1%).
| (Millions of yen) | FY24/12 | FY25/12 | Changes (%) |
|---|---|---|---|
| Net sales | 164,838 | 174,020 | +5.6 |
| Cost of sales | 108,186 | 115,694 | +6.9 |
| Selling, general & administrative expenses | 37,014 | 38,603 | +4.3 |
| Operating profit | 19,637 | 19,722 | +0.4 |
| Ordinary profit | 20,899 | 19,537 | -6.5 |
| Profit attributable to owners of parent | 15,889 | 14,444 | -9.1 |
On the operating profit bridge, the presentation shows consolidated operating profit moving from 196 to 197 (hundred millions of yen), a change of +1: increased net sales +35, exchange rate factors +0, decline in gross profit margin -17 (an increase in the cost of sales ratio due to the impact of tariffs and rising raw material costs) and increased SG&A expenses -17 (increased IT-related investments under the DX strategy and higher total personnel expenses in Japan and abroad). On the net sales bridge, consolidated net sales moved from 1,648 to 1,740 (hundred millions of yen), a change of +92, with OPE +105, Industrial Machinery -10, Agricultural Machinery -5 and Others +2.
Segment Results
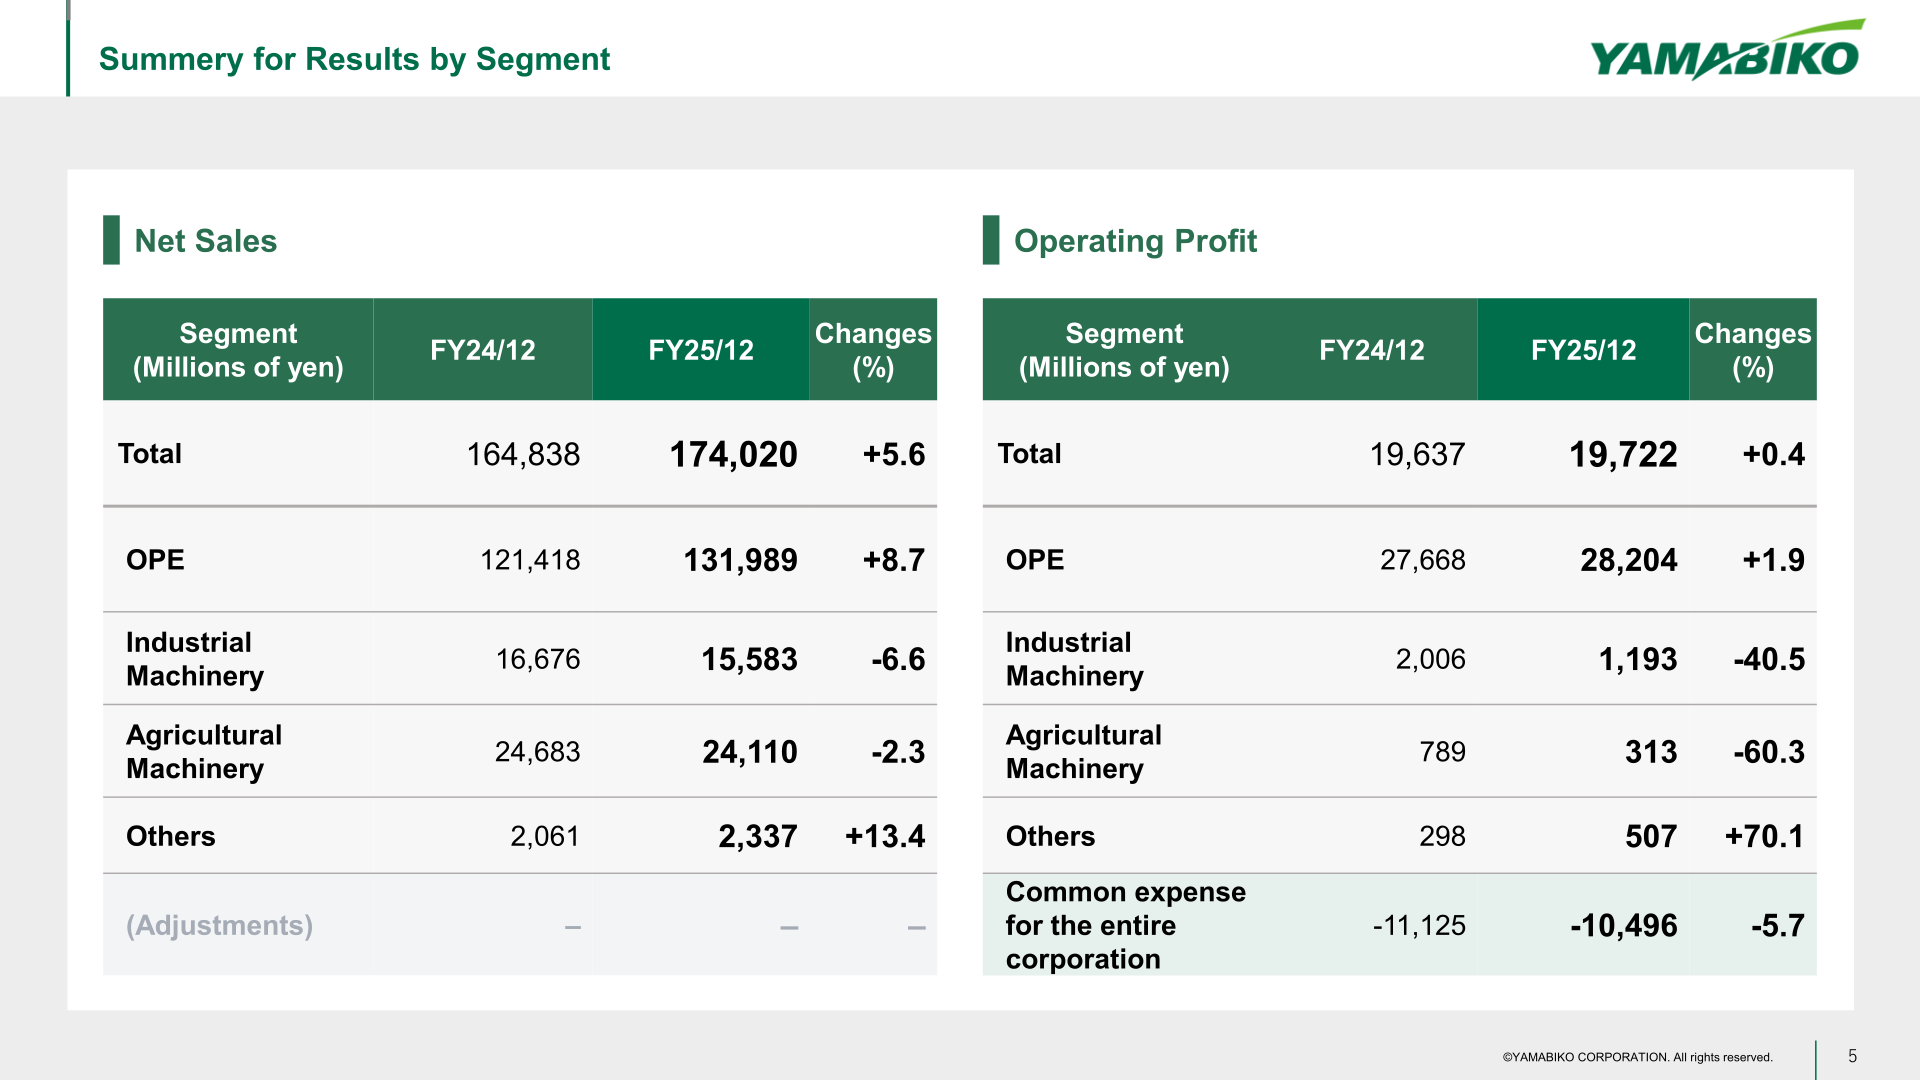
OPE, the largest segment, grew net sales 8.7% to 131,989 million yen and operating profit 1.9% to 28,204 million yen. Industrial Machinery sales fell 6.6% to 15,583 million yen with operating profit down 40.5% to 1,193 million yen, and Agricultural Machinery sales fell 2.3% to 24,110 million yen with operating profit down 60.3% to 313 million yen. Common expense for the entire corporation was -10,496 million yen versus -11,125 million yen a year earlier.
| Segment (Millions of yen) | Net sales FY24/12 | Net sales FY25/12 | Changes (%) | Operating profit FY24/12 | Operating profit FY25/12 | Changes (%) |
|---|---|---|---|---|---|---|
| Total | 164,838 | 174,020 | +5.6 | 19,637 | 19,722 | +0.4 |
| OPE | 121,418 | 131,989 | +8.7 | 27,668 | 28,204 | +1.9 |
| Industrial Machinery | 16,676 | 15,583 | -6.6 | 2,006 | 1,193 | -40.5 |
| Agricultural Machinery | 24,683 | 24,110 | -2.3 | 789 | 313 | -60.3 |
| Others | 2,061 | 2,337 | +13.4 | 298 | 507 | +70.1 |
| Common expense for the entire corporation | – | – | – | -11,125 | -10,496 | -5.7 |
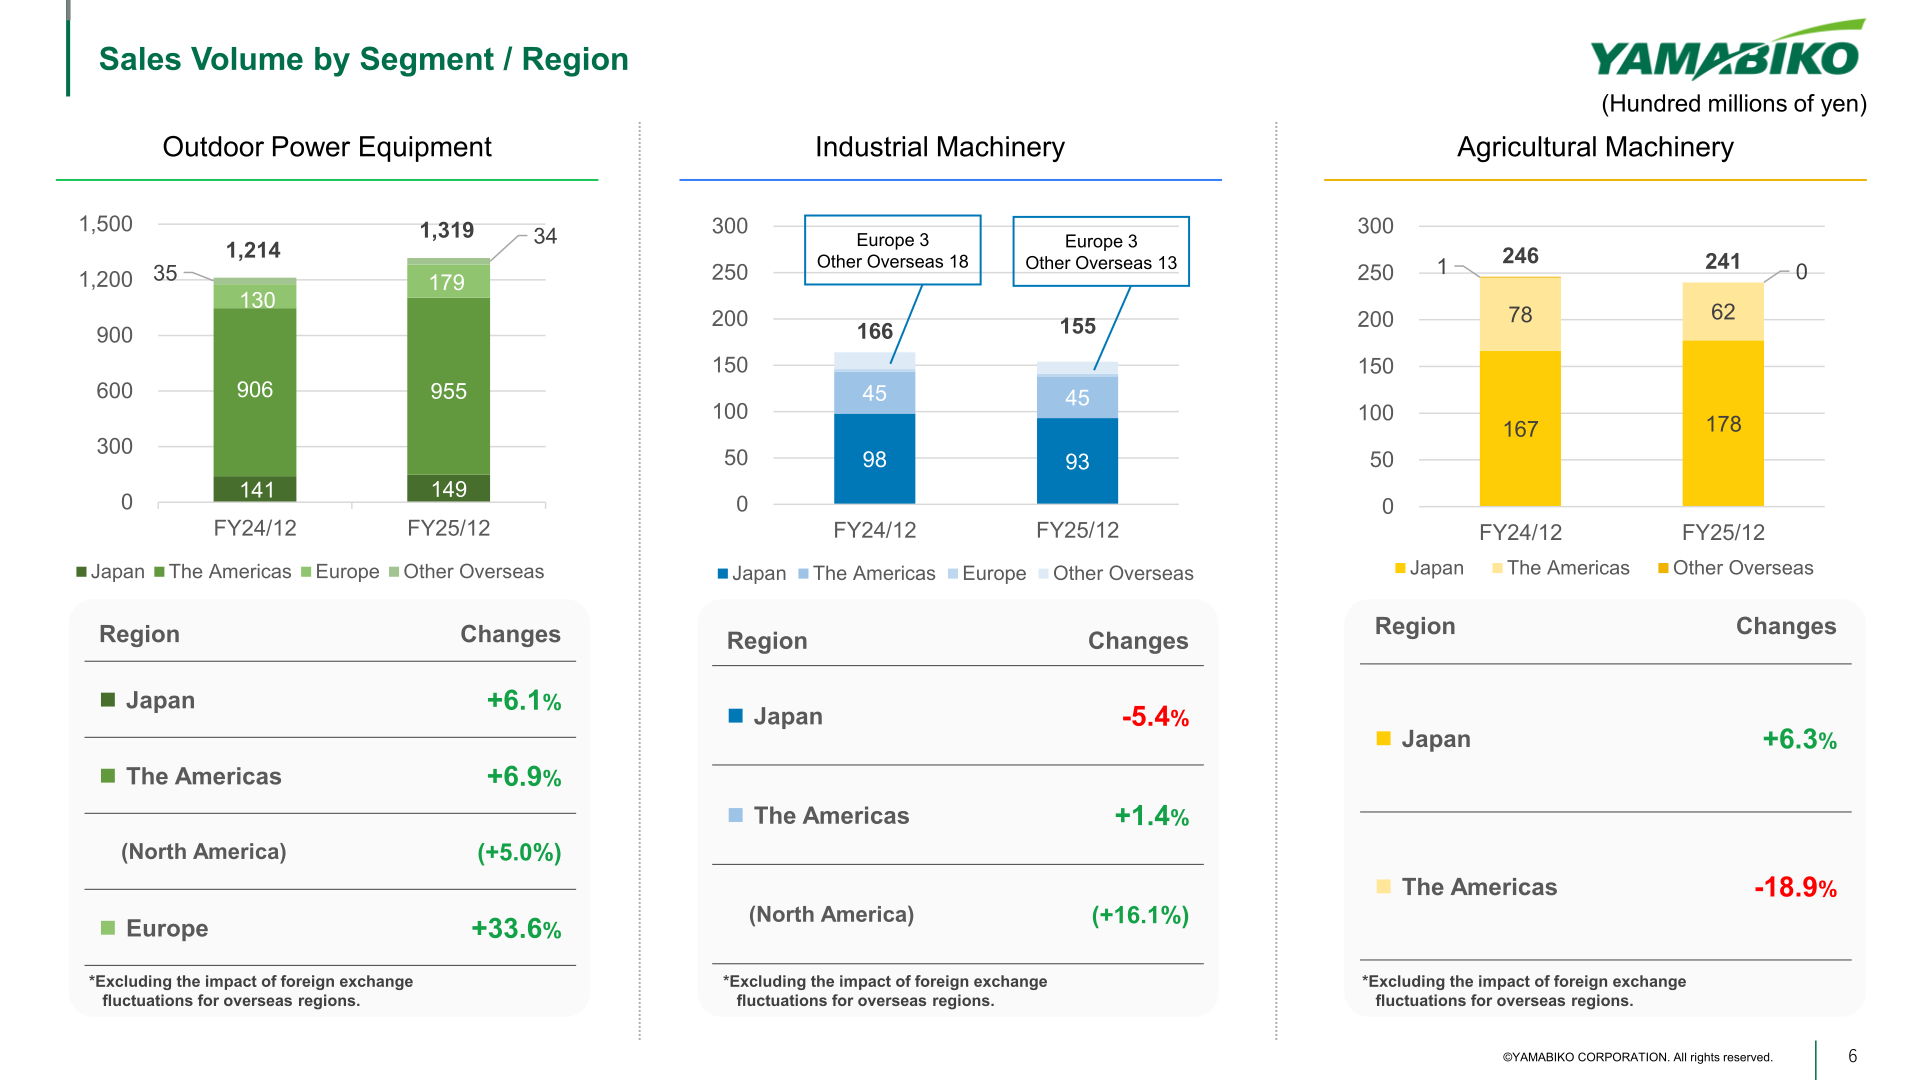
By region, the presentation shows FY2025/12 sales by region of 444.7 in Japan (26%), 1,063.8 in The Americas (61%), 183.3 in Europe (10%) and 48.2 in Others (3%), against a total of 1,740.2 (hundred millions of yen). By segment, sales were 1,319.8 for OPE (76%), 241.1 for Agricultural Machinery (14%), 155.8 for Industrial Machinery (9%) and 23.4 for Others (1%). Excluding the impact of foreign exchange fluctuations for overseas regions, OPE sales changes were Japan +6.1%, The Americas +6.9% (North America +5.0%) and Europe +33.6%; Industrial Machinery was Japan -5.4% and The Americas +1.4% (North America +16.1%); Agricultural Machinery was Japan +6.3% and The Americas -18.9%.
| Sales by region FY2025/12 (Hundred millions of yen) | Amount | Share |
|---|---|---|
| Japan | 444.7 | 26% |
| The Americas | 1,063.8 | 61% |
| Europe | 183.3 | 10% |
| Others | 48.2 | 3% |
| Total | 1740.2 | – |
FY2026 Forecast
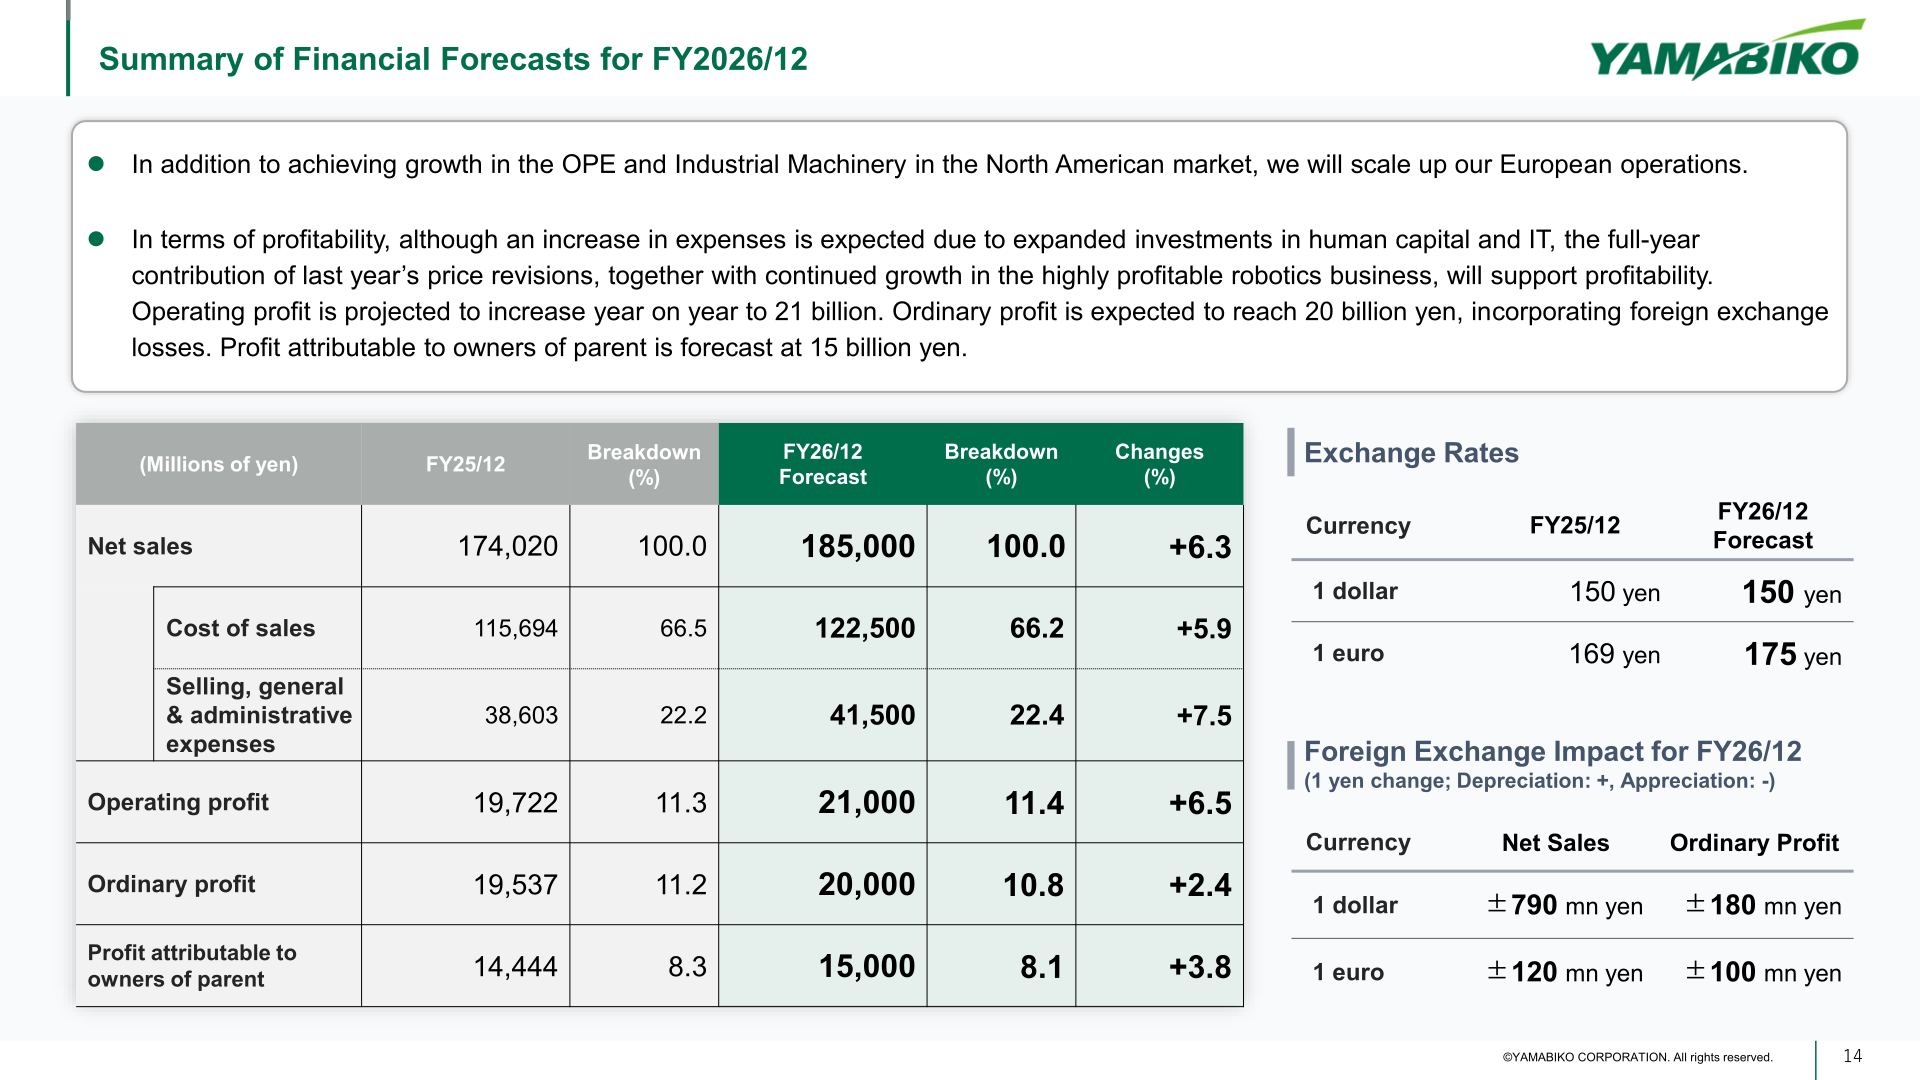
For FY26/12 Yamabiko forecasts net sales of 185,000 million yen (+6.3%), operating profit of 21,000 million yen (+6.5%), ordinary profit of 20,000 million yen (+2.4%) and profit attributable to owners of parent of 15,000 million yen (+3.8%). The company says it will achieve growth in OPE and Industrial Machinery in the North American market and scale up its European operations, and that although expenses are expected to increase on expanded investments in human capital and IT, the full-year contribution of last year’s price revisions together with continued growth in the highly profitable robotics business will support profitability. Assumed exchange rates are 150 yen per dollar (unchanged) and 175 yen per euro (from 169 yen). By segment, consolidated net sales are projected to rise from 1,740 to 1,850 (hundred millions of yen), a change of +110, with OPE +71, Industrial Machinery +49, Agricultural Machinery -10 and Others -0.
| (Millions of yen) | FY25/12 | FY26/12 Forecast | Changes (%) |
|---|---|---|---|
| Net sales | 174,020 | 185,000 | +6.3 |
| Cost of sales | 115,694 | 122,500 | +5.9 |
| Selling, general & administrative expenses | 38,603 | 41,500 | +7.5 |
| Operating profit | 19,722 | 21,000 | +6.5 |
| Ordinary profit | 19,537 | 20,000 | +2.4 |
| Profit attributable to owners of parent | 14,444 | 15,000 | +3.8 |
Shareholder Returns
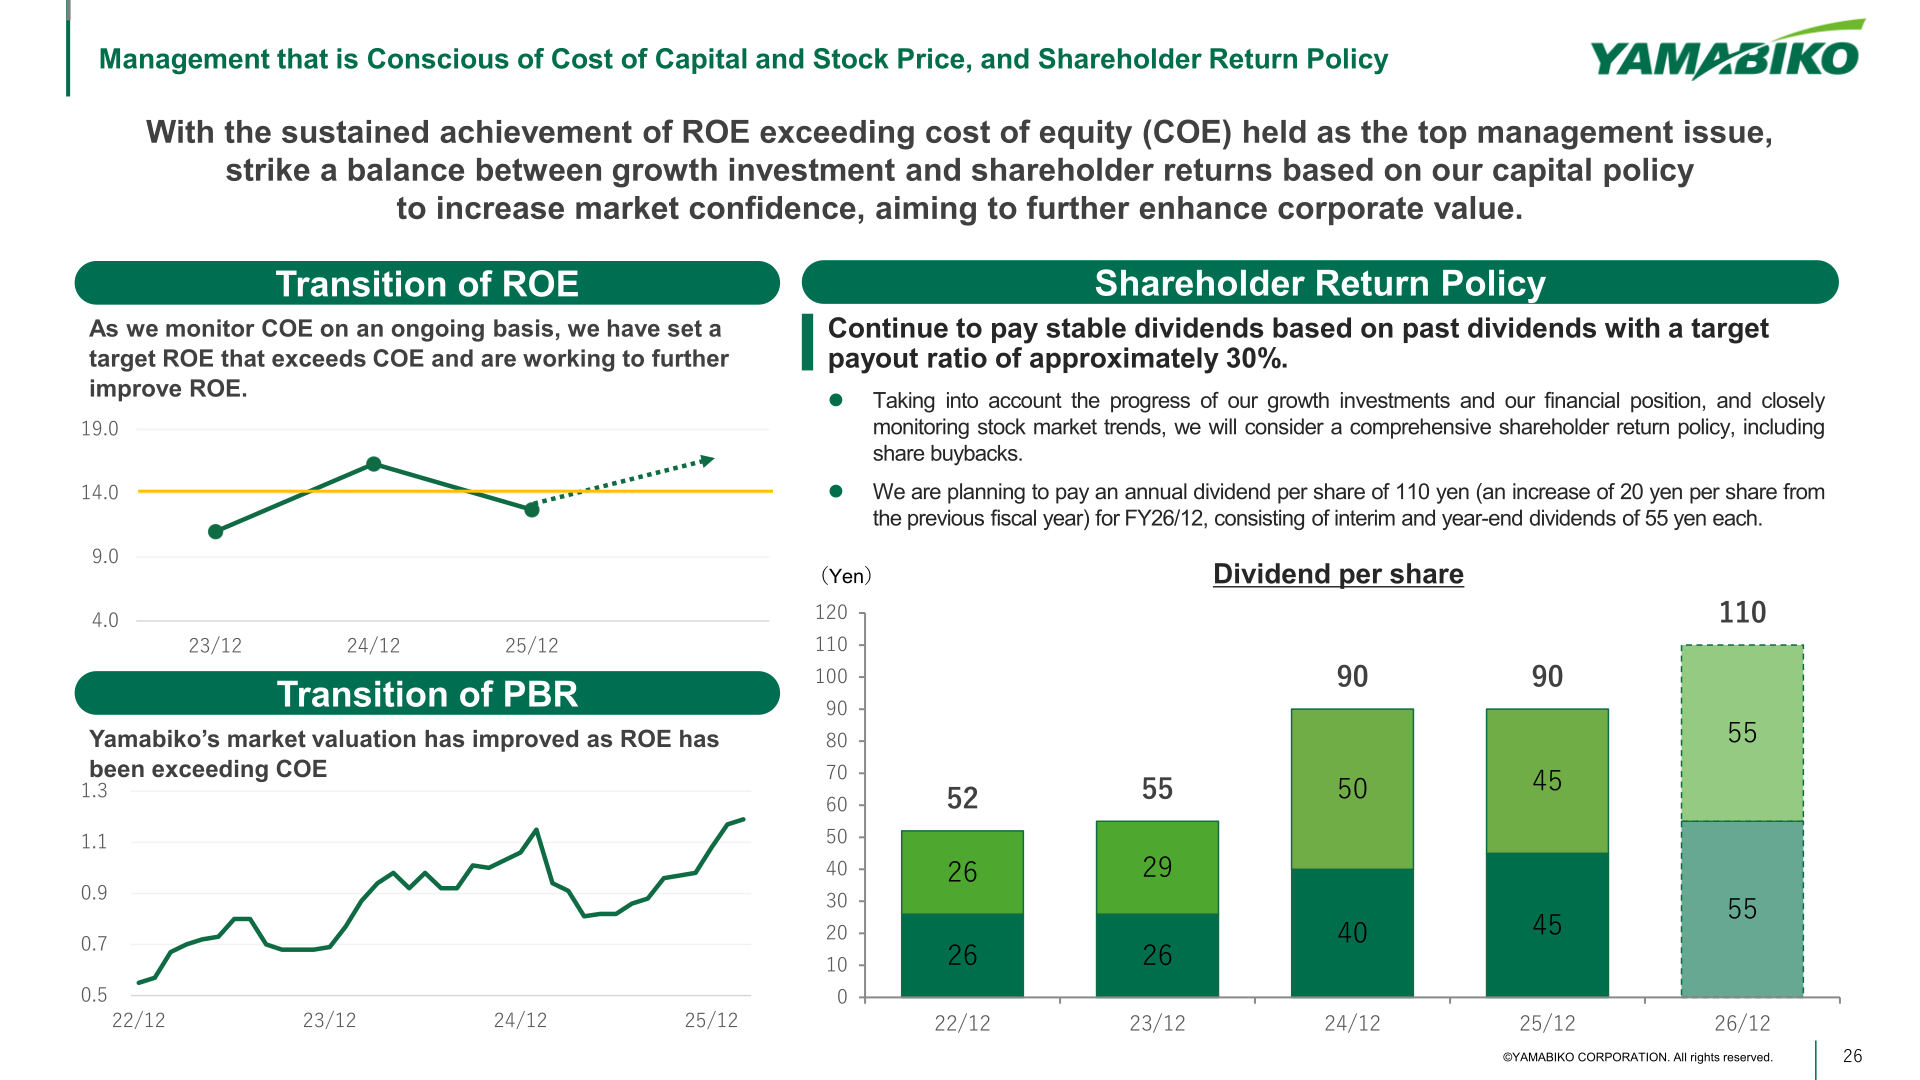
Yamabiko’s policy is to continue to pay stable dividends based on past dividends with a target payout ratio of approximately 30%. The company states that, taking into account the progress of its growth investments and its financial position, and closely monitoring stock market trends, it will consider a comprehensive shareholder return policy including share buybacks. For FY26/12 it plans an annual dividend per share of 110 yen, an increase of 20 yen per share from the previous fiscal year, consisting of interim and year-end dividends of 55 yen each.
| Dividend per share (Yen) | 22/12 | 23/12 | 24/12 | 25/12 | 26/12 |
|---|---|---|---|---|---|
| Interim | 26 | 26 | 40 | 45 | 55 |
| Year-end | 26 | 29 | 50 | 45 | 55 |
| Annual | 52 | 55 | 90 | 90 | 110 |
Medium-Term Plan
Yamabiko states that it achieved all numerical targets of Medium-Term Management Plan 2025: net sales of 174.0 bn yen against a target of 170.0 bn yen (vs. target +4.0 billion yen), an operating margin of 11.3% against a target of 7% (+4.3pt), and ROE of 12.7% against a target of 10% (+2.7pt). Under the new Medium-Term Management Plan 2028 covering FY2026-FY2028, the company aims for consolidated net sales of 2,100 (hundred millions of yen), an operating margin of 13.0% and ROE of 14.0% in FY2028, against FY2025 actual results of 1,740, 11.3% and 12.7% and an FY2026 forecast of 1,850, 11.4% and 12.3%. The plan assumes exchange rates of USD 150 yen and EUR 175 yen, and the company says it is aiming for consolidated net sales of 250 billion yen by 2030. Cumulative three-year operating cash flow is put at approximately 55.0 bn yen, to be allocated to business growth investment, shareholder returns and others.
Priorities cited for reaching the FY2028 targets are expansion of the European OPE and robotics business and capture of organic growth in the North American market, improving profitability by increasing the sales ratio of high-value-added products such as professional-grade and robotic products, promotion of structural reform in the domestic business, and enhancing operational efficiency and productivity through VA/VE, the integration of models, and the use of DX and AI.
This article is an analysis based on publicly available information and is not a recommendation to buy or sell any specific securities. Investment decisions are your own responsibility.
![[Obayashi] Investors’ Guide 2026 — The Complete 24-Article Breakdown](https://japan-equity.com/wp-content/uploads/2026/07/hub_cover-1024x1024.png)
![[Obayashi] IR & SR Policy — Feeding Dialogue Back into Management](https://japan-equity.com/wp-content/uploads/2026/07/p32_sq-1024x1024.jpg)
![[Obayashi] Domestic Civil Engineering — Resilience Spending Supports 9.6% Margin](https://japan-equity.com/wp-content/uploads/2026/07/p11_sq-1024x1024.jpg)
![[Obayashi] Overseas Construction — Orders Reach ¥1.2tn](https://japan-equity.com/wp-content/uploads/2026/07/p15_sq-1024x1024.jpg)
![[Obayashi] Share Price & External Ratings — vs TOPIX, ESG Index Inclusion](https://japan-equity.com/wp-content/uploads/2026/07/p40_sq-1024x1024.jpg)
![[Construction] ¥75.5tn Investment, Shrinking Workforce — Big-5 Market Share](https://japan-equity.com/wp-content/uploads/2026/07/p12_sq-1024x1024.jpg)



![[Obayashi] Capital Policy & Shareholder Returns — ROE 10%+, DOE ~5%, ¥100bn Buyback](https://japan-equity.com/wp-content/uploads/2026/07/p27_sq-1024x1024.jpg)
![[Obayashi] Reducing Cross-Shareholdings — ¥285.2bn Sold in Five Years](https://japan-equity.com/wp-content/uploads/2026/07/p29_sq-1024x1024.jpg)
![[Obayashi] ¥750bn Investment Plan — ¥300bn to Development, ¥190bn to Tech/DX](https://japan-equity.com/wp-content/uploads/2026/07/p30_sq-1024x1024.jpg)
![[Obayashi] MTP2022 KPIs — Operating Profit ~2x Target, ROE 14.4%](https://japan-equity.com/wp-content/uploads/2026/07/p25_sq-1024x1024.jpg)
![[Obayashi] Cash Allocation — ¥420bn Investment CF Over Five Years](https://japan-equity.com/wp-content/uploads/2026/07/p26_sq-1024x1024.jpg)
![[Obayashi] Green Energy — 44 Plants, 344MW, and the Green Hydrogen Challenge](https://japan-equity.com/wp-content/uploads/2026/07/p21_sq-1024x1024.jpg)
![[Obayashi] Tackling the Labor Shortage — Robotics Construction®](https://japan-equity.com/wp-content/uploads/2026/07/p14_sq-1024x1024.jpg)
