
This article is based on publicly available IR materials and is not a recommendation to buy or sell any specific securities.
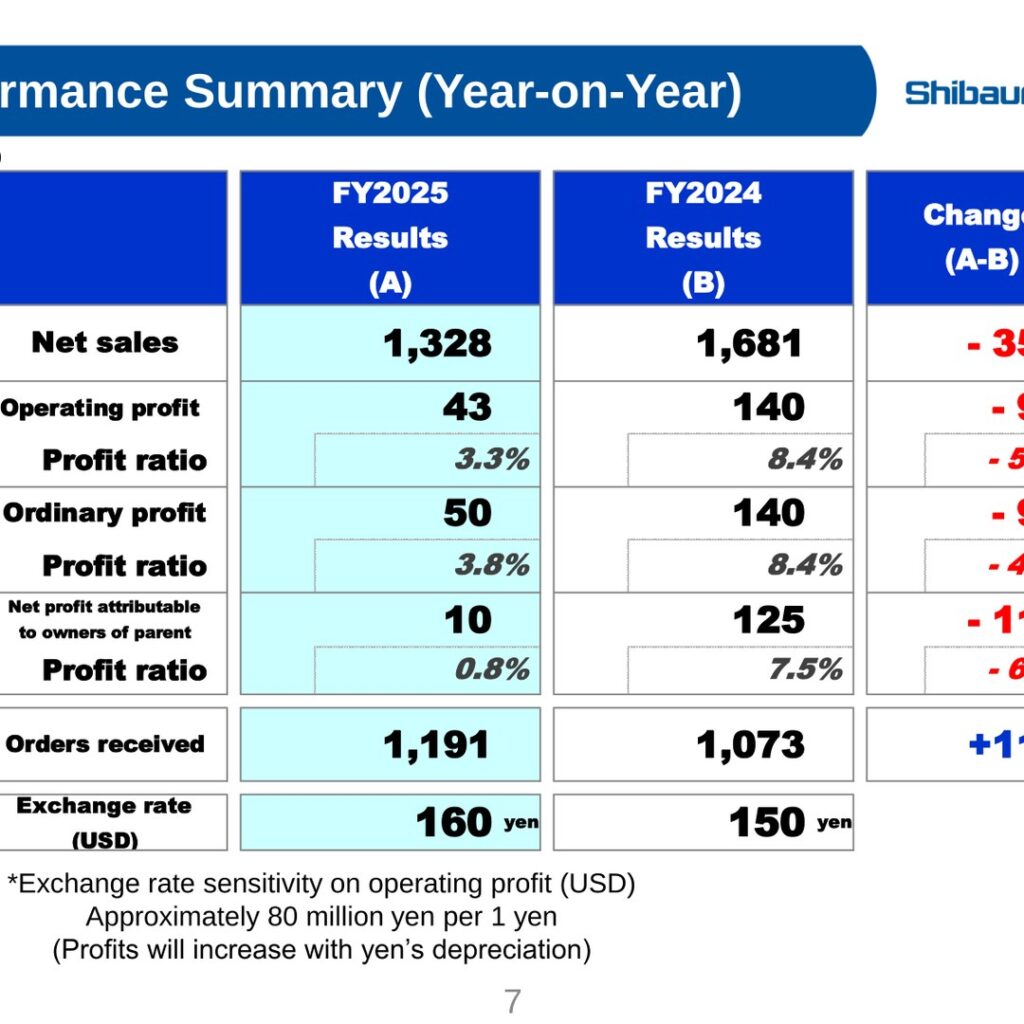
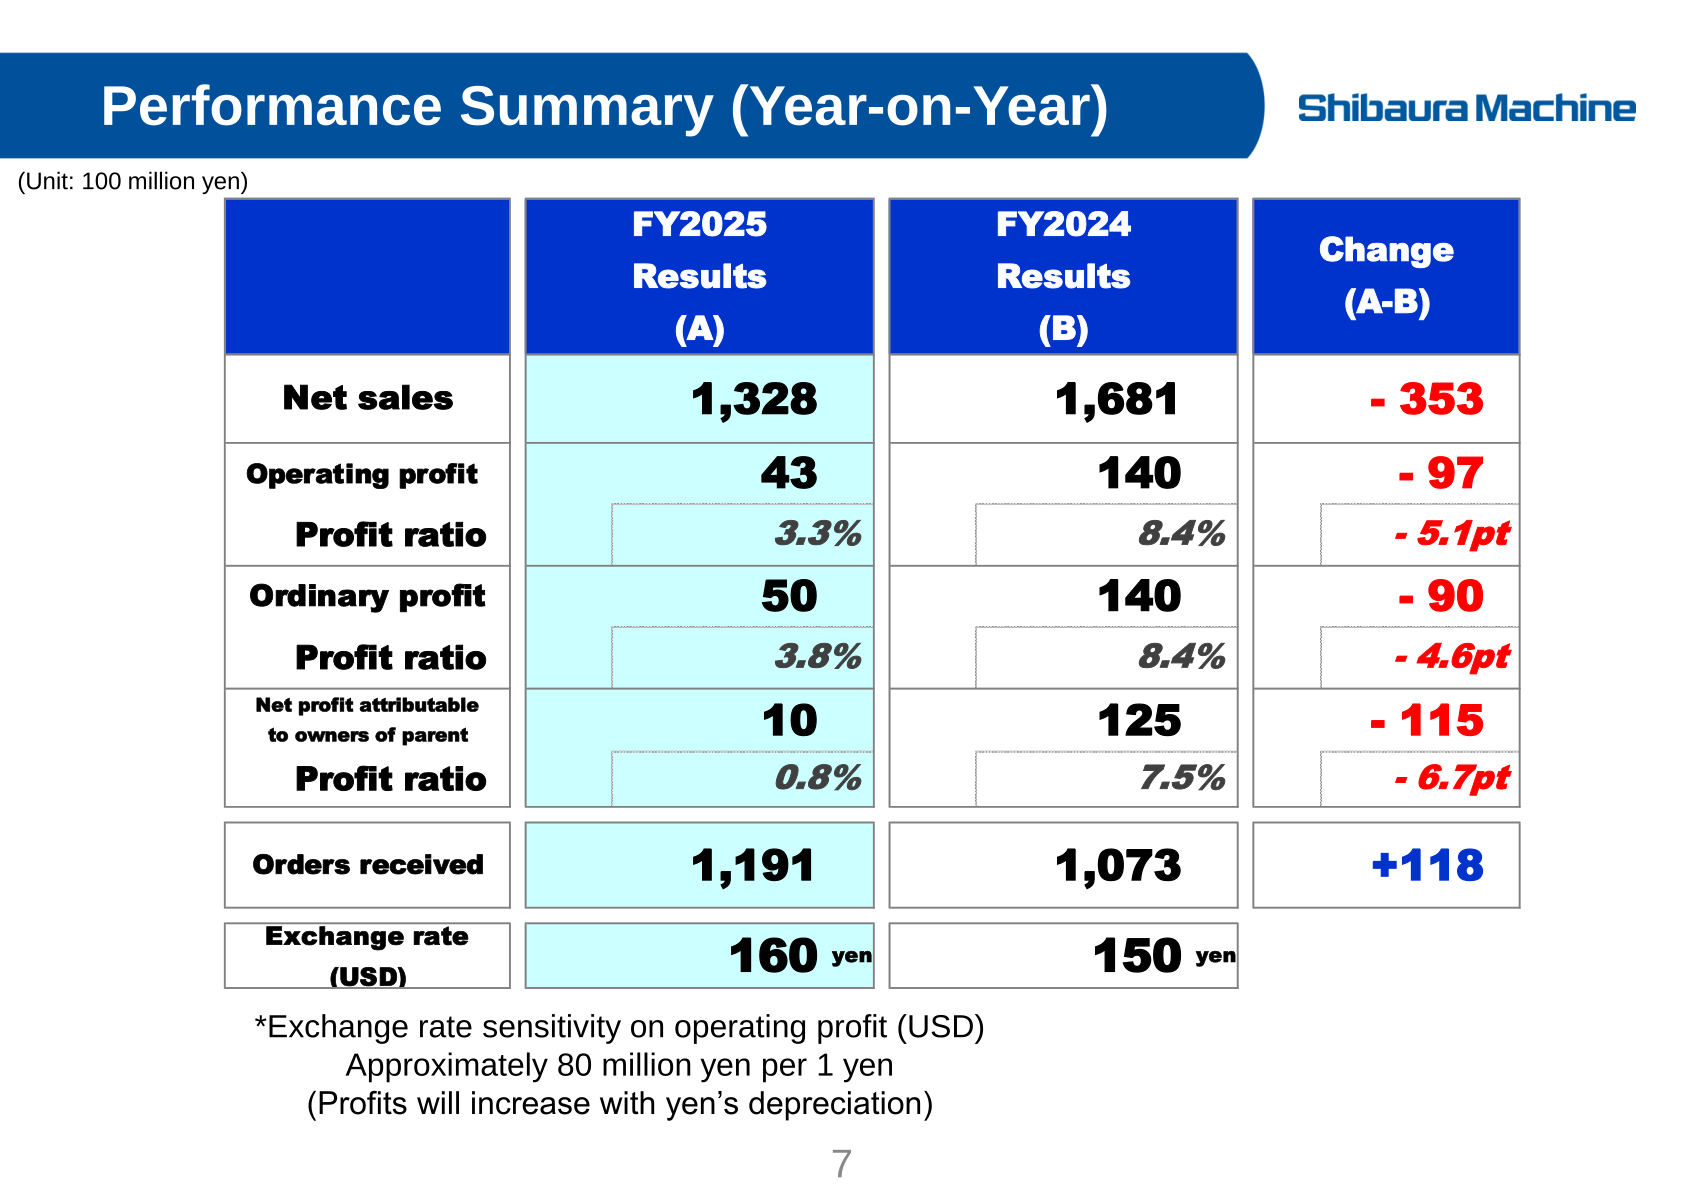
Shibaura Machine posted net sales of 1,328 (100 million yen) for FY2025, the year ended March 31, 2026, a decrease of 353 (-21.0%) from FY2024, with operating profit of 43 (-97, -69.0%), ordinary profit of 50 (-90, -64.5%) and net profit attributable to owners of parent of 10 (-115, -91.8%). The company attributes the decline in net sales mainly to a fall in “BSF” (LiB separator film production lines for lithium-ion batteries) for EV in China in extrusion machines, despite increases in Injection, Machine tools and Precision. Orders received, by contrast, rose 118 (+11.0%) year on year to 1,191, with Machine tools up 108 (+44.9%). Results also came in below the initial FY2025 forecast announced on May 12, 2025 on every headline line except ordinary profit.
Consolidated Results (Full-Year Actual)
All figures below are stated in the unit used by the materials, 100 million yen. The presentation labels the year ended March 31, 2026 as “FY2025”. Net profit fell short of the initial forecast because of extraordinary losses, including an impairment loss on goodwill of SHIBAURA MACHINE LWB GmbH and extraordinary retirement benefits, while ordinary profit reached the target thanks to favorable foreign exchange gains. The materials note exchange rate sensitivity on operating profit (USD) of approximately 80 million yen per 1 yen, with profits increasing as the yen depreciates.
| Item | FY2025 Results | FY2024 Results | Change (YoY) | FY2025 Forecast (Announced on May 12, 2025) | Change (vs. Forecast) |
|---|---|---|---|---|---|
| Net sales | 1,328 | 1,681 | – 353 | 1,400 | – 72 |
| Operating profit | 43 | 140 | – 97 | 50 | – 7 |
| Operating profit ratio | 3.3% | 8.4% | – 5.1pt | 3.6% | – 0.3pt |
| Ordinary profit | 50 | 140 | – 90 | 50 | +0 |
| Ordinary profit ratio | 3.8% | 8.4% | – 4.6pt | 3.6% | +0.2pt |
| Net profit attributable to owners of parent | 10 | 125 | – 115 | 33 | – 23 |
| Net profit ratio | 0.8% | 7.5% | – 6.7pt | 2.4% | – 1.6pt |
| Orders received | 1,191 | 1,073 | +118 | 1,380 | – 189 |
| Exchange rate (USD) | 160 yen | 150 yen | 145 yen |
Orders Received and Order Backlog
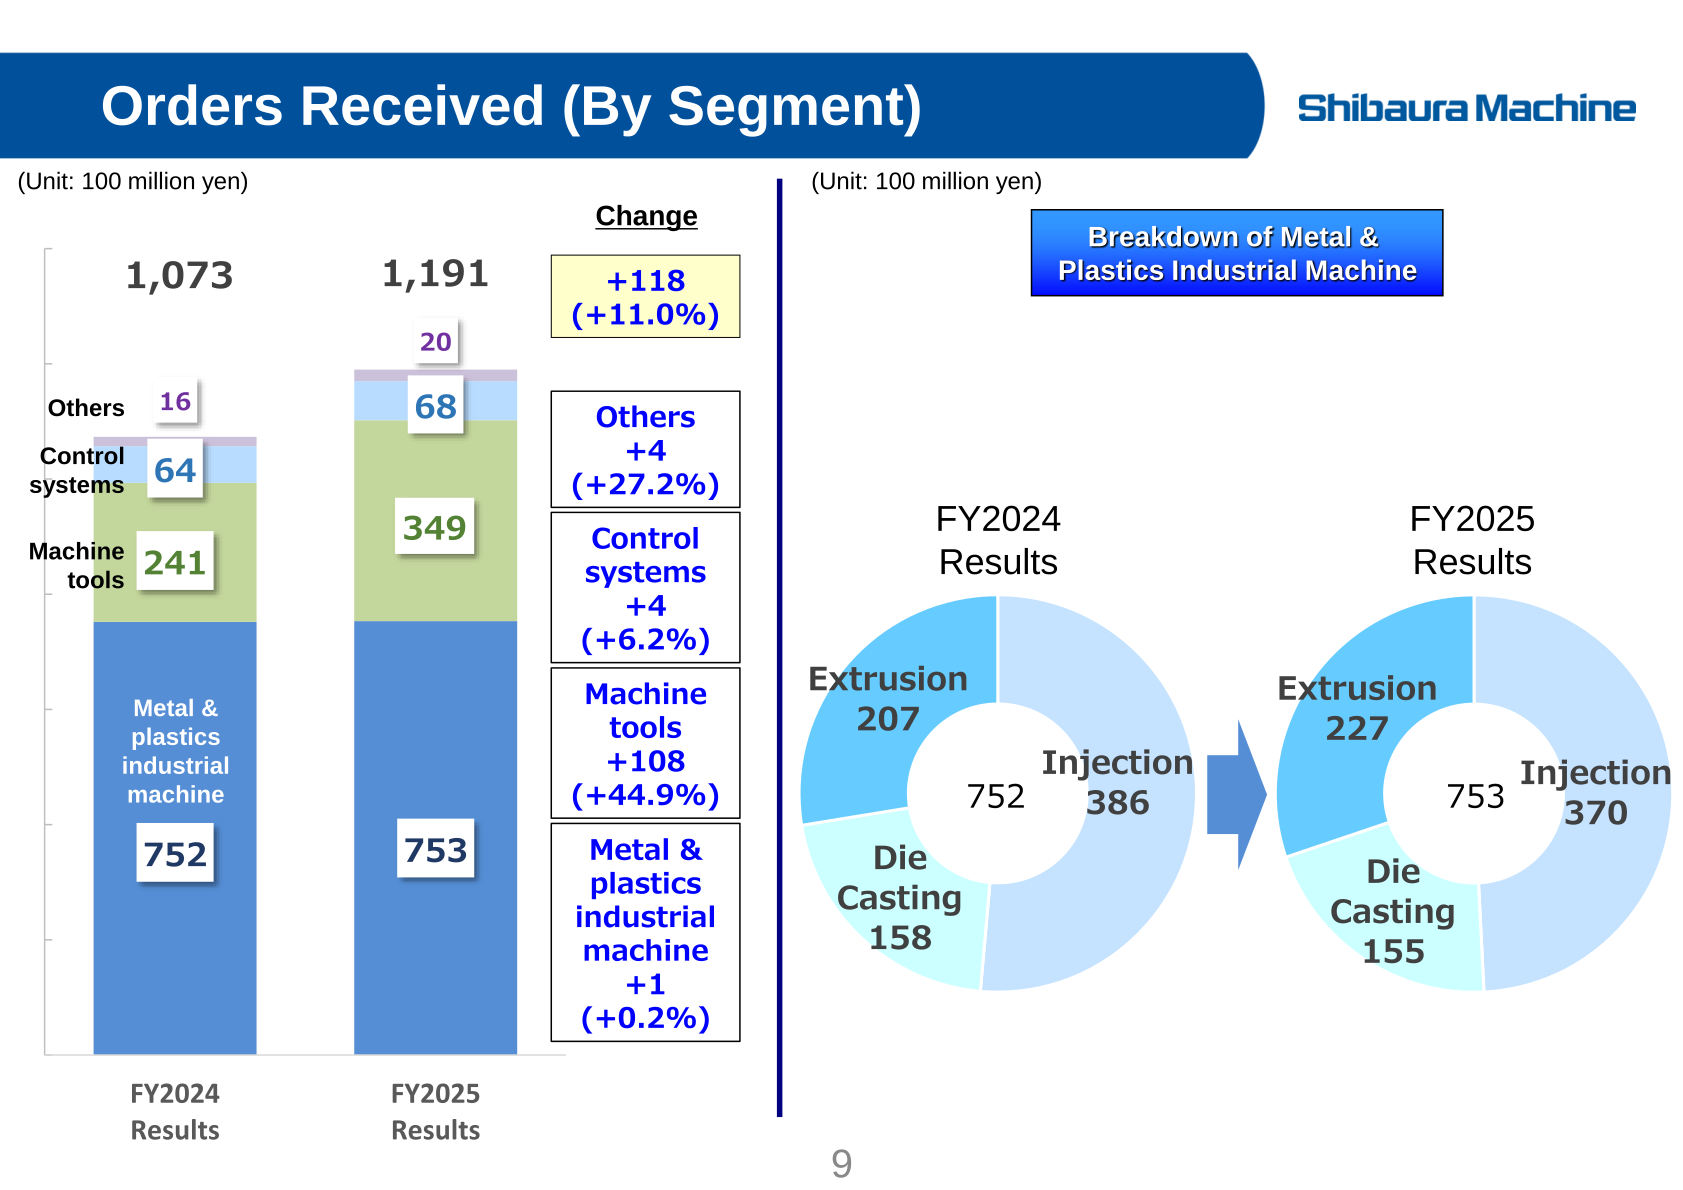
Orders received increased across all segments in FY2025. Orders for Machine tools and Precision increased significantly on favorable market conditions, and orders for extrusion machines increased with an order for a full line of “BSF” received for the first time in approximately two years. Within Metal & plastics industrial machine, orders were Injection 370, Die Casting 155 and Extrusion 227 in FY2025, against Injection 386, Die Casting 158 and Extrusion 207 in FY2024. Order backlog at the end of FY2025 fell to 966 from 1,094, as the Metal & plastics industrial machine backlog declined 227 (-26.9%) while Machine tools rose 97 (+44.7%).
| Segment | Orders Received FY2025 | Orders Received FY2024 | Change | Order Backlog FY2025 | Order Backlog FY2024 | Change |
|---|---|---|---|---|---|---|
| Metal & plastics industrial machine | 753 | 752 | +1 (+0.2%) | 615 | 842 | -227 (-26.9%) |
| Machine tools | 349 | 241 | +108 (+44.9%) | 313 | 216 | +97 (+44.7%) |
| Control systems | 68 | 64 | +4 (+6.2%) | 34 | 31 | +3 (+9.9%) |
| Others | 20 | 16 | +4 (+27.2%) | 3 | 4 | -1 (-28.3%) |
| Total | 1,191 | 1,073 | +118 (+11.0%) | 966 | 1,094 | -128 (-11.7%) |
On current orders, the materials state that for Injection and Die Casting capital investment remains on hold due to the impact of U.S. trade policy, the situation in Iran, and the stagnant auto market; that demand for the “BSF” is also increasing for ESS (Energy Storage System) in addition to EV; that Machine Tools demand is strong for energy, aerospace, domestic shipbuilding and defense-related applications; that Precision demand for optical communications is strong due to the expansion of demand for large servers driven by the spread of AI, along with vehicle-mounted optical molds; and that Control is focusing on engineering solutions.
Segment Results
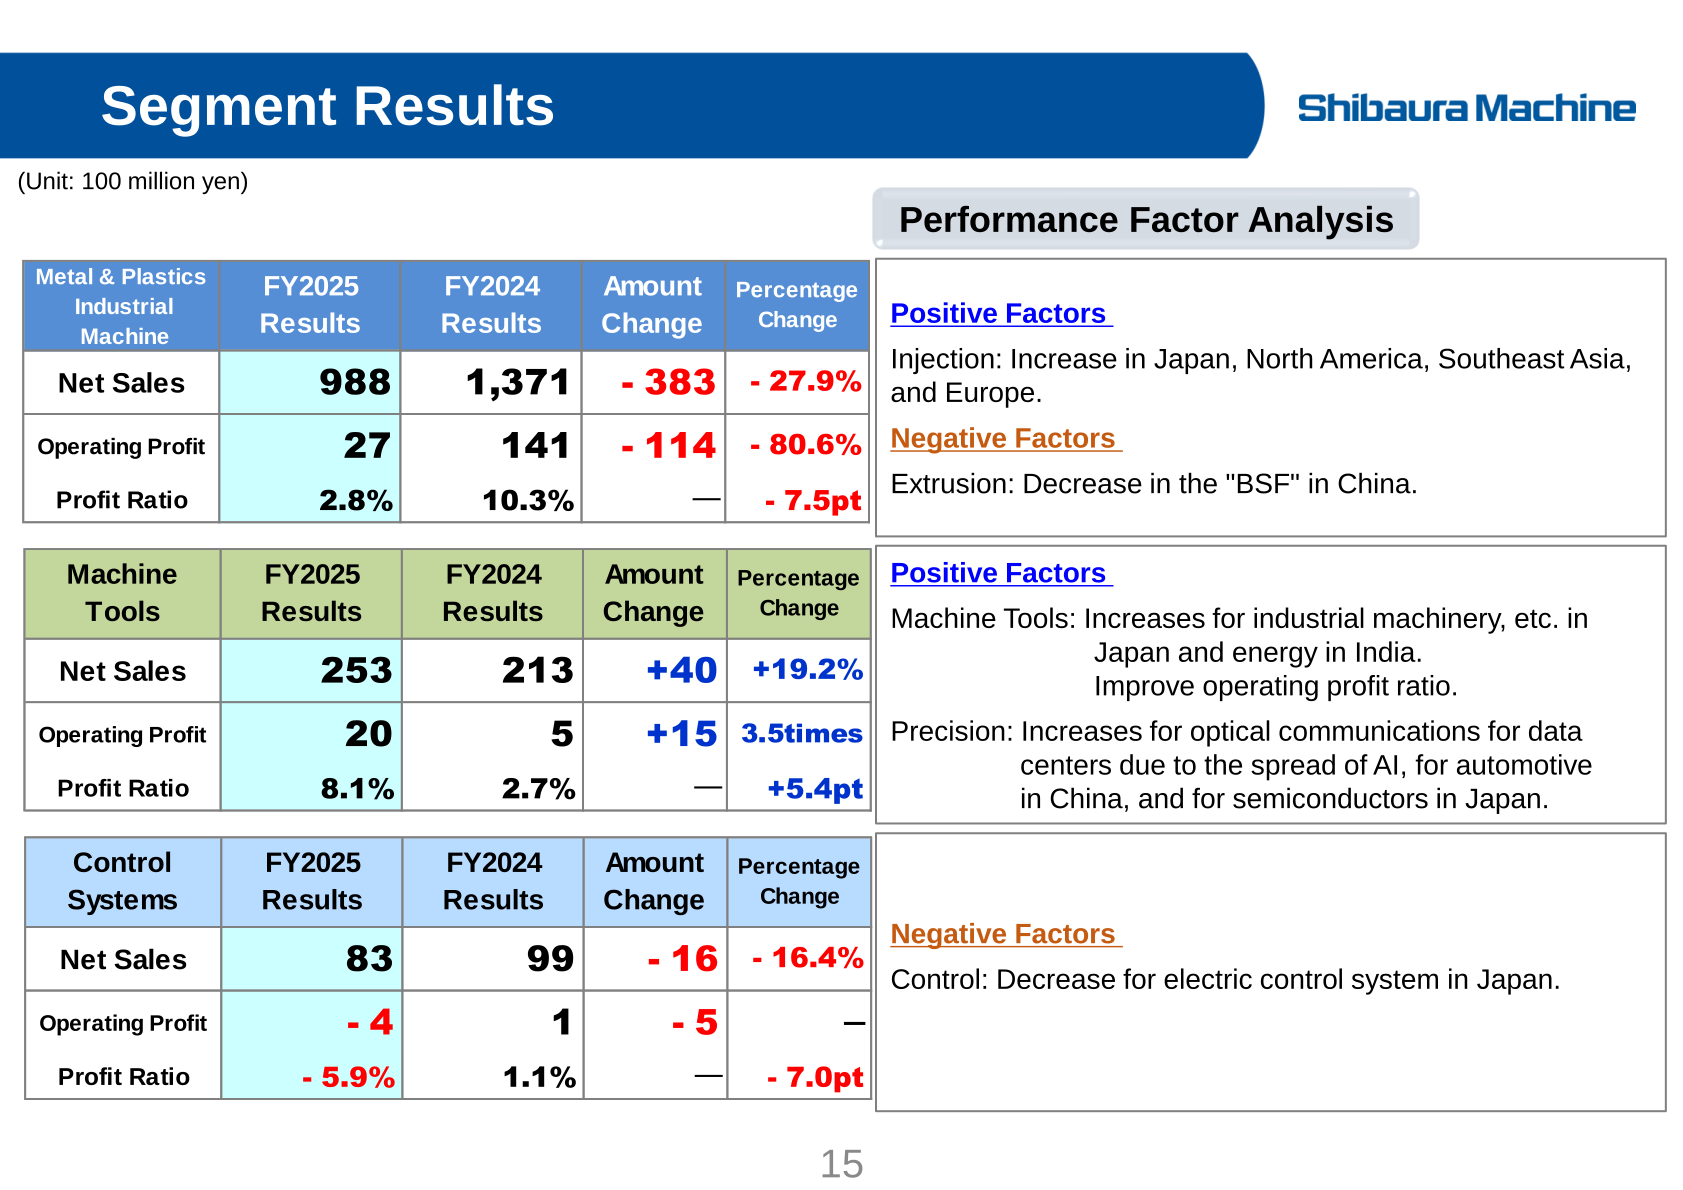
Net sales by segment in FY2025 were Metal & plastics industrial machine 988, Machine tools 253, Control systems 83 and Others 26, against 1,371 / 213 / 99 / 20 respectively in FY2024. Within Metal & plastics industrial machine, FY2025 net sales were Injection 406, Die Casting 170 and Extrusion 411, compared with Injection 353, Die Casting 174 and Extrusion 843 in FY2024. Domestic sales were 401 in FY2025 versus 384 in FY2024, and overseas sales were 926 versus 1,297, with the overseas ratio moving from 77% to 70%.
| Segment | Item | FY2025 Results | FY2024 Results | Amount Change | Percentage Change |
|---|---|---|---|---|---|
| Metal & Plastics Industrial Machine | Net Sales | 988 | 1,371 | – 383 | – 27.9% |
| Metal & Plastics Industrial Machine | Operating Profit | 27 | 141 | – 114 | – 80.6% |
| Metal & Plastics Industrial Machine | Profit Ratio | 2.8% | 10.3% | — | – 7.5pt |
| Machine Tools | Net Sales | 253 | 213 | +40 | +19.2% |
| Machine Tools | Operating Profit | 20 | 5 | +15 | 3.5times |
| Machine Tools | Profit Ratio | 8.1% | 2.7% | — | +5.4pt |
| Control Systems | Net Sales | 83 | 99 | – 16 | – 16.4% |
| Control Systems | Operating Profit | – 4 | 1 | – 5 | — |
| Control Systems | Profit Ratio | – 5.9% | 1.1% | — | – 7.0pt |
Financial Position and Cash Flow
Total assets stood at 1,734 at the end of March 2026, down from 1,996 a year earlier, with inventory falling 122 to 500 and cash falling 115 to 428. Contract liabilities declined 259 to 104 and shareholder equity was 1,007 against 1,026. The equity ratio improved to 68.3% from 58.7%, and the D/E ratio was 9.1% against 8.6%. Cash flow from operating activities was -84 in FY2025 against 83 in FY2024, cash flow from investment activities was -18, and cash flow from financial activities was -35, including dividend payment of -33. Free cash flow was -102 in FY2025 compared with +92 in FY2024, and the closing balance of cash and cash equivalents was 427 against 543.
FY2026 Forecast
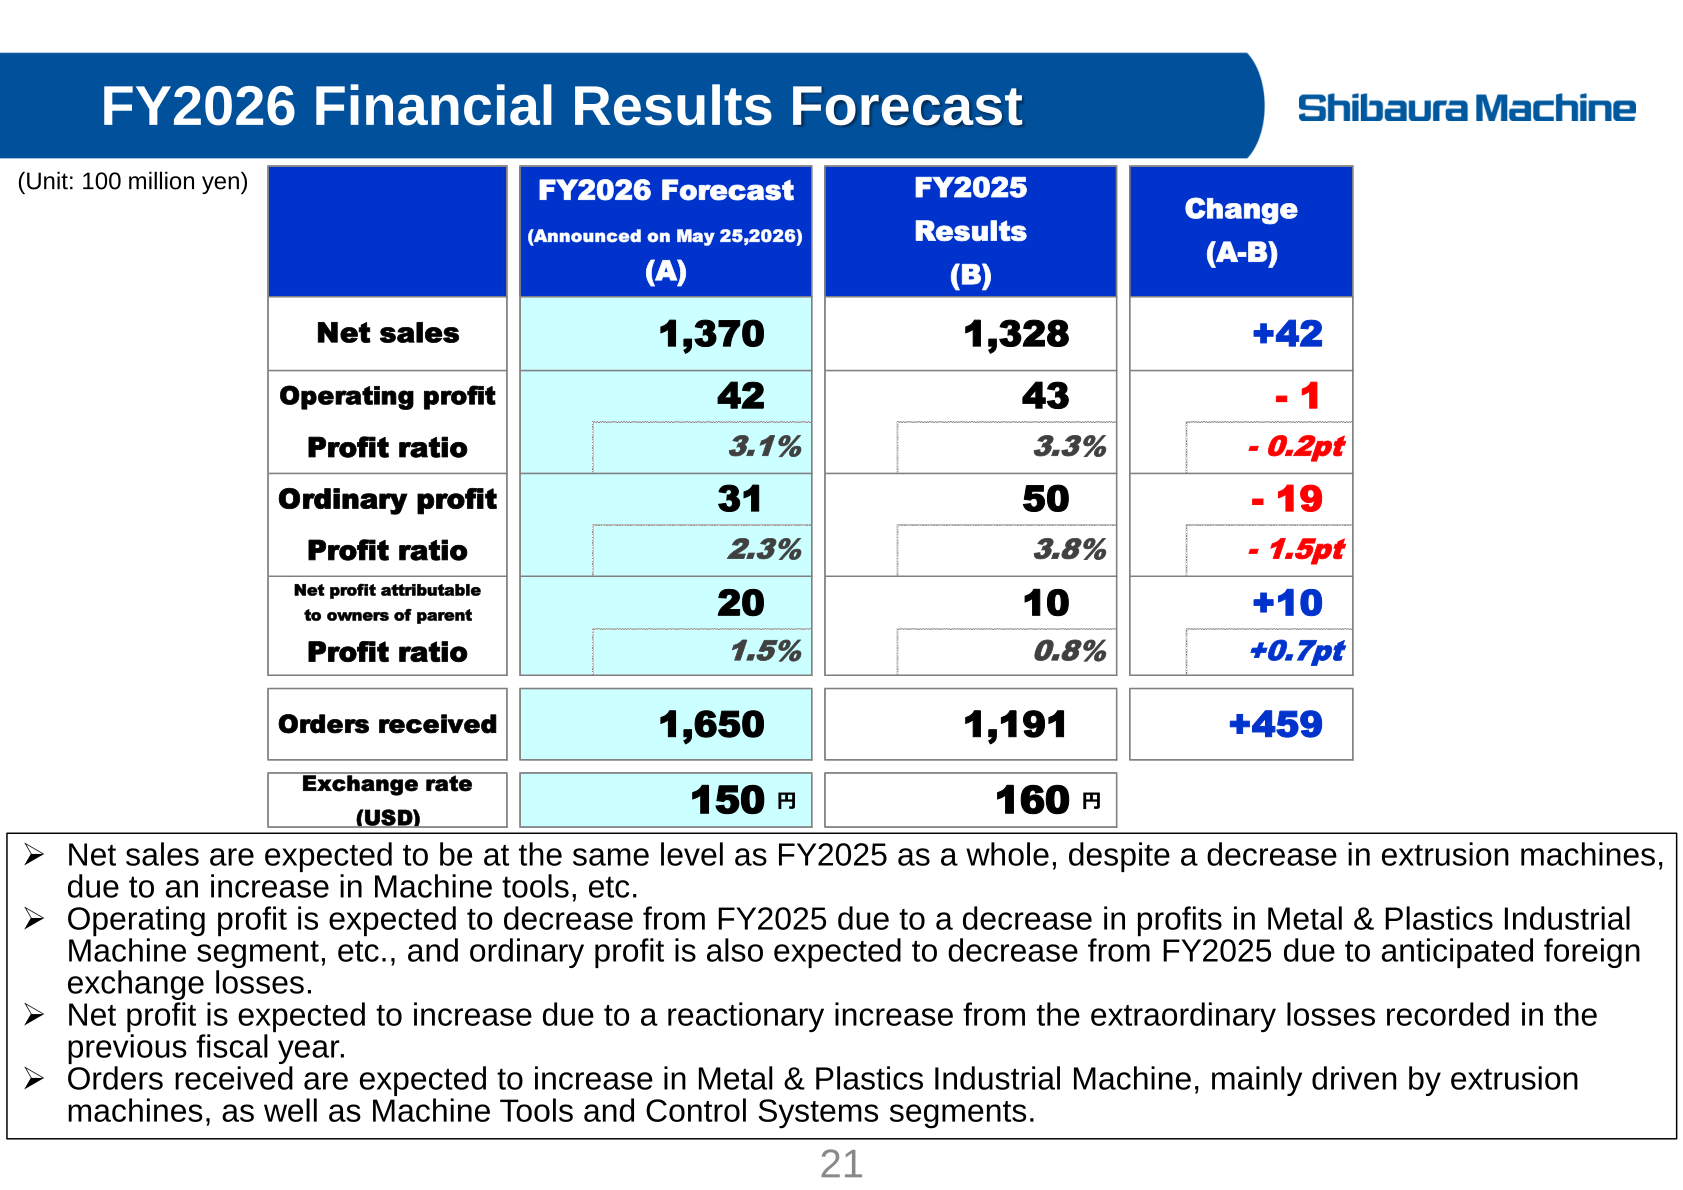
For FY2026, the year ending March 31, 2027, the company forecasts net sales of 1,370 (+42), operating profit of 42 (-1), ordinary profit of 31 (-19) and net profit attributable to owners of parent of 20 (+10), on an assumed exchange rate of 150 yen to the US dollar. Orders received are forecast at 1,650, up 459 (+38.5%). The materials state that net sales are expected to be at the same level as FY2025 as a whole despite a decrease in extrusion machines, that operating profit is expected to decrease due to lower profits in the Metal & Plastics Industrial Machine segment and ordinary profit due to anticipated foreign exchange losses, and that net profit is expected to increase as a reactionary increase from the extraordinary losses recorded in the previous fiscal year.
| Item | FY2026 Forecast (Announced on May 25, 2026) | FY2025 Results | Change |
|---|---|---|---|
| Net sales | 1,370 | 1,328 | +42 |
| Operating profit | 42 | 43 | – 1 |
| Operating profit ratio | 3.1% | 3.3% | – 0.2pt |
| Ordinary profit | 31 | 50 | – 19 |
| Ordinary profit ratio | 2.3% | 3.8% | – 1.5pt |
| Net profit attributable to owners of parent | 20 | 10 | +10 |
| Net profit ratio | 1.5% | 0.8% | +0.7pt |
| Orders received | 1,650 | 1,191 | +459 |
| Exchange rate (USD) | 150 yen | 160 yen | |
| Metal & Plastics Industrial Machine: Net Sales | 921 | 988 | – 67 |
| Metal & Plastics Industrial Machine: Operating Profit | 19 | 27 | – 8 |
| Machine Tools: Net Sales | 331 | 253 | +78 |
| Machine Tools: Operating Profit | 22 | 20 | +2 |
| Control Systems: Net Sales | 110 | 83 | +27 |
| Control Systems: Operating Profit | 1 | – 4 | +5 |
Planned spending for FY2026 is R&D expenses of 27 (26 in FY2025), capital expenditures of 43 (24 in FY2025, against 57 in FY2024 which included a new plant in India), and depreciation expenses of 29 (32 in FY2025).
Shareholder Returns
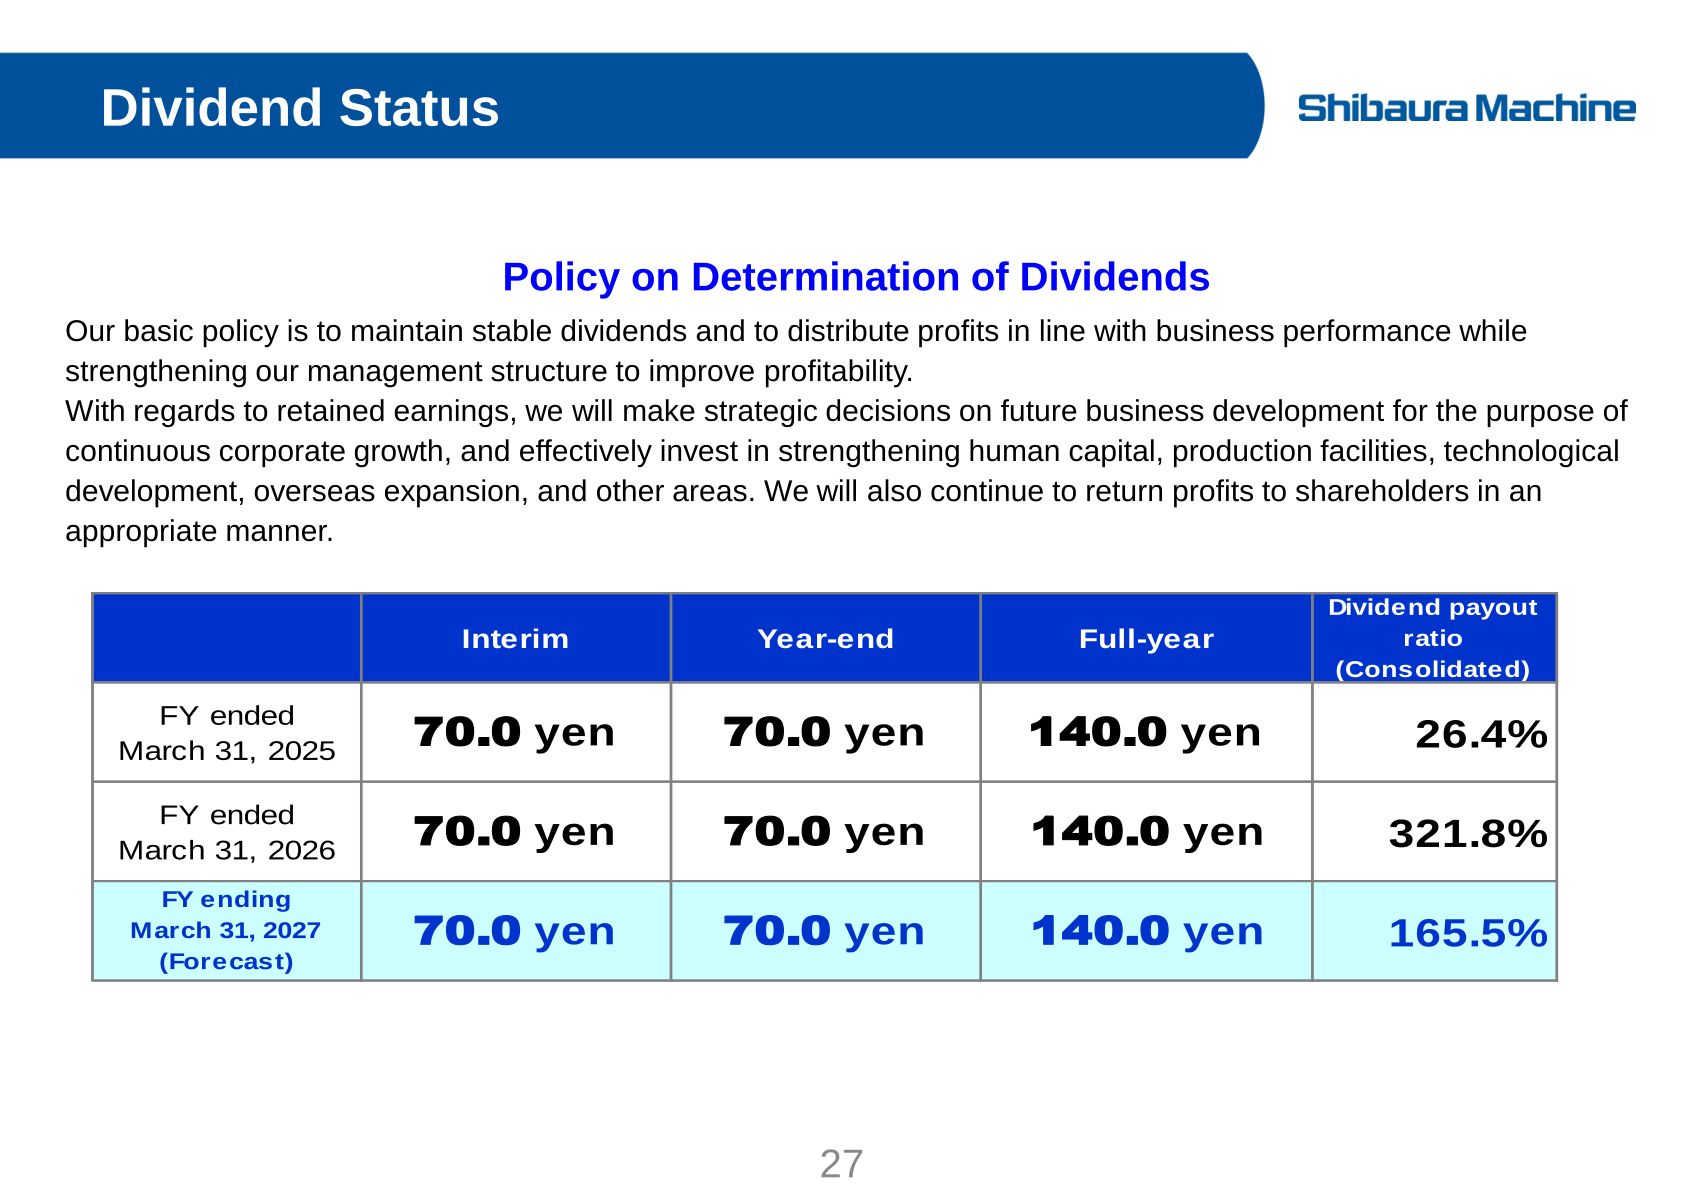
The basic policy stated in the materials is to maintain stable dividends and to distribute profits in line with business performance while strengthening the management structure to improve profitability. With regard to retained earnings, the company states it will make strategic decisions on future business development for the purpose of continuous corporate growth and effectively invest in strengthening human capital, production facilities, technological development, overseas expansion and other areas, while continuing to return profits to shareholders in an appropriate manner. The full-year dividend for the year ended March 31, 2026 was maintained at 140.0 yen, and the same 140.0 yen is forecast for the year ending March 31, 2027.
| Period | Interim | Year-end | Full-year | Dividend payout ratio (Consolidated) |
|---|---|---|---|---|
| FY ended March 31, 2025 | 70.0 yen | 70.0 yen | 140.0 yen | 26.4% |
| FY ended March 31, 2026 | 70.0 yen | 70.0 yen | 140.0 yen | 321.8% |
| FY ending March 31, 2027 (Forecast) | 70.0 yen | 70.0 yen | 140.0 yen | 165.5% |
M&A Track Record
Under the current Medium-Term Management Plan, the company completed the acquisition of Functional Fluids Ltd. (date of stock transfer May 1, 2025) to expand sales of injection molding machines and die casting machines, expand globally and contribute to the SDGs, and the acquisition of an equity interest in SHIBAURA MACHINE LWB GmbH of Germany, formerly LWB Steinl GmbH (November 28, 2025), to expand its business in Europe focusing on injection molding machines. An acquisition of an equity interest in Moore Nanotechnology Systems, LLC of the USA is in progress to accelerate the globalization of the ultra-precision machine tool business and develop new markets, with the equity interest transfer agreement dated May 18, 2026 and the acquisition scheduled for the second half of 2026. Under the previous Medium-Term Management Plan, the company acquired TECHNOLINK CO., LTD., formerly POKKA MACHINE Co., Ltd. (date of stock transfer March 1, 2024), to expand the system engineering business and strengthen system sales of its products.
This article is an analysis based on publicly available information and is not a recommendation to buy or sell any specific securities. Investment decisions are your own responsibility.
![[Obayashi] Investors’ Guide 2026 — The Complete 24-Article Breakdown](https://japan-equity.com/wp-content/uploads/2026/07/hub_cover-1024x1024.png)
![[Obayashi] IR & SR Policy — Feeding Dialogue Back into Management](https://japan-equity.com/wp-content/uploads/2026/07/p32_sq-1024x1024.jpg)
![[Obayashi] Real Estate Development — 18.7% Margin, ¥287.7bn Unrealized Gains](https://japan-equity.com/wp-content/uploads/2026/07/p20_sq-1024x1024.jpg)
![[Obayashi] Domestic Civil Engineering — Resilience Spending Supports 9.6% Margin](https://japan-equity.com/wp-content/uploads/2026/07/p11_sq-1024x1024.jpg)
![[Obayashi] Share Price & External Ratings — vs TOPIX, ESG Index Inclusion](https://japan-equity.com/wp-content/uploads/2026/07/p40_sq-1024x1024.jpg)
![[Construction] ¥75.5tn Investment, Shrinking Workforce — Big-5 Market Share](https://japan-equity.com/wp-content/uploads/2026/07/p12_sq-1024x1024.jpg)



![[Obayashi] Capital Policy & Shareholder Returns — ROE 10%+, DOE ~5%, ¥100bn Buyback](https://japan-equity.com/wp-content/uploads/2026/07/p27_sq-1024x1024.jpg)
![[Obayashi] Reducing Cross-Shareholdings — ¥285.2bn Sold in Five Years](https://japan-equity.com/wp-content/uploads/2026/07/p29_sq-1024x1024.jpg)
![[Obayashi] ¥750bn Investment Plan — ¥300bn to Development, ¥190bn to Tech/DX](https://japan-equity.com/wp-content/uploads/2026/07/p30_sq-1024x1024.jpg)
![[Obayashi] MTP2022 KPIs — Operating Profit ~2x Target, ROE 14.4%](https://japan-equity.com/wp-content/uploads/2026/07/p25_sq-1024x1024.jpg)
![[Obayashi] Cash Allocation — ¥420bn Investment CF Over Five Years](https://japan-equity.com/wp-content/uploads/2026/07/p26_sq-1024x1024.jpg)
![[Obayashi] Green Energy — 44 Plants, 344MW, and the Green Hydrogen Challenge](https://japan-equity.com/wp-content/uploads/2026/07/p21_sq-1024x1024.jpg)
![[Obayashi] Tackling the Labor Shortage — Robotics Construction®](https://japan-equity.com/wp-content/uploads/2026/07/p14_sq-1024x1024.jpg)
