
This article is based on publicly available IR materials and is not a recommendation to buy or sell any specific securities.
Note: Yoshinoya Holdings has a February fiscal year-end. The materials label the completed fiscal year (ended February 2026) as “FY2025” and the current fiscal year (ending February 2027) as “FY2026”; the tables in the materials are headed “FY ended Feb 2026” and “FY ended Feb 2027 Forecast”. Labels below follow the materials.
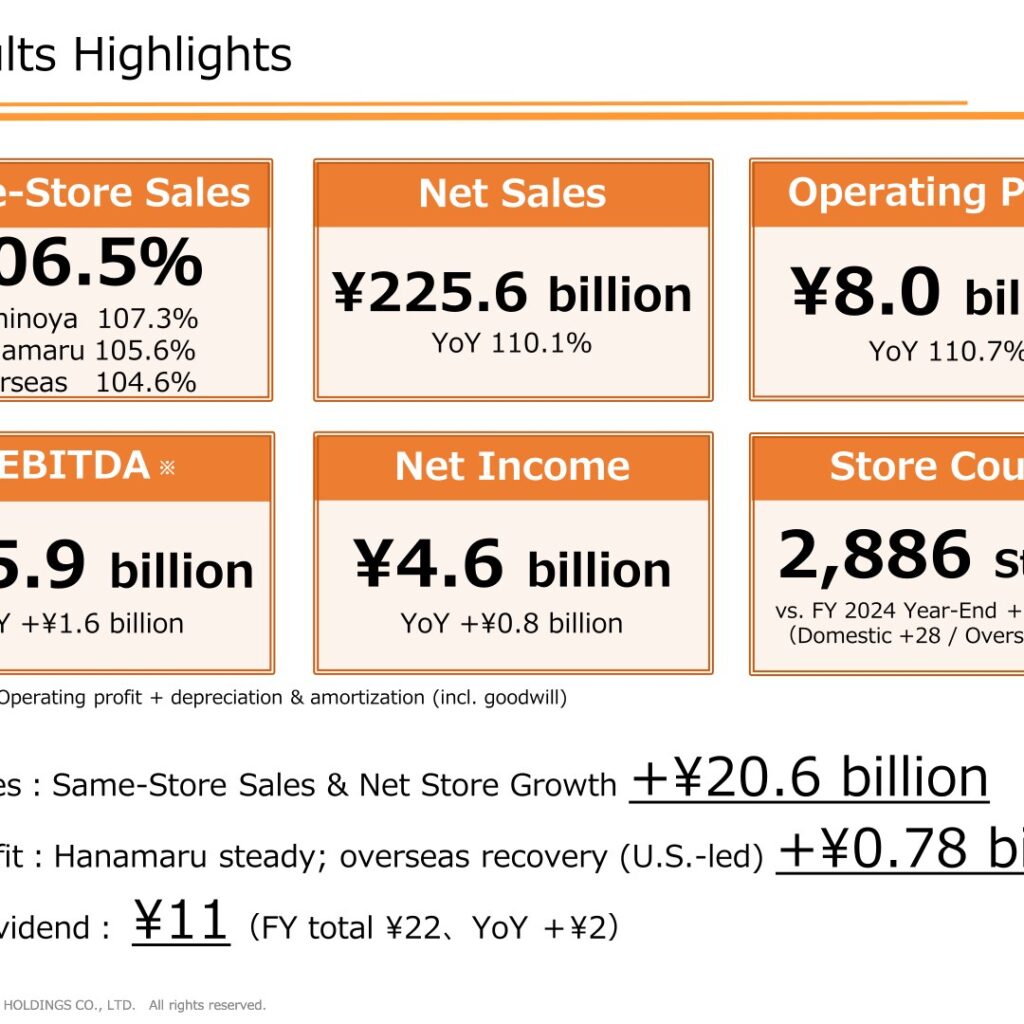
Yoshinoya Holdings reported net sales of ¥225,667 million for the fiscal year ended February 2026, up ¥20,684 million or 110.1% year on year, which the company describes as a record high driven by same-store sales growth and net store additions. Operating profit rose ¥782 million to ¥8,089 million (110.7%) and net income attributable to owners of parent rose ¥861 million to ¥4,665 million (122.7%). Group same-store sales came in at 106.5% of the prior year, and the store count reached 2,886, up 65 from the previous fiscal year-end. The final dividend was set at ¥11, bringing the full-year dividend to ¥22, an increase of ¥2 year on year.
Consolidated Results (Full-Year Actual)
The company summarizes the year as “Revenue & profit growth despite cost pressure” and “Revenue in line with guidance, while OP slightly below on higher COGS.” The cost of goods sold ratio rose to 38.0% from 36.0%, while the SG&A ratio fell to 58.4% from 60.4%. Net income was helped by store exit compensation of +¥464 million and foreign exchange gains of +¥406 million, and EBITDA rose ¥1,646 million on higher operating profit and increased depreciation (+¥863 million). EBITDA is defined in the materials as operating profit plus depreciation and amortization (including goodwill).
| Item (million yen) | FY ended Feb 2026 (Actual) | FY ended Feb 2025 (Actual) | YoY Change | YoY Growth |
|---|---|---|---|---|
| Net Sales | 225,667 | 204,983 | +20,684 | 110.1% |
| COGS | 85,687 | 73,832 | +11,855 | 116.1% |
| Gross Profit | 139,980 | 131,150 | +8,829 | 106.7% |
| SG&A Expenses | 131,890 | 123,844 | +8,046 | 106.5% |
| Operating Profit | 8,089 | 7,306 | +782 | 110.7% |
| Ordinary Profit | 8,803 | 7,995 | +808 | 110.1% |
| Net Income (attributable to owners of parent) | 4,665 | 3,803 | +861 | 122.7% |
| EBITDA | 15,906 | 14,259 | +1,646 | 111.5% |
Against the company’s own forecast for the year, net sales of ¥225,667 million exceeded the ¥225,000 million plan by ¥667 million (100.3%), while operating profit of ¥8,089 million was ¥110 million short of the ¥8,200 million plan (98.6%). Ordinary profit beat its ¥8,700 million plan by ¥103 million (101.2%), net income was ¥134 million below the ¥4,800 million plan (97.2%), and EBITDA was ¥93 million below the ¥16,000 million plan (99.4%).
Same-Store Sales
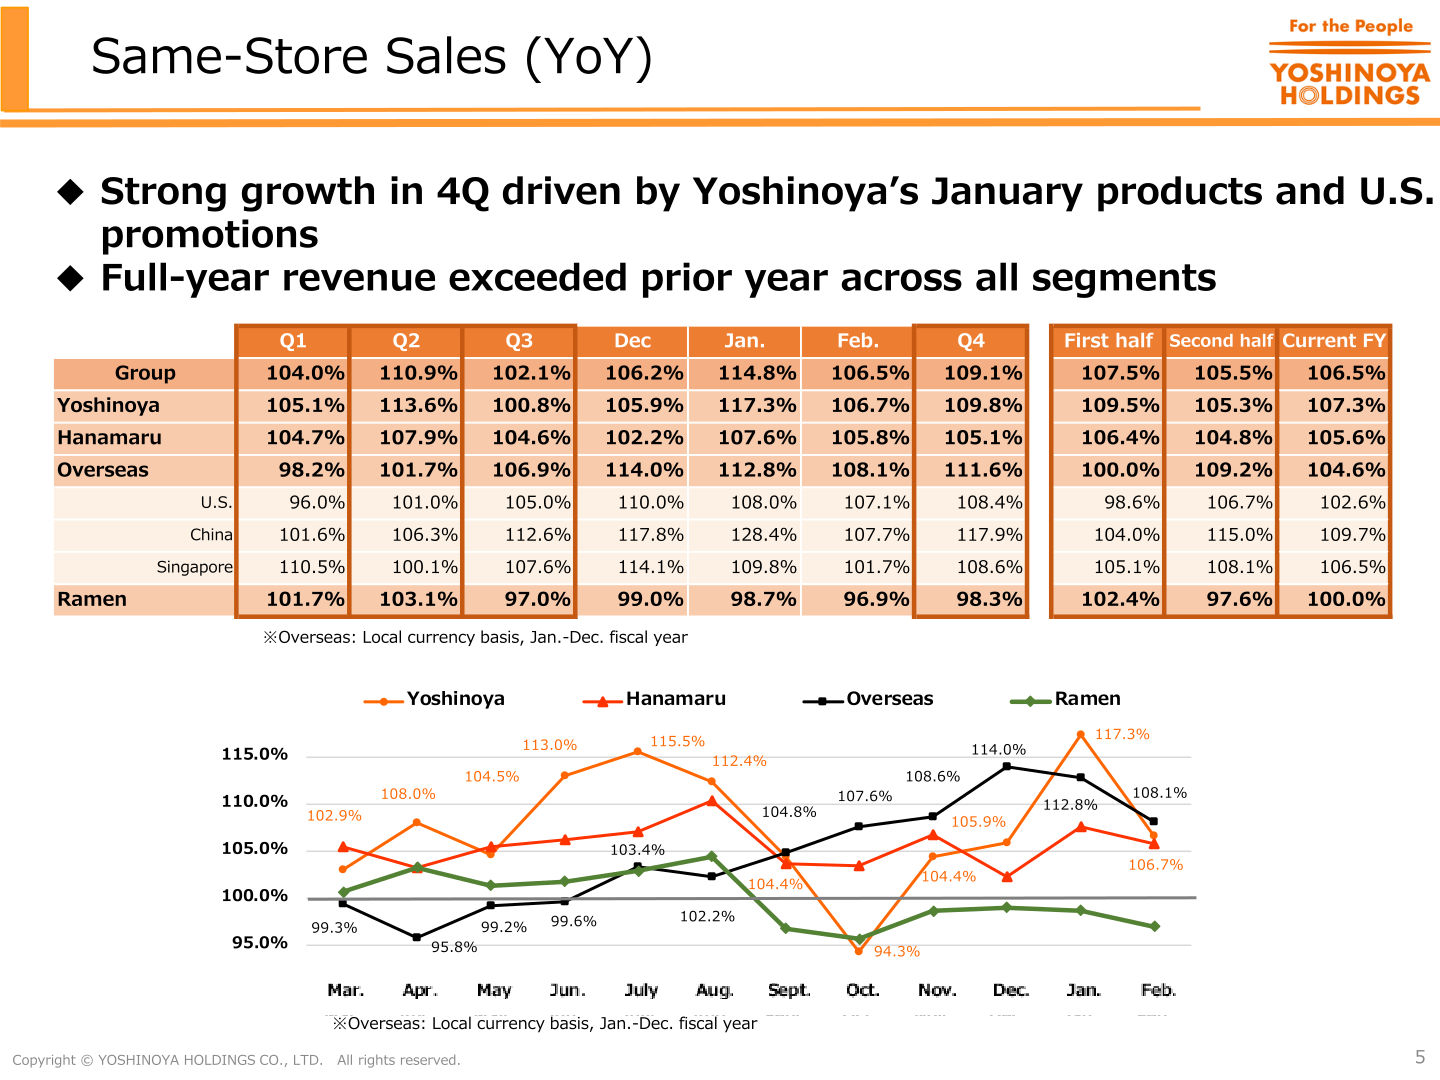
Full-year same-store sales exceeded the prior year across all segments, with fourth-quarter strength attributed to Yoshinoya’s January products and U.S. promotions. Overseas figures are on a local currency basis with a January-December fiscal year. Yoshinoya has now achieved year-on-year same-store sales growth for 19 consecutive quarters since FY2021 Q2, and Hanamaru for 17 consecutive quarters since FY2021 Q4.
| Same-Store Sales (YoY) | First half | Second half | Current FY |
|---|---|---|---|
| Group | 107.5% | 105.5% | 106.5% |
| Yoshinoya | 109.5% | 105.3% | 107.3% |
| Hanamaru | 106.4% | 104.8% | 105.6% |
| Overseas | 100.0% | 109.2% | 104.6% |
| U.S. | 98.6% | 106.7% | 102.6% |
| China | 104.0% | 115.0% | 109.7% |
| Singapore | 105.1% | 108.1% | 106.5% |
| Ramen | 102.4% | 97.6% | 100.0% |
Segment Results
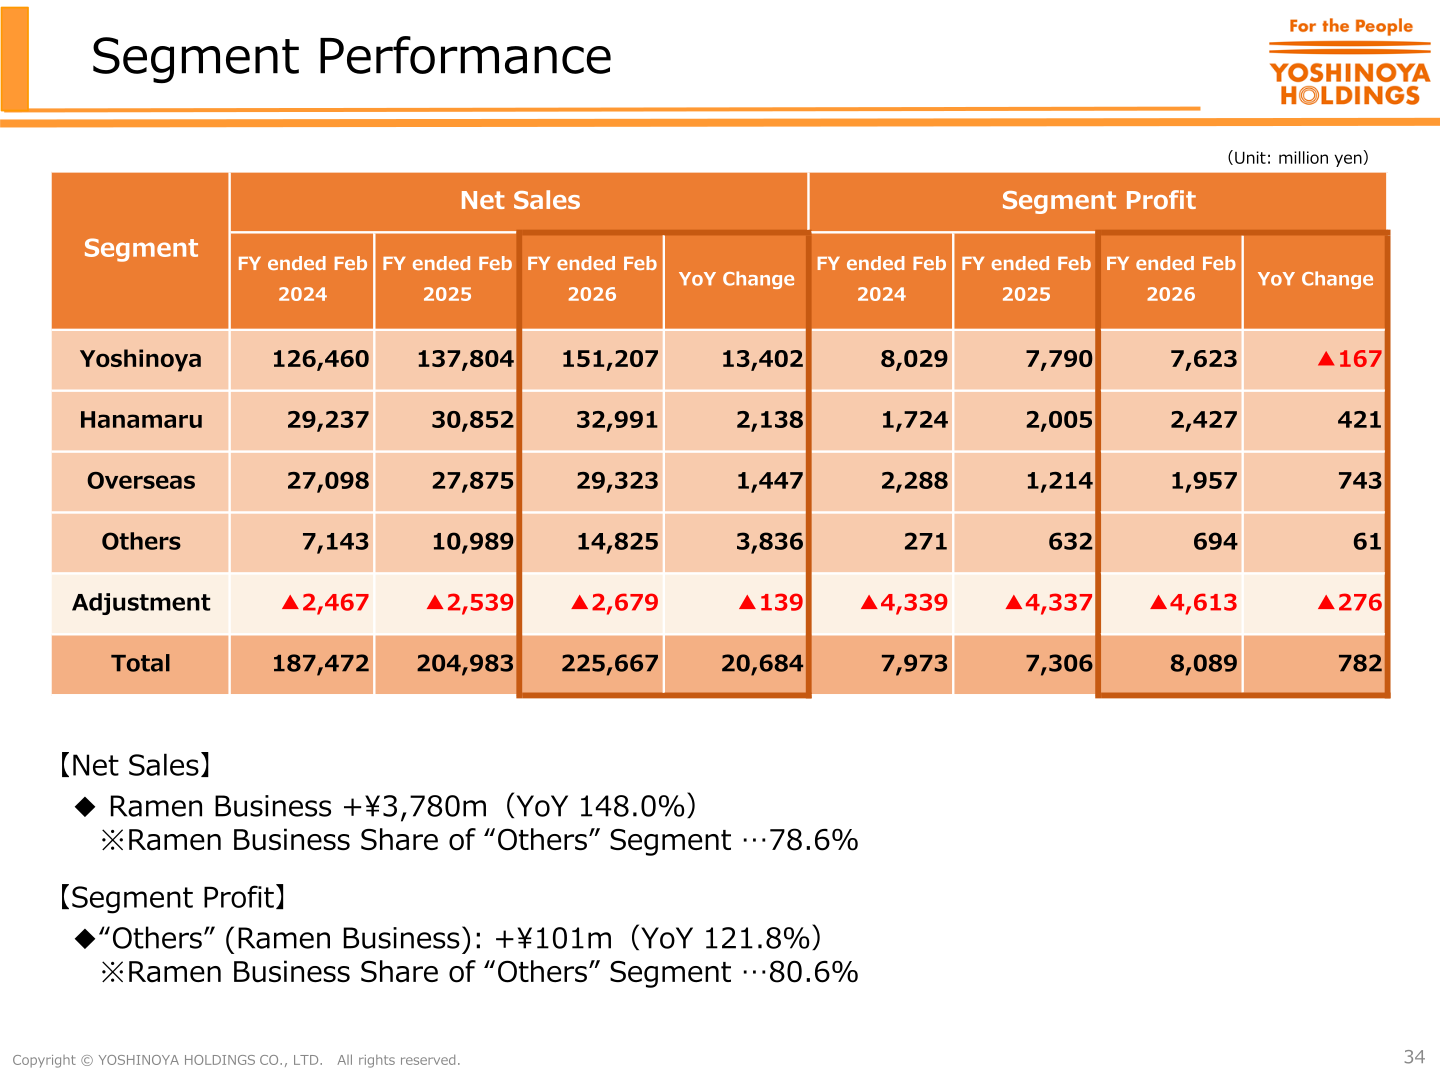
All segments grew net sales on same-store sales growth and net store additions. Yoshinoya posted a slight profit decline on rising raw material costs, Hanamaru recorded record-high profits, and Overseas delivered significant profit growth driven by the U.S. recovery and strong growth in China. Within the “Others” segment, the ramen business added ¥3,780 million of net sales (YoY 148.0%) and ¥101 million of profit (YoY 121.8%); the materials note that the ramen business accounts for 78.6% of “Others” net sales and 80.6% of “Others” segment profit.
| Segment (million yen) | Net Sales FY ended Feb 2026 | Net Sales FY ended Feb 2025 | Net Sales YoY Change | Segment Profit FY ended Feb 2026 | Segment Profit FY ended Feb 2025 | Segment Profit YoY Change |
|---|---|---|---|---|---|---|
| Yoshinoya | 151,207 | 137,804 | 13,402 | 7,623 | 7,790 | ▲167 |
| Hanamaru | 32,991 | 30,852 | 2,138 | 2,427 | 2,005 | 421 |
| Overseas | 29,323 | 27,875 | 1,447 | 1,957 | 1,214 | 743 |
| Others | 14,825 | 10,989 | 3,836 | 694 | 632 | 61 |
| Adjustment | ▲2,679 | ▲2,539 | ▲139 | ▲4,613 | ▲4,337 | ▲276 |
| Total | 225,667 | 204,983 | 20,684 | 8,089 | 7,306 | 782 |
Store Network, CapEx and Financial Position
The group opened 189 stores and closed 124 during the year, ending at 2,886 stores group-wide, up 65 from 2,821 at the previous fiscal year-end (domestic +28, overseas +37). By segment, Yoshinoya ended at 1,290 stores (+31), of which the New Service Model reached 590 stores; Hanamaru at 418 (+3); Overseas at 1,035 (+37), including 660 in Mainland China and Hong Kong; and Others at 143 (▲6), including 125 ramen stores. Capital expenditure totaled ¥10,942 million, down ¥3,982 million from ¥14,924 million in the prior year and 84.2% of the ¥13,000 million plan.
The balance sheet was described as stable with no significant changes versus the prior year. Total assets were ¥124,824 million (+¥5,711 million) and net assets ¥68,712 million (+¥3,898 million), lifting the equity ratio to 54.5% from 53.9%. The D/E ratio improved to 0.25x from 0.27x and ROIC to 6.7% from 6.3%. Operating cash flow was ¥14,700 million and investing cash flow ▲¥10,097 million, producing free cash flow of ¥4,602 million against ▲¥1,094 million a year earlier; the ending cash balance was ¥20,931 million.
FY2026 Forecast
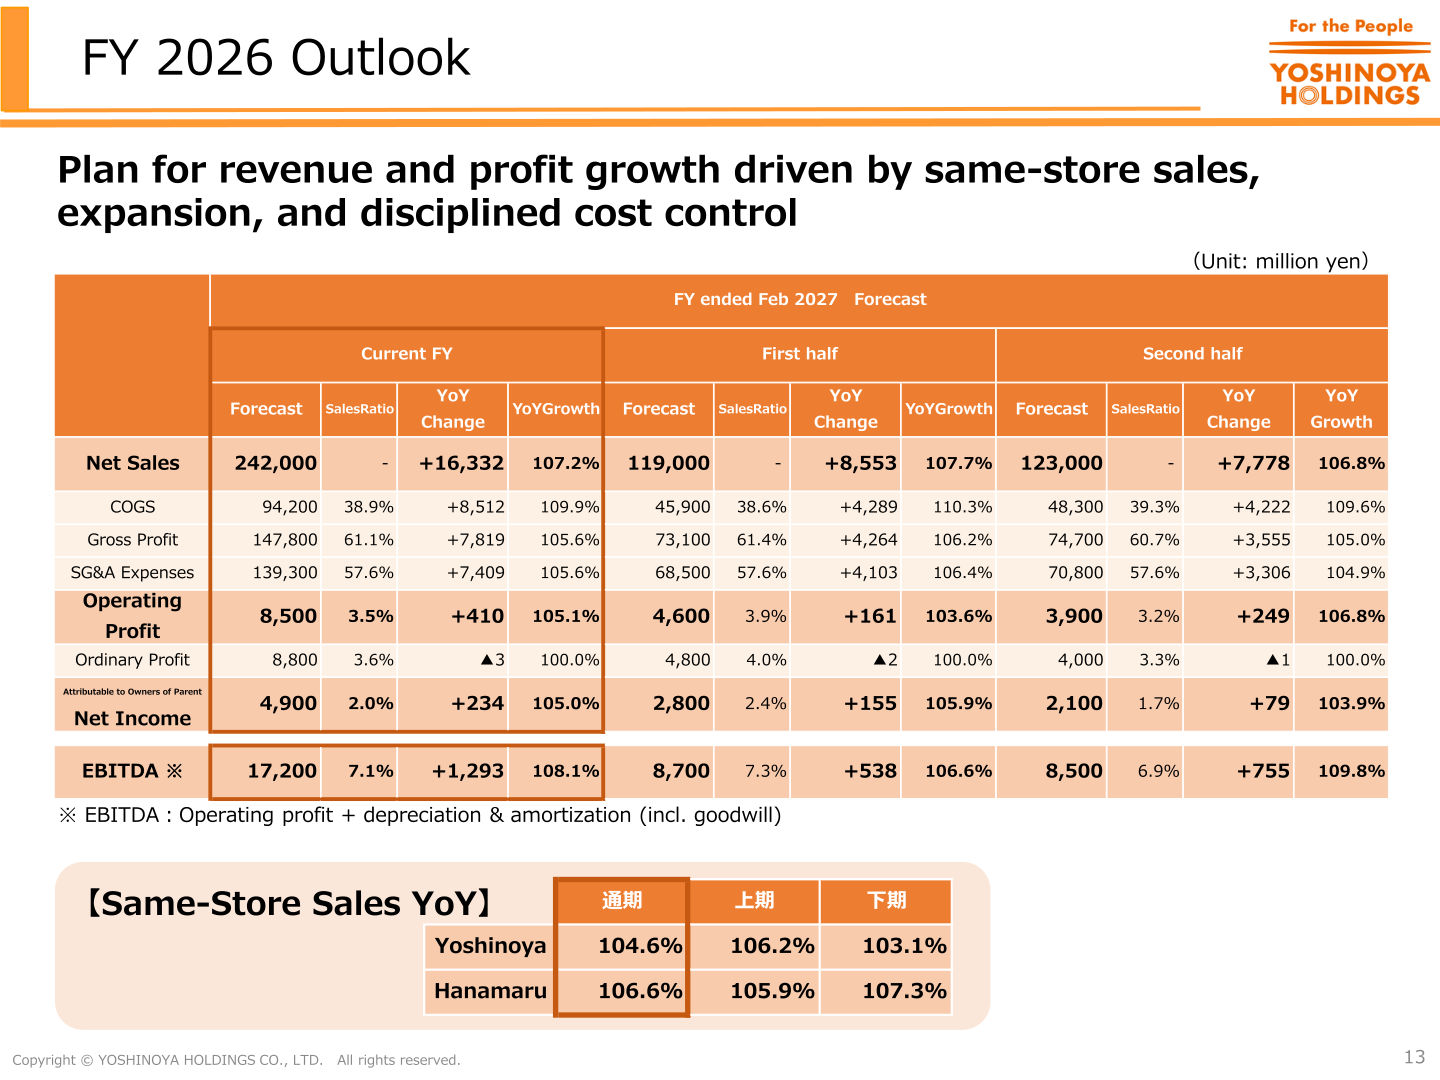
For the fiscal year ending February 2027, the company plans revenue and profit growth driven by same-store sales, store expansion and disciplined cost control. Same-store sales are planned at 104.6% for Yoshinoya (106.2% first half / 103.1% second half) and 106.6% for Hanamaru (105.9% / 107.3%). The store network is planned to reach 2,952 stores group-wide, up 66, with 159 openings and 93 closures, and capital expenditure is planned at ¥15,249 million.
| Item (million yen) | FY ended Feb 2027 Forecast | YoY Change | YoY Growth |
|---|---|---|---|
| Net Sales | 242,000 | +16,332 | 107.2% |
| COGS | 94,200 | +8,512 | 109.9% |
| Gross Profit | 147,800 | +7,819 | 105.6% |
| SG&A Expenses | 139,300 | +7,409 | 105.6% |
| Operating Profit | 8,500 | +410 | 105.1% |
| Ordinary Profit | 8,800 | ▲3 | 100.0% |
| Net Income (attributable to owners of parent) | 4,900 | +234 | 105.0% |
| EBITDA | 17,200 | +1,293 | 108.1% |
Shareholder Returns
The final dividend was set at ¥11 per share, bringing the full-year dividend to ¥22, an increase of ¥2 year on year. Dividends paid during the year amounted to ¥1,355 million, compared with ¥1,289 million in the prior year. A dividend forecast for the fiscal year ending February 2027 and any share buyback plans cannot be confirmed from the materials.
Medium-Term Plan
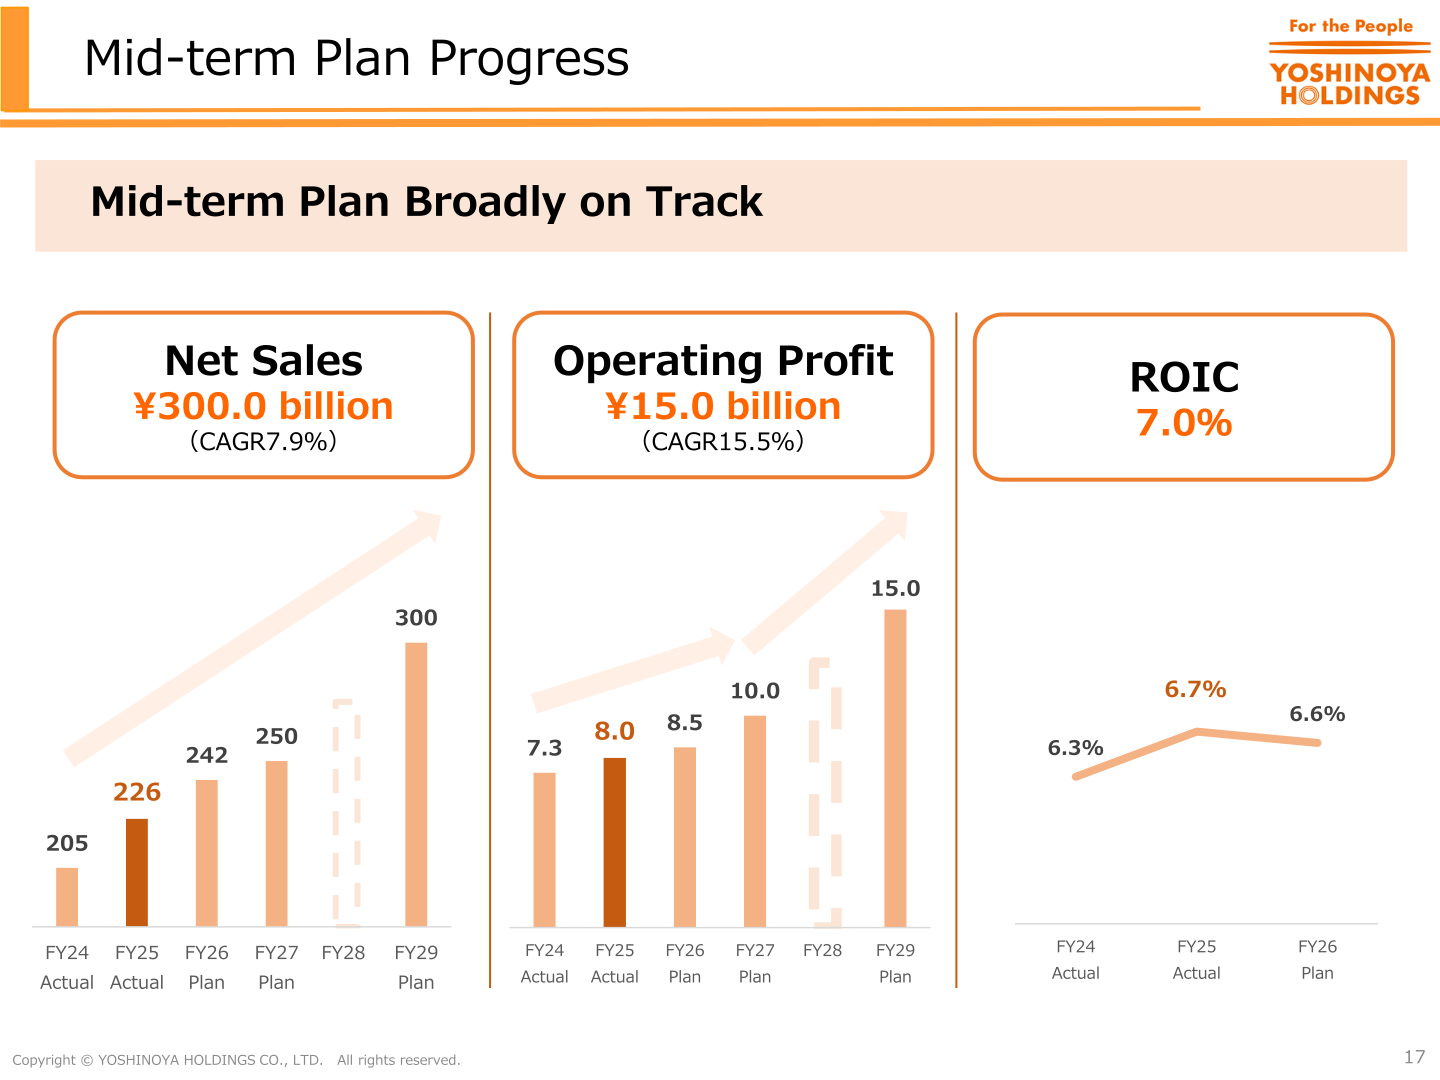
The 2025-2029 medium-term plan is built around “Transformation” and “Growth” under the strategy direction “Transform to Compete, Grow to Lead,” with three strategic pillars: Domestic (Renew the Core), Ramen (Establish New Pillar) and Overseas (Reach New Markets). The financial target for FY2029 is a ROIC of 7.0% and a D/E ratio of 0.9x. The company states the plan is broadly on track, targeting net sales of ¥300.0 billion (CAGR 7.9%) and operating profit of ¥15.0 billion (CAGR 15.5%) by FY2029. The progress chart shows net sales of 205 in FY24 actual, 226 in FY25 actual, 242 in the FY26 plan, 250 in the FY27 plan and 300 in the FY29 plan, and operating profit of 7.3, 8.0, 8.5, 10.0 and 15.0 over the same years (billions of yen). ROIC was 6.3% in FY24 actual, 6.7% in FY25 actual and is planned at 6.6% in FY26.
Key Initiatives and FY2026 Business Strategy
FY2025 initiatives included the rollout of the New Service Model to 590 Yoshinoya stores, in-store tablet deployment at 897 stores, the launch of the Thick-cut Braised Pork Set Meal and the Beef & Egg Stamina Mazesoba, halal compliance in Singapore, an app-based membership system in China, and the first overseas store for Kirameki no Tori in Shanghai. The group also unified six Yoshinoya operating entities into one and consolidated Yoshinoya and Hanamaru marketing functions under a Group Marketing Headquarters. For FY2026 the company plans to focus on gyudon as the core product under a “Perfect Pairing with Rice” strategy, continue the New Service Model rollout and full tablet deployment, expand the new urban store model “Zuzuzu,” grow overseas with local partners following the start of U.S. commissary operations, and expand Takarasangyo’s manufacturing and logistics network from two to five hubs.
This article is an analysis based on publicly available information and is not a recommendation to buy or sell any specific securities. Investment decisions are your own responsibility.
![[Obayashi] Investors’ Guide 2026 — The Complete 24-Article Breakdown](https://japan-equity.com/wp-content/uploads/2026/07/hub_cover-1024x1024.png)
![[Obayashi] IR & SR Policy — Feeding Dialogue Back into Management](https://japan-equity.com/wp-content/uploads/2026/07/p32_sq-1024x1024.jpg)
![[Obayashi] Real Estate Development — 18.7% Margin, ¥287.7bn Unrealized Gains](https://japan-equity.com/wp-content/uploads/2026/07/p20_sq-1024x1024.jpg)
![[Obayashi] Domestic Civil Engineering — Resilience Spending Supports 9.6% Margin](https://japan-equity.com/wp-content/uploads/2026/07/p11_sq-1024x1024.jpg)
![[Obayashi] Share Price & External Ratings — vs TOPIX, ESG Index Inclusion](https://japan-equity.com/wp-content/uploads/2026/07/p40_sq-1024x1024.jpg)
![[Construction] ¥75.5tn Investment, Shrinking Workforce — Big-5 Market Share](https://japan-equity.com/wp-content/uploads/2026/07/p12_sq-1024x1024.jpg)



![[Obayashi] Capital Policy & Shareholder Returns — ROE 10%+, DOE ~5%, ¥100bn Buyback](https://japan-equity.com/wp-content/uploads/2026/07/p27_sq-1024x1024.jpg)
![[Obayashi] Reducing Cross-Shareholdings — ¥285.2bn Sold in Five Years](https://japan-equity.com/wp-content/uploads/2026/07/p29_sq-1024x1024.jpg)
![[Obayashi] ¥750bn Investment Plan — ¥300bn to Development, ¥190bn to Tech/DX](https://japan-equity.com/wp-content/uploads/2026/07/p30_sq-1024x1024.jpg)
![[Obayashi] MTP2022 KPIs — Operating Profit ~2x Target, ROE 14.4%](https://japan-equity.com/wp-content/uploads/2026/07/p25_sq-1024x1024.jpg)
![[Obayashi] Cash Allocation — ¥420bn Investment CF Over Five Years](https://japan-equity.com/wp-content/uploads/2026/07/p26_sq-1024x1024.jpg)
![[Obayashi] Green Energy — 44 Plants, 344MW, and the Green Hydrogen Challenge](https://japan-equity.com/wp-content/uploads/2026/07/p21_sq-1024x1024.jpg)
![[Obayashi] Tackling the Labor Shortage — Robotics Construction®](https://japan-equity.com/wp-content/uploads/2026/07/p14_sq-1024x1024.jpg)
