
This article is based on publicly available IR materials and is not a recommendation to buy or sell any specific securities.
Note: AIN HOLDINGS closes its fiscal year at the end of April. The company labels its most recent completed fiscal year, ended April 2026, as “FY2026”; this article follows our site-wide convention of “FY2025” in the title and URL only, and keeps the company’s own year labels in all text, tables and segment data below.
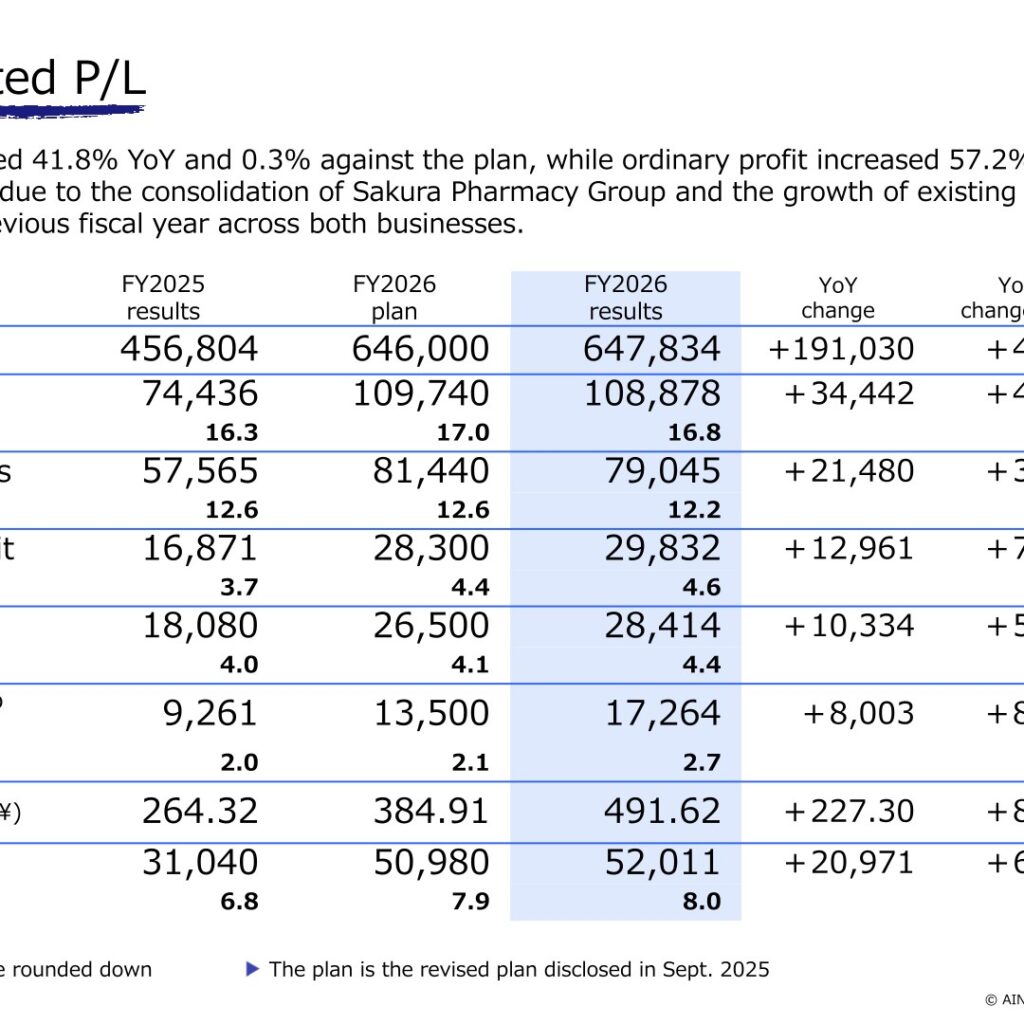
AIN HOLDINGS INC. released its FY2026 IR Presentation on June 17, 2026, covering the fiscal year ended April 2026. Net sales rose 41.8% year on year to ¥647,834 million and ordinary profit rose 57.2% to ¥28,414 million, with the company attributing the growth to the consolidation of Sakura Pharmacy Group and to the growth of existing stores and stores opened in the previous fiscal year across both businesses. Profit attributable to owners of parent increased 86.4% to ¥17,264 million, exceeding the revised plan disclosed in September 2025 by 27.9%. For FY2027 the group plans net sales of ¥721,500 million (+11.4% YoY) and ordinary profit of ¥30,000 million (+5.6% YoY).
Consolidated Results (Full-Year Actual)
Net sales increased 41.8% YoY and 0.3% against the plan, while ordinary profit increased 57.2% YoY and 7.2% against the plan. Operating profit rose 76.8% YoY to ¥29,832 million, a 5.4% beat versus plan, and the operating margin improved to 4.6% of net sales from 3.7%. EBITDA reached ¥52,011 million (8.0% of net sales) and earnings per share rose ¥227.30 to ¥491.62. The “plan” column is the revised plan disclosed in September 2025; figures in the table are rounded down.
| (¥ million) | FY2025 results | FY2026 plan | FY2026 results | YoY change(%) | Vs plan (%) |
|---|---|---|---|---|---|
| Net sales | 456,804 | 646,000 | 647,834 | +41.8 | +0.3 |
| Gross profit | 74,436 | 109,740 | 108,878 | +46.3 | (0.8) |
| SG&A expenses | 57,565 | 81,440 | 79,045 | +37.3 | (2.9) |
| Operating profit | 16,871 | 28,300 | 29,832 | +76.8 | +5.4 |
| Ordinary profit | 18,080 | 26,500 | 28,414 | +57.2 | +7.2 |
| Profit attributable to owners of parent | 9,261 | 13,500 | 17,264 | +86.4 | +27.9 |
| Earnings per share (¥) | 264.32 | 384.91 | 491.62 | +86.0 | +27.7 |
| EBITDA | 31,040 | 50,980 | 52,011 | +67.6 | +2.0 |
Segment Results
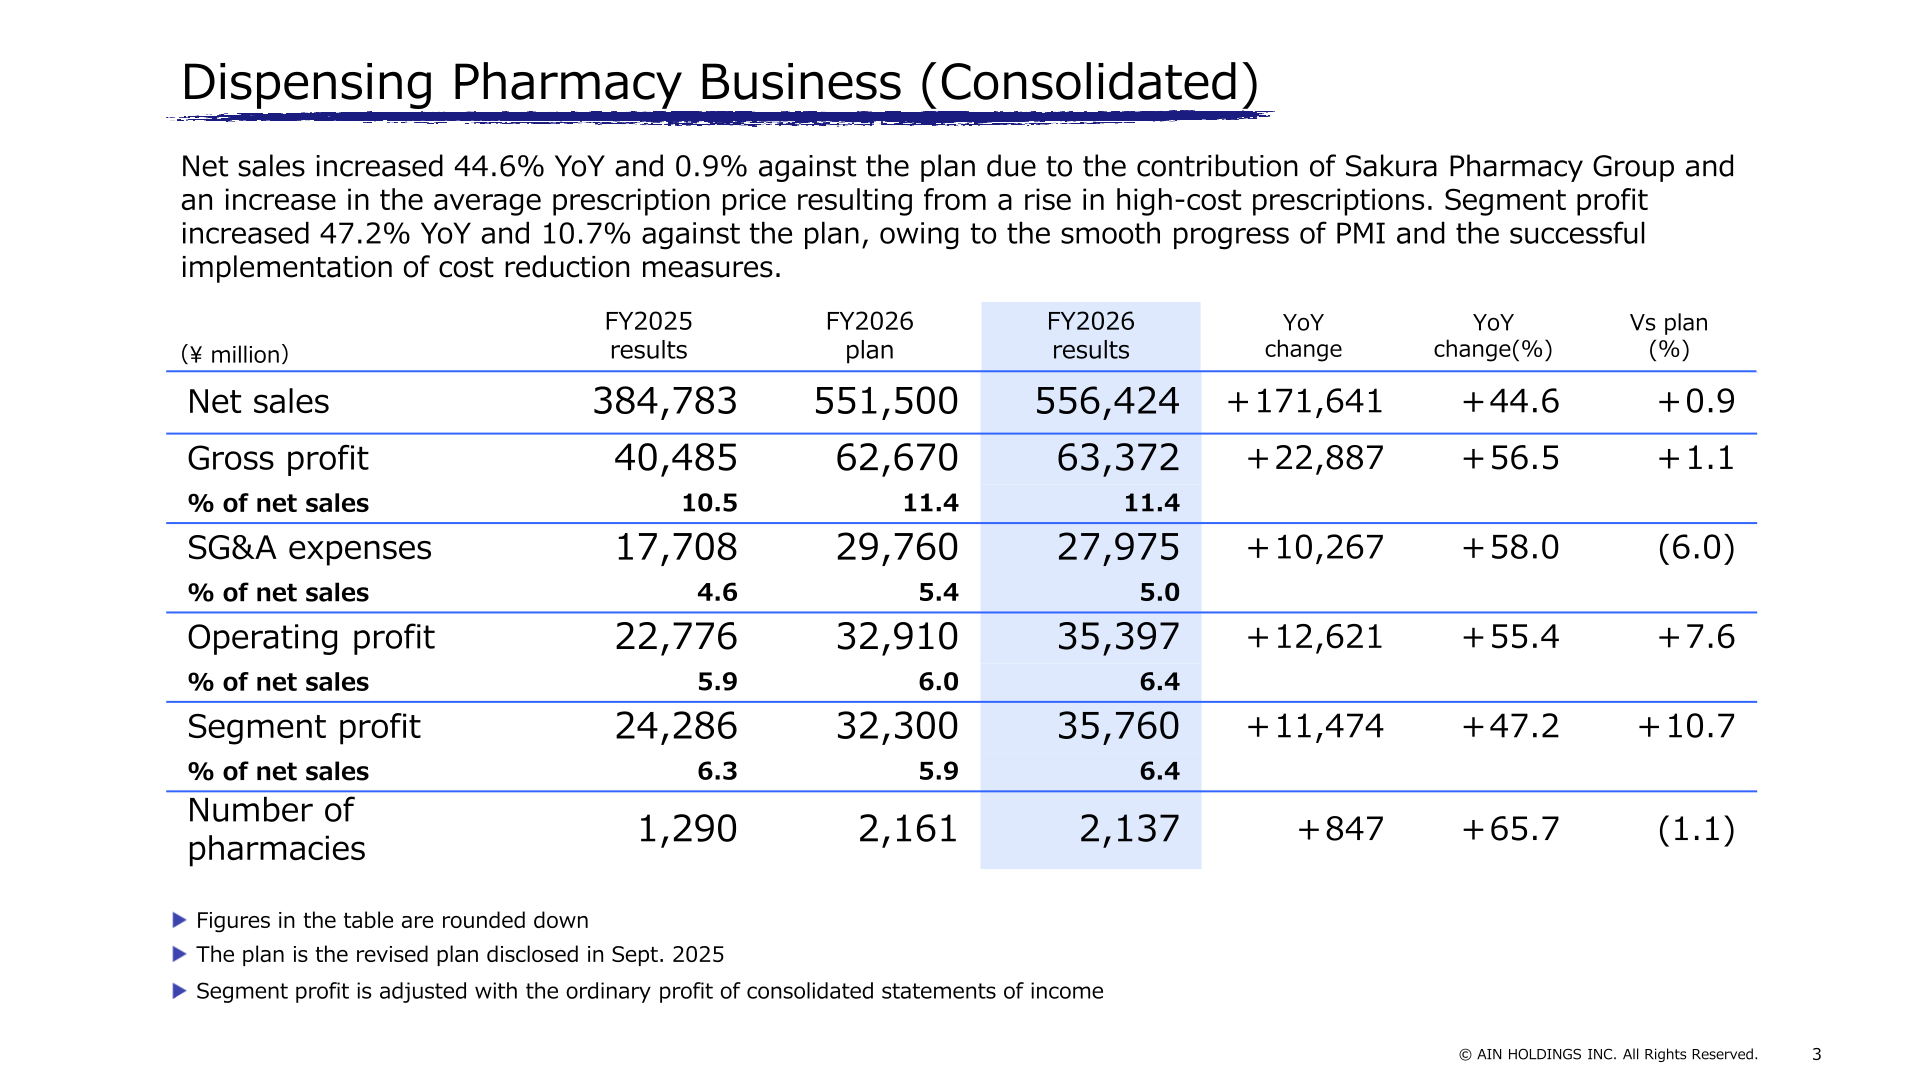
In the Dispensing Pharmacy Business, net sales increased 44.6% YoY and 0.9% against the plan due to the contribution of Sakura Pharmacy Group and an increase in the average prescription price resulting from a rise in high-cost prescriptions. Segment profit increased 47.2% YoY and 10.7% against the plan, owing to the smooth progress of PMI and the successful implementation of cost reduction measures. In the Retail Business, Francfranc contributed fully and the average spending per customer in AINZ & TULPE and Francfranc remained firm, so net sales rose 31.5% YoY (down 3.4% against the plan) and segment profit rose 35.9% YoY (down 13.0% against the plan) as the planned targets for the number of customers were not met. Segment profit is adjusted with the ordinary profit of consolidated statements of income; pharmacy and store counts are unit numbers, not yen amounts.
| Segment | Item (¥ million unless noted) | FY2025 results | FY2026 results | YoY change(%) |
|---|---|---|---|---|
| Dispensing Pharmacy Business | Net sales | 384,783 | 556,424 | +44.6 |
| Dispensing Pharmacy Business | Gross profit | 40,485 | 63,372 | +56.5 |
| Dispensing Pharmacy Business | Operating profit | 22,776 | 35,397 | +55.4 |
| Dispensing Pharmacy Business | Segment profit | 24,286 | 35,760 | +47.2 |
| Dispensing Pharmacy Business | Number of pharmacies (stores) | 1,290 | 2,137 | +65.7 |
| Retail Business | Net sales | 61,041 | 80,255 | +31.5 |
| Retail Business | Gross profit | 30,030 | 41,235 | +37.3 |
| Retail Business | Operating profit | 4,782 | 6,443 | +34.7 |
| Retail Business | Segment profit | 4,804 | 6,528 | +35.9 |
| Retail Business | Number of stores | 260 | 269 | +3.5 |
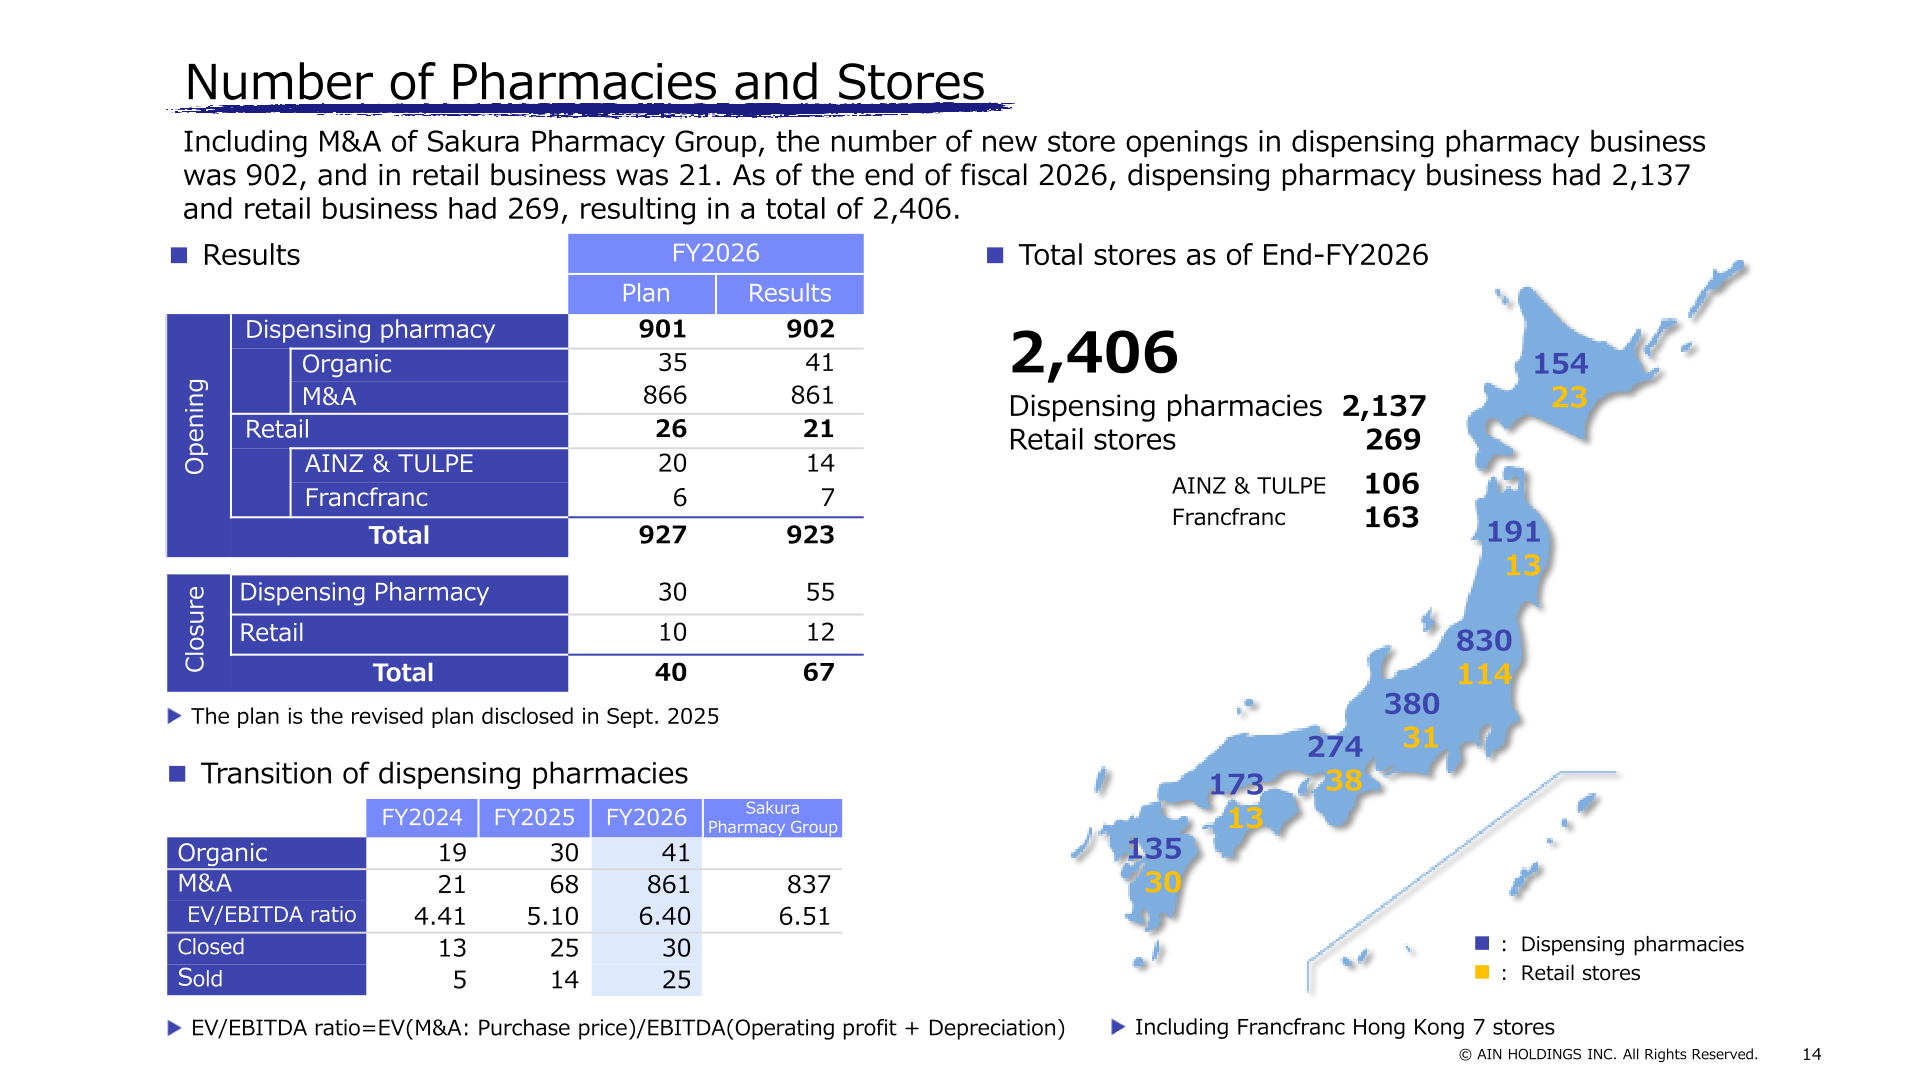
Including the M&A of Sakura Pharmacy Group, the number of new store openings in the dispensing pharmacy business was 902 (41 organic and 861 through M&A) and in the retail business was 21 (14 AINZ & TULPE and 7 Francfranc), against closures of 55 and 12 respectively. As of the end of fiscal 2026 the dispensing pharmacy business had 2,137 pharmacies and the retail business had 269 stores (AINZ & TULPE 106 and Francfranc 163, including 7 Francfranc Hong Kong stores), for a total of 2,406. Of the 861 pharmacies added through M&A, 837 came from Sakura Pharmacy Group, at an EV/EBITDA ratio of 6.51 times against 6.40 times for FY2026 M&A overall.
Financial Position and Cash Flow
Total assets increased ¥197,726 million from the end of fiscal year 2025 to ¥509,647 million, mainly reflecting an increase in goodwill to ¥194,182 million (+¥109,410 million) due to the consolidation of Sakura Pharmacy Group. Accounts payable – trade increased ¥32,979 million and short-term and long-term borrowings increased on funds procured for the share acquisition, with long-term borrowings at ¥151,106 million (+¥124,637 million). The shareholders’ equity ratio was 31.2% versus 45.7% a year earlier, and net cash was ¥(120,928) million. Net cash provided by operating activities was ¥30,872 million, net cash used in investing activities was ¥(60,605) million including ¥(45,870) million for purchases of shares of subsidiaries resulting in change in scope of consolidation, and cash and cash equivalents at the end of the period were ¥50,650 million. Capital expenditures (property, plant and equipment and intangible assets plus leasehold and guarantee deposits) totaled ¥17,255 million. ROE was 11.5% and EPS ¥491.62.
FY2027 Forecast
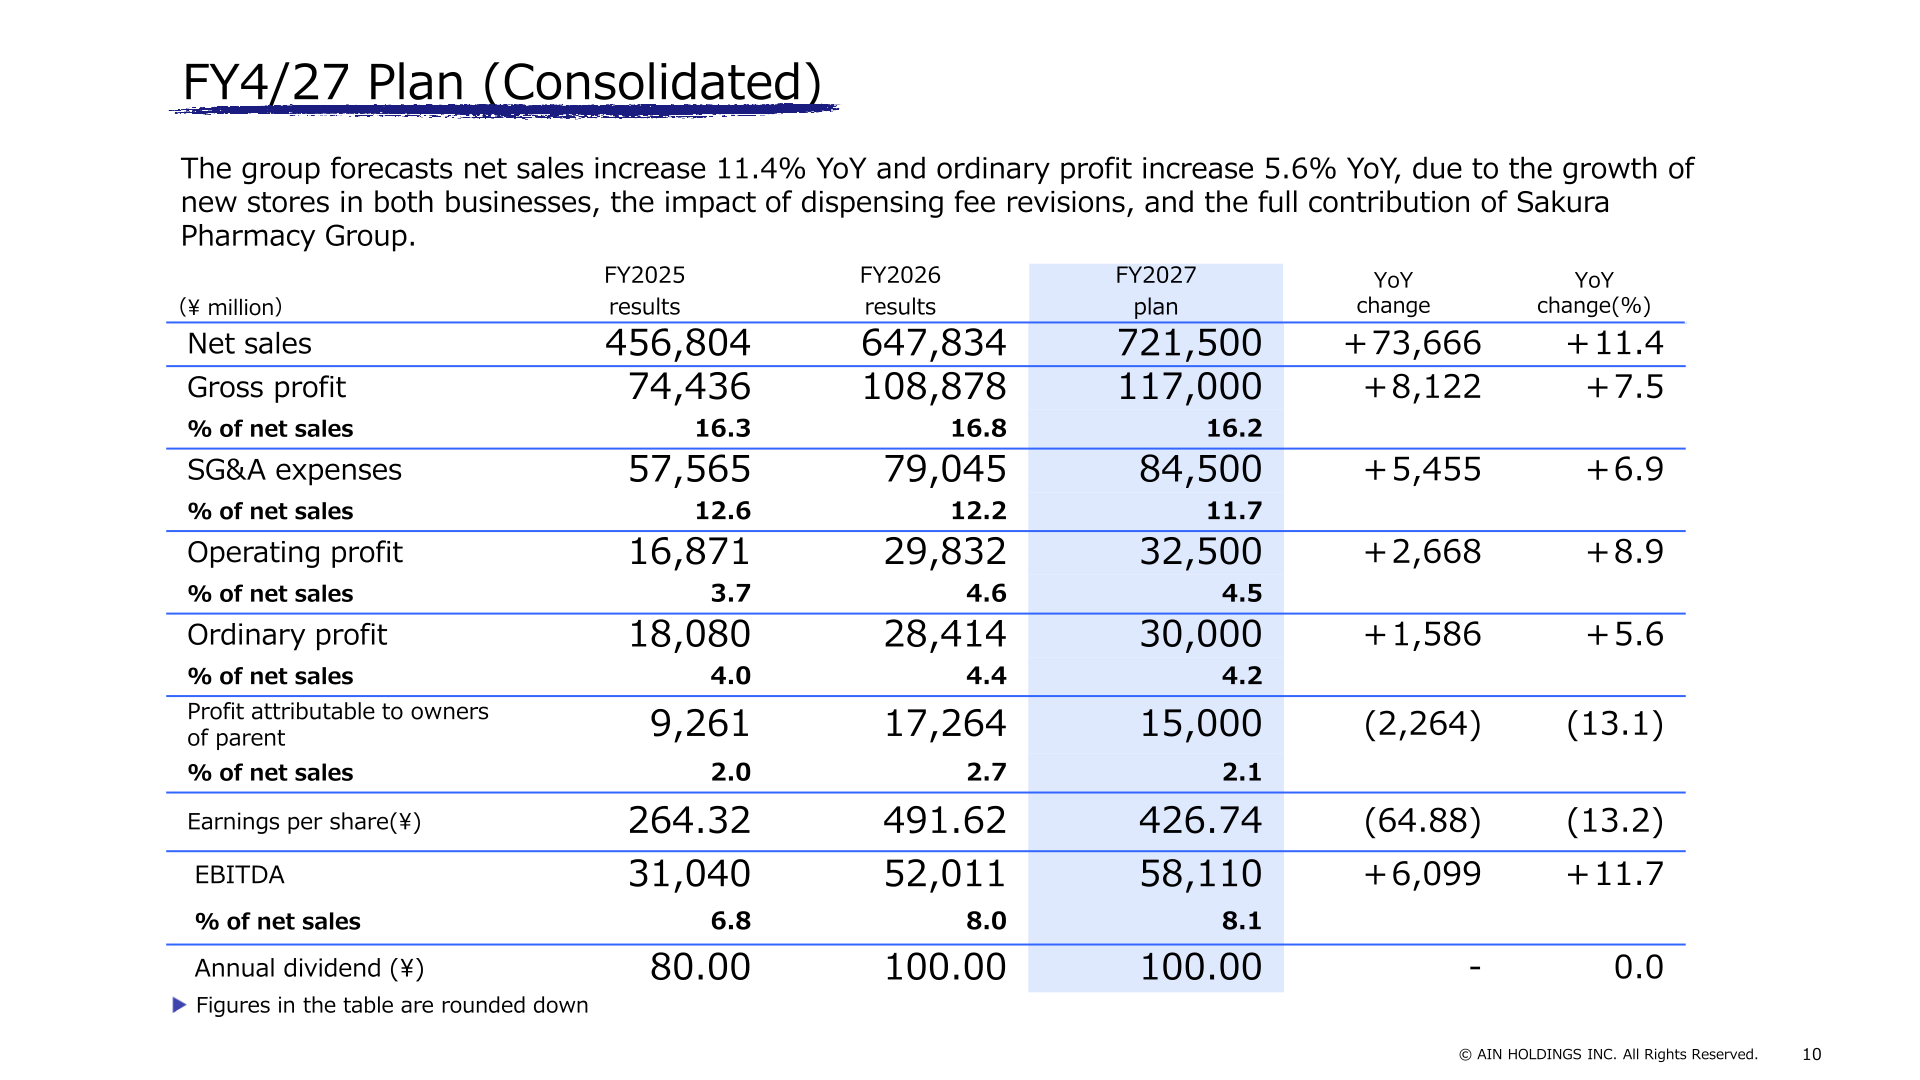
For FY4/27 the group forecasts net sales up 11.4% YoY and ordinary profit up 5.6% YoY, due to the growth of new stores in both businesses, the impact of dispensing fee revisions, and the full contribution of Sakura Pharmacy Group. Profit attributable to owners of parent is planned to decrease 13.1% to ¥15,000 million. By segment, the dispensing pharmacy business plans net sales of ¥621,500 million (+11.7%) with segment profit of ¥35,430 million ((0.9)%) on the impact of dispensing fee revisions, while the retail business plans net sales of ¥88,000 million (+9.7%) and segment profit of ¥7,500 million (+14.9%). The estimated financial impact of the 2026 dispensing fee revision for FY2027 is about ¥(1.5) billion. The group plans to open 104 locations (80 dispensing pharmacies, of which 40 organic and 40 M&A, and 24 retail stores) and close 35, ending the year with 2,187 dispensing pharmacies and 288 retail stores for a total of 2,475.
| (¥ million) | FY2026 results | FY2027 plan | YoY change | YoY change(%) |
|---|---|---|---|---|
| Net sales | 647,834 | 721,500 | +73,666 | +11.4 |
| Gross profit | 108,878 | 117,000 | +8,122 | +7.5 |
| SG&A expenses | 79,045 | 84,500 | +5,455 | +6.9 |
| Operating profit | 29,832 | 32,500 | +2,668 | +8.9 |
| Ordinary profit | 28,414 | 30,000 | +1,586 | +5.6 |
| Profit attributable to owners of parent | 17,264 | 15,000 | (2,264) | (13.1) |
| Earnings per share (¥) | 491.62 | 426.74 | (64.88) | (13.2) |
| EBITDA | 52,011 | 58,110 | +6,099 | +11.7 |
| Annual dividend (¥) | 100.00 | 100.00 | – | 0.0 |
Shareholder Returns
The annual dividend for FY2026 was ¥100.00 per share, up from ¥80.00 in FY2025, and the company plans ¥100.00 again for FY2027. AIN HOLDINGS states that it has maintained shareholder returns based on progressive dividends, balancing growth investments and shareholder returns, and that going forward, while continuing to invest toward its medium-to-long-term vision, it will target a dividend payout ratio of 30.0% as its medium-to-long-term approach to shareholder returns. The dividend chart shows payout ratios of 30.3% for FY2025, 20.3% for FY2026 and 23.4% for the FY2027 plan. Within the revised 10-year cumulative cash allocation for FY2025 to FY2034, ¥90.0 billion is allocated to shareholder returns, described as continuation of stable long-term dividends.
| Item | FY2025 results | FY2026 results | FY2027 plan |
|---|---|---|---|
| Annual dividend per share (¥) | 80.00 | 100.00 | 100.00 |
| Dividends payout ratio (%) | 30.3 | 20.3 | 23.4 |
| Medium-to-long-term target: dividends payout ratio (%) | – | – | 30.0 |
Medium- and Long-Term Vision
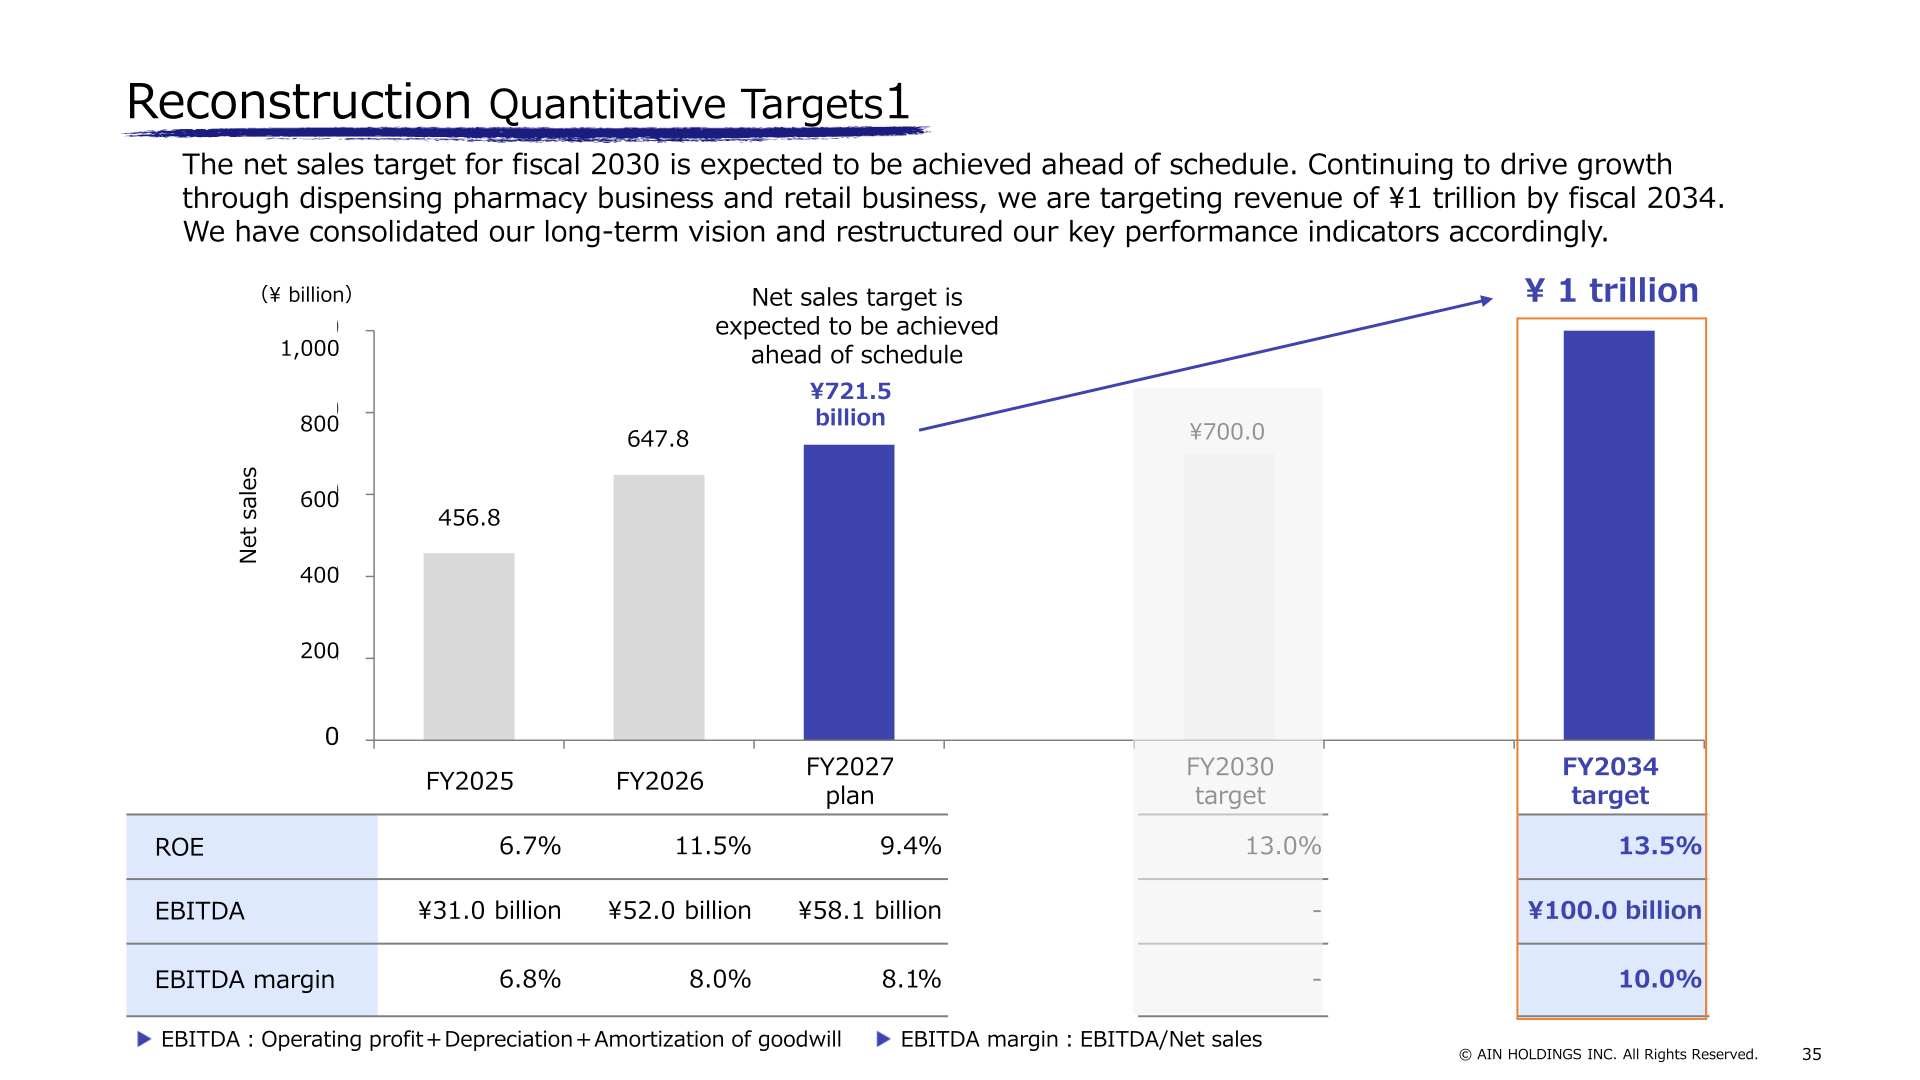
Under “Ambitious Goals 2034,” AIN HOLDINGS describes a decade to promote innovation and strive for its challenging goal of a trillion yen in sales. The company says the net sales target for fiscal 2030 (¥700.0 billion) is expected to be achieved ahead of schedule, and it targets revenue of ¥1 trillion by fiscal 2034, with ROE of 13.5%, EBITDA of ¥100.0 billion and an EBITDA margin of 10.0% at that point, versus ROE of 11.5%, EBITDA of ¥52.0 billion and an EBITDA margin of 8.0% in FY2026 and 9.4%, ¥58.1 billion and 8.1% in the FY2027 plan. The FY2034 sales mix is targeted at ¥850.0 billion (85.0%) for the dispensing pharmacy business and ¥150.0 billion (15.0%) for retail and other businesses. To address the changes in financial structure resulting from the Sakura Pharmacy Group share acquisition, the revised cash allocation for the 10 years from FY2025 to FY2034 totals ¥760.0 billion (operating cash flow ¥530.0 billion and fundraising ¥230.0 billion), allocated to store openings and M&As ¥490.0 billion, DX investment etc. ¥50.0 billion, strengthening of the financial base ¥130.0 billion and shareholder return ¥90.0 billion, with repayment of borrowings from the acquisition and growth investments positioned as top priorities. In the dispensing pharmacy business, the average number of prescriptions processed was 23.1 per person in FY2026, with a plan of 23.5 for FY2027 and a target of 30.0 by fiscal 2034.
This article is an analysis based on publicly available information and is not a recommendation to buy or sell any specific securities. Investment decisions are your own responsibility.
![[Obayashi] Investors’ Guide 2026 — The Complete 24-Article Breakdown](https://japan-equity.com/wp-content/uploads/2026/07/hub_cover-1024x1024.png)
![[Obayashi] IR & SR Policy — Feeding Dialogue Back into Management](https://japan-equity.com/wp-content/uploads/2026/07/p32_sq-1024x1024.jpg)
![[Obayashi] Real Estate Development — 18.7% Margin, ¥287.7bn Unrealized Gains](https://japan-equity.com/wp-content/uploads/2026/07/p20_sq-1024x1024.jpg)
![[Obayashi] Domestic Civil Engineering — Resilience Spending Supports 9.6% Margin](https://japan-equity.com/wp-content/uploads/2026/07/p11_sq-1024x1024.jpg)
![[Obayashi] Share Price & External Ratings — vs TOPIX, ESG Index Inclusion](https://japan-equity.com/wp-content/uploads/2026/07/p40_sq-1024x1024.jpg)
![[Construction] ¥75.5tn Investment, Shrinking Workforce — Big-5 Market Share](https://japan-equity.com/wp-content/uploads/2026/07/p12_sq-1024x1024.jpg)



![[Obayashi] Capital Policy & Shareholder Returns — ROE 10%+, DOE ~5%, ¥100bn Buyback](https://japan-equity.com/wp-content/uploads/2026/07/p27_sq-1024x1024.jpg)
![[Obayashi] Reducing Cross-Shareholdings — ¥285.2bn Sold in Five Years](https://japan-equity.com/wp-content/uploads/2026/07/p29_sq-1024x1024.jpg)
![[Obayashi] ¥750bn Investment Plan — ¥300bn to Development, ¥190bn to Tech/DX](https://japan-equity.com/wp-content/uploads/2026/07/p30_sq-1024x1024.jpg)
![[Obayashi] MTP2022 KPIs — Operating Profit ~2x Target, ROE 14.4%](https://japan-equity.com/wp-content/uploads/2026/07/p25_sq-1024x1024.jpg)
![[Obayashi] Cash Allocation — ¥420bn Investment CF Over Five Years](https://japan-equity.com/wp-content/uploads/2026/07/p26_sq-1024x1024.jpg)
![[Obayashi] Green Energy — 44 Plants, 344MW, and the Green Hydrogen Challenge](https://japan-equity.com/wp-content/uploads/2026/07/p21_sq-1024x1024.jpg)
![[Obayashi] Tackling the Labor Shortage — Robotics Construction®](https://japan-equity.com/wp-content/uploads/2026/07/p14_sq-1024x1024.jpg)
