
This article is based on publicly available IR materials and is not a recommendation to buy or sell any specific securities.
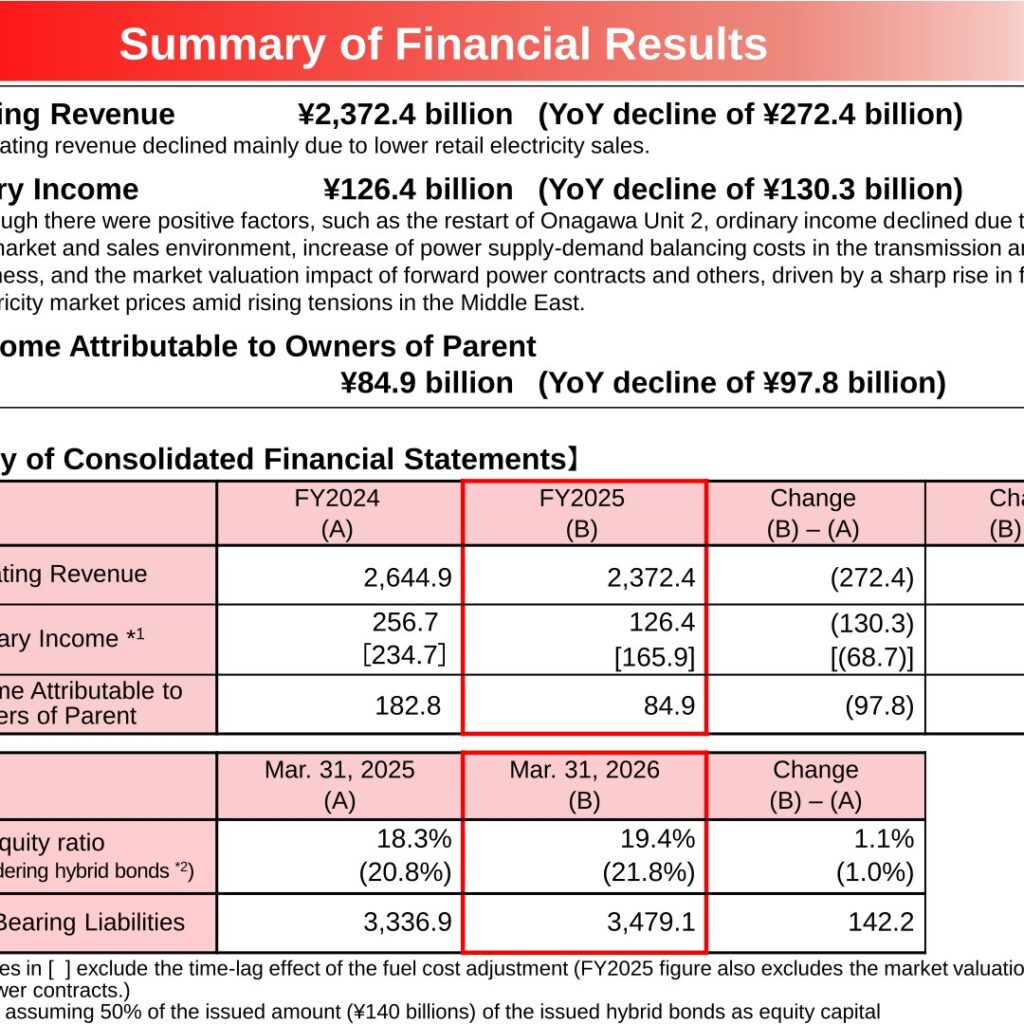
Tohoku Electric Power reported FY2025 (April 1, 2025 – March 31, 2026) operating revenue of ¥2,372.4 billion, a year-on-year decline of ¥272.4 billion, ordinary income of ¥126.4 billion, down ¥130.3 billion, and net income attributable to owners of parent of ¥84.9 billion, down ¥97.8 billion. Excluding the time-lag effect of the fuel cost adjustment and the market valuation impact of forward power contracts, ordinary income was ¥165.9 billion, down ¥68.7 billion year on year. Positive factors such as the restart of Onagawa Unit 2 were outweighed by changes in the market and sales environment, an increase in power supply-demand balancing costs in the transmission and distribution business, and the market valuation impact of forward power contracts and others, driven by a sharp rise in fuel prices and electricity market prices amid rising tensions in the Middle East. For FY2026 the company has left its earnings forecast undetermined, while forecasting an annual dividend of ¥40 per share.
Consolidated Results (Full-Year Actual)
Operating revenue declined mainly due to lower retail electricity sales. Operating income fell to ¥160.3 billion from ¥280.3 billion, and ordinary income fell to ¥126.4 billion from ¥256.7 billion. The company notes that the market valuation impact reported in FY2025 will be reversed as a gain in FY2026, resulting in no impact on earnings on a cumulative two-year basis; ¥56.5 billion is to be recorded in FY2026. Extraordinary losses of ¥7.5 billion were recorded, attributable to loss on valuation of securities.
| Item (¥ billion) | FY2024 (A) | FY2025 (B) | Change (B) – (A) | Change (B) / (A) |
|---|---|---|---|---|
| Operating Revenue | 2,644.9 | 2,372.4 | (272.4) | 89.7 % |
| Electric utility | 2,422.0 | 2,218.4 | (203.6) | 91.6 % |
| Other business | 222.8 | 154.0 | (68.8) | 69.1 % |
| Operating Expenses | 2,364.5 | 2,212.0 | (152.5) | 93.5 % |
| Operating Income | 280.3 | 160.3 | (119.9) | 57.2 % |
| Ordinary Income | 256.7 | 126.4 | (130.3) | 49.2 % |
| Ordinary Income (excluding the time-lag effect of the fuel cost adjustment; FY2025 also excludes the market valuation impact) | [234.7] | [165.9] | [(68.7)] | [70.7 %] |
| Extraordinary Losses | ― | 7.5 | 7.5 | ― |
| Income taxes | 71.9 | 32.8 | (39.0) | 45.7 % |
| Net Income Attributable to Owners of Parent | 182.8 | 84.9 | (97.8) | 46.5 % |
On the balance sheet, total assets stood at ¥5,731.8 billion as of March 31, 2026 (up ¥333.6 billion), net assets at ¥1,135.7 billion (up ¥126.9 billion) and interest-bearing liabilities at ¥3,479.1 billion (up ¥142.2 billion). The equity ratio improved to 19.4% from 18.3%, or 21.8% from 20.8% after considering hybrid bonds (assuming 50% of the issued amount of ¥140 billion as equity capital). Capital expenditure was ¥422.6 billion, up ¥38.7 billion. Cash flows from operating activities were ¥370.1 billion and cash flows from investing activities were ¥(375.6) billion, giving free cash flow of ¥(5.5) billion; cash and cash equivalents at the end of the period were ¥660.5 billion.
Electricity Sales and Major Factors
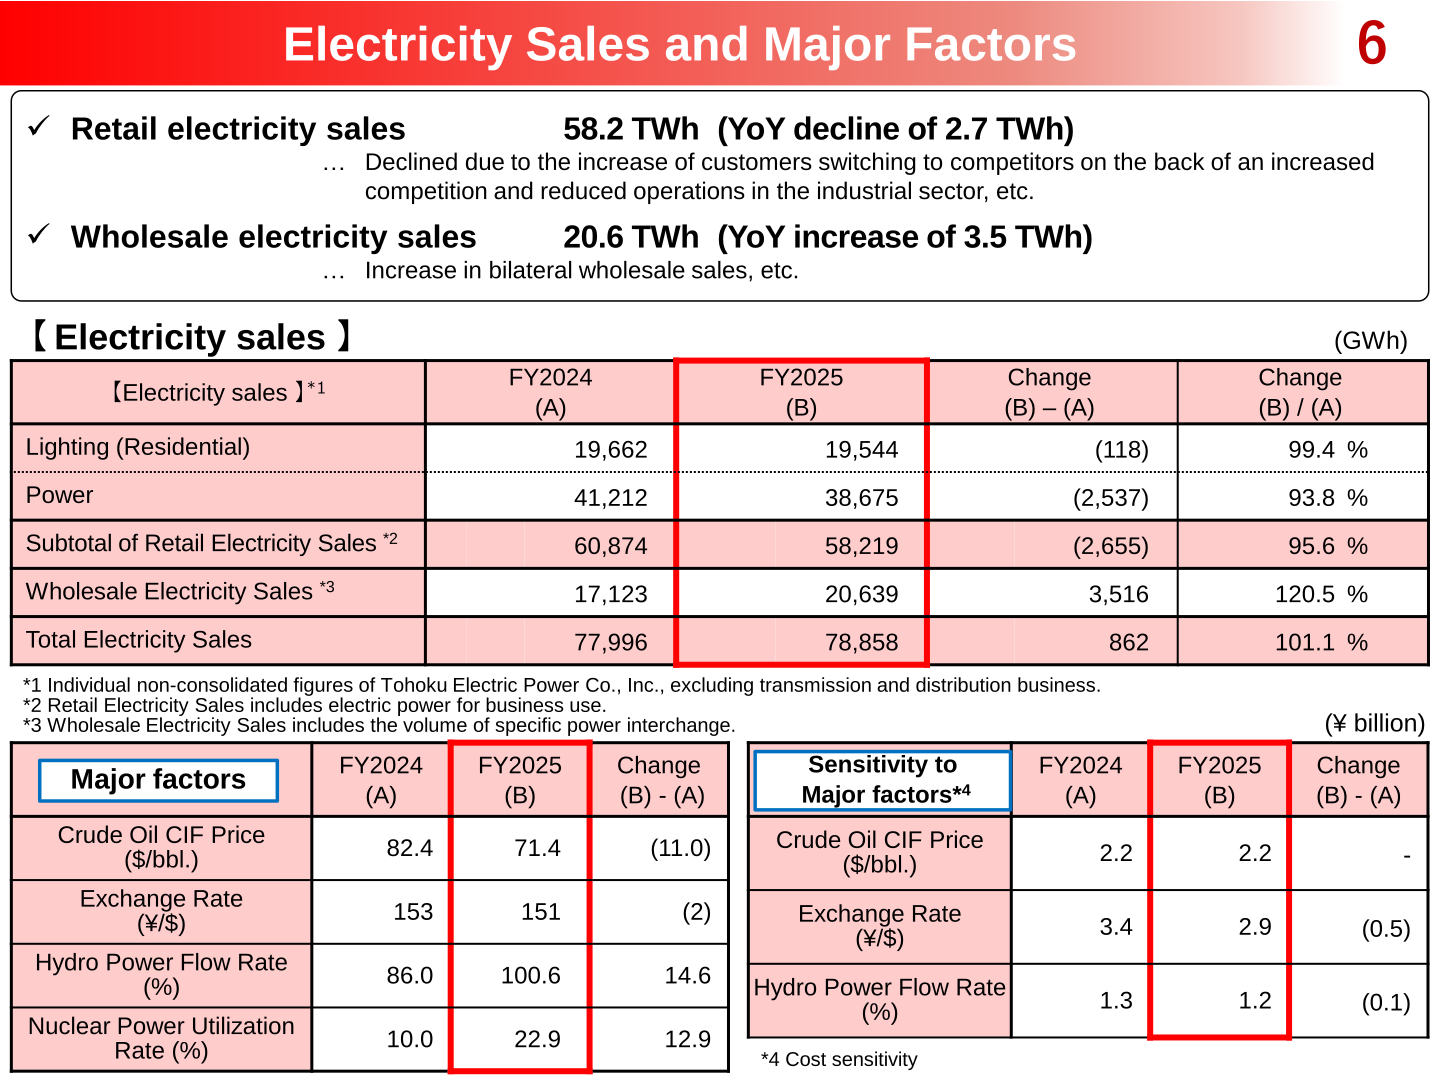
Retail electricity sales were 58.2 TWh, a year-on-year decline of 2.7 TWh, reflecting an increase of customers switching to competitors amid increased competition and reduced operations in the industrial sector. Wholesale electricity sales rose 3.5 TWh to 20.6 TWh on an increase in bilateral wholesale sales. On the supply side, own generated power rose to 56,168 GWh, with nuclear generation up 2,933 GWh to 5,199 GWh on increased operation of Onagawa Unit 2 and hydro up 922 GWh to 7,716 GWh on improved water flow rates, while thermal generation fell 2,922 GWh to 43,201 GWh. The time-lag effect of the fuel cost adjustment was a marginal profit of ¥17.0 billion for FY2025, down from ¥22.0 billion for FY2024.
| Item | FY2024 (A) | FY2025 (B) | Change (B) – (A) | Change (B) / (A) |
|---|---|---|---|---|
| Lighting (Residential) (GWh) | 19,662 | 19,544 | (118) | 99.4 % |
| Power (GWh) | 41,212 | 38,675 | (2,537) | 93.8 % |
| Subtotal of Retail Electricity Sales (GWh) | 60,874 | 58,219 | (2,655) | 95.6 % |
| Wholesale Electricity Sales (GWh) | 17,123 | 20,639 | 3,516 | 120.5 % |
| Total Electricity Sales (GWh) | 77,996 | 78,858 | 862 | 101.1 % |
| Crude Oil CIF Price ($/bbl.) | 82.4 | 71.4 | (11.0) | – |
| Exchange Rate (¥/$) | 153 | 151 | (2) | – |
| Hydro Power Flow Rate (%) | 86.0 | 100.6 | 14.6 | – |
| Nuclear Power Utilization Rate (%) | 10.0 | 22.9 | 12.9 | – |
Segment Results
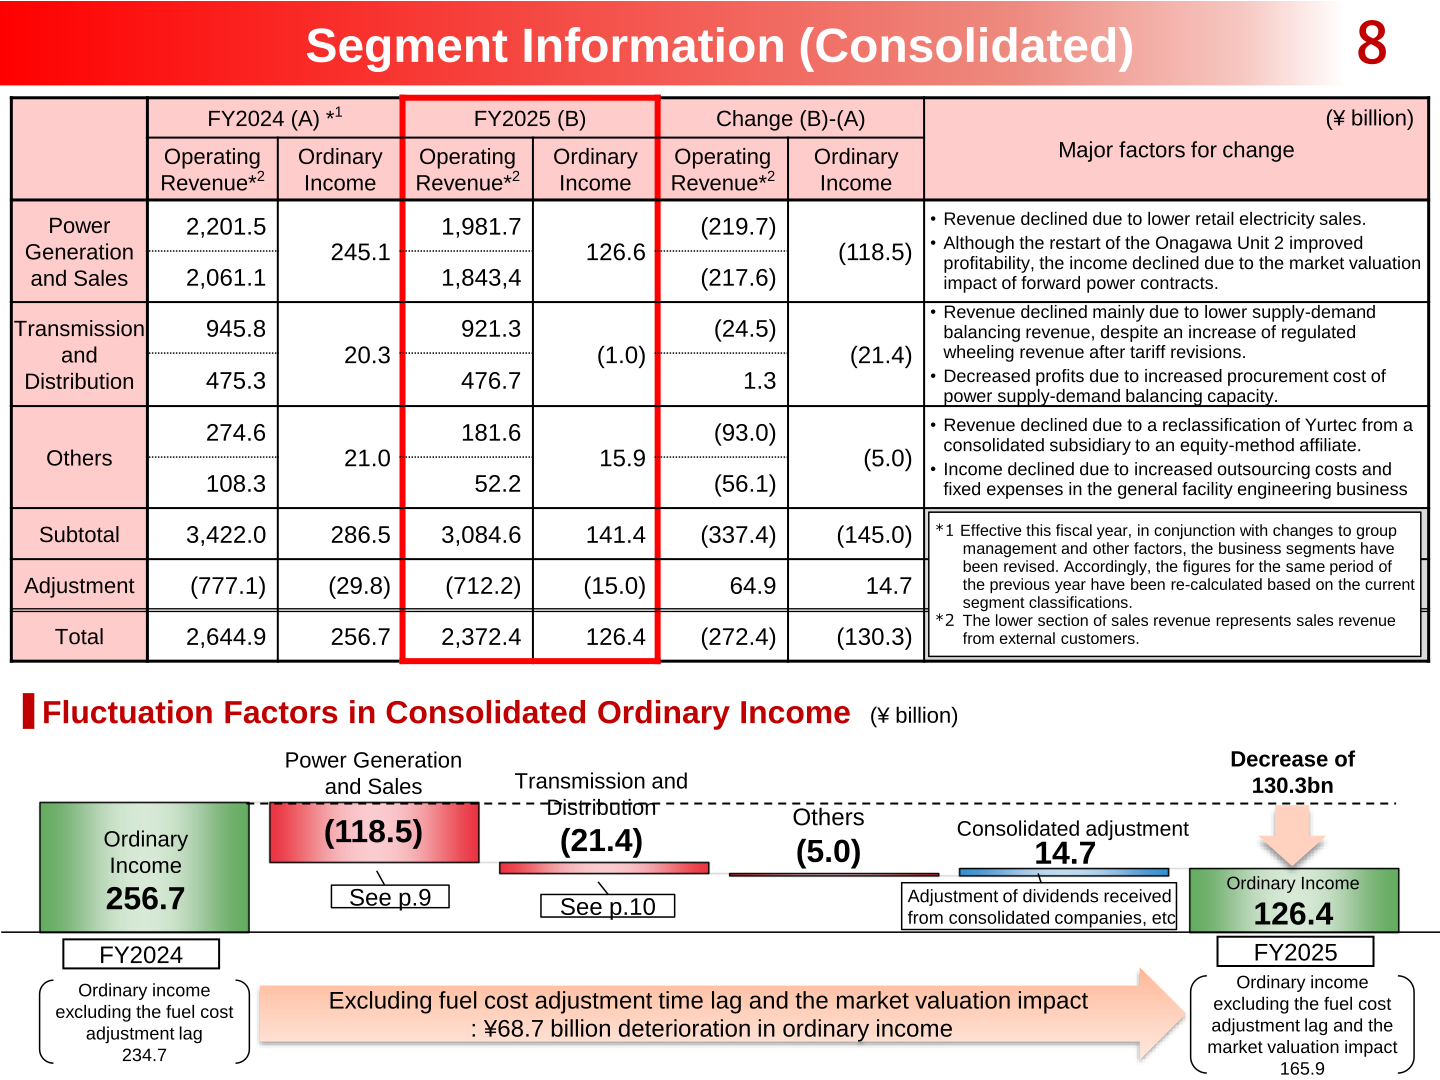
Effective this fiscal year, in conjunction with changes to group management and other factors, the business segments have been revised, and the figures for the same period of the previous year have been re-calculated based on the current segment classifications. In Power Generation and Sales, ordinary income fell ¥118.5 billion to ¥126.6 billion; although the restart of Onagawa Unit 2 improved profitability, income declined due to the market valuation impact of forward power contracts. Excluding the time-lag effect of the fuel cost adjustment and the market valuation impact, this segment’s income decreased by ¥57.0 billion. Transmission and Distribution swung to an ordinary loss of ¥1.0 billion, down ¥21.4 billion, mainly due to increased procurement cost of power supply-demand balancing capacity, despite an increase of regulated wheeling revenue after tariff revisions; area demand in the Tohoku area was flat year on year at 75.2 TWh. In Others, revenue declined due to a reclassification of Yurtec from a consolidated subsidiary to an equity-method affiliate.
| Segment | Metric (¥ billion) | FY2024 (A) | FY2025 (B) | Change (B) – (A) |
|---|---|---|---|---|
| Power Generation and Sales | Operating Revenue | 2,201.5 | 1,981.7 | (219.7) |
| Power Generation and Sales | Ordinary Income | 245.1 | 126.6 | (118.5) |
| Transmission and Distribution | Operating Revenue | 945.8 | 921.3 | (24.5) |
| Transmission and Distribution | Ordinary Income | 20.3 | (1.0) | (21.4) |
| Others | Operating Revenue | 274.6 | 181.6 | (93.0) |
| Others | Ordinary Income | 21.0 | 15.9 | (5.0) |
| Subtotal | Operating Revenue | 3,422.0 | 3,084.6 | (337.4) |
| Subtotal | Ordinary Income | 286.5 | 141.4 | (145.0) |
| Adjustment | Operating Revenue | (777.1) | (712.2) | 64.9 |
| Adjustment | Ordinary Income | (29.8) | (15.0) | 14.7 |
| Total | Operating Revenue | 2,644.9 | 2,372.4 | (272.4) |
| Total | Ordinary Income | 256.7 | 126.4 | (130.3) |
FY2026 Forecast
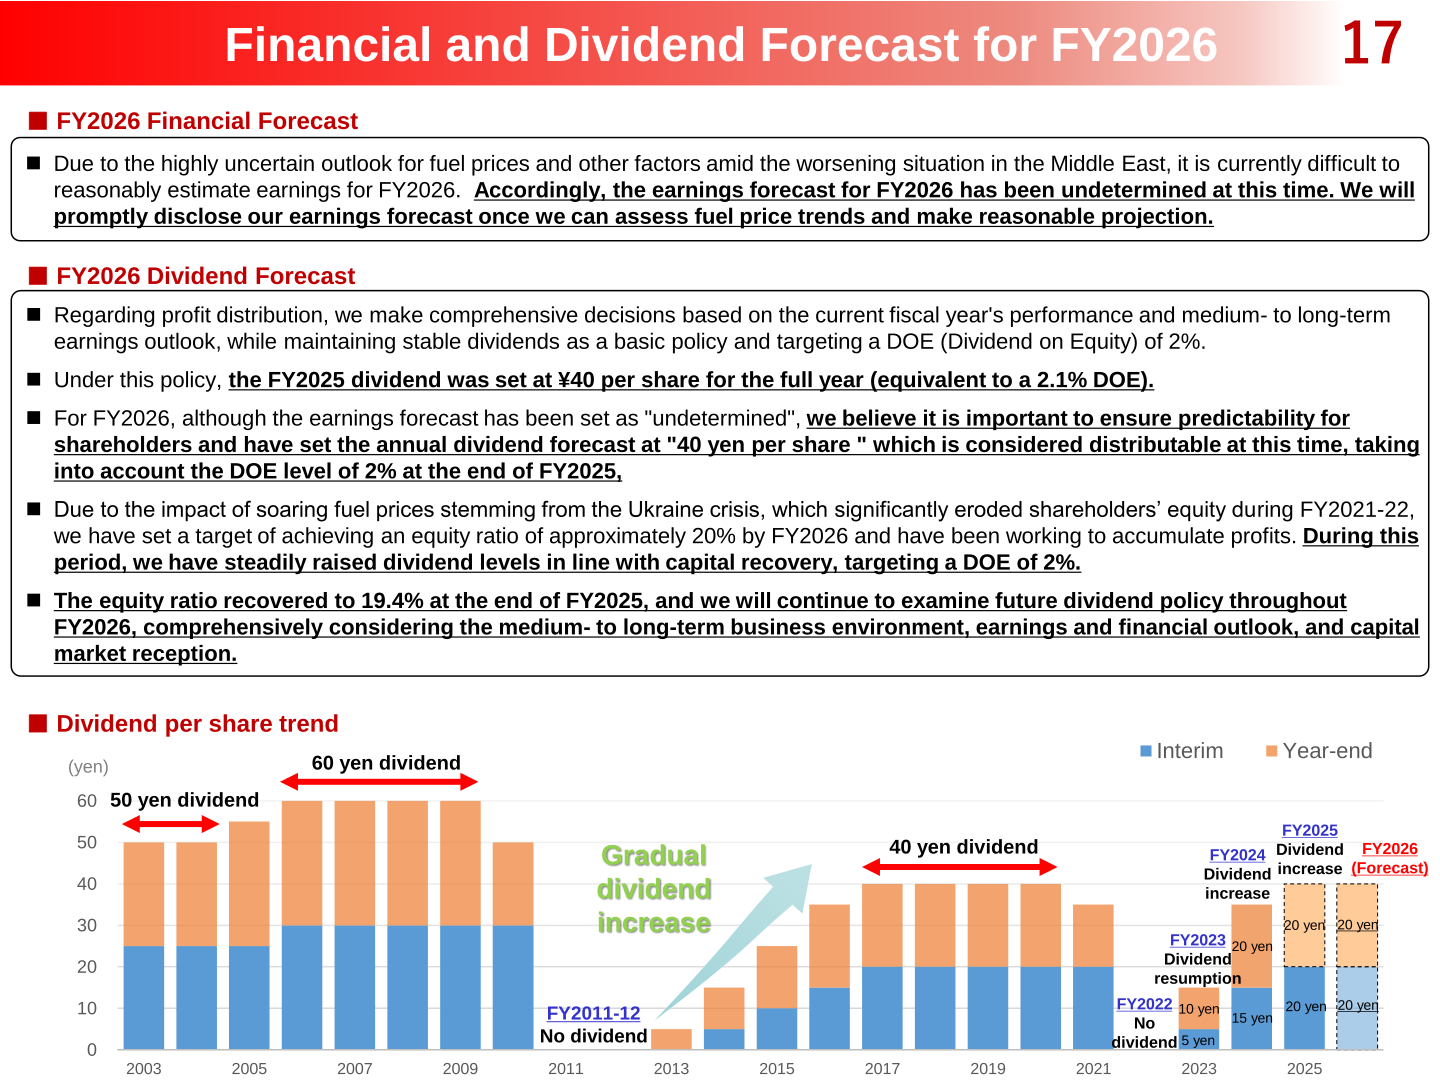
Due to the highly uncertain outlook for fuel prices and other factors amid the worsening situation in the Middle East, the company states that it is currently difficult to reasonably estimate earnings for FY2026, and the earnings forecast for FY2026 has been undetermined at this time. The company says it will promptly disclose its earnings forecast once it can assess fuel price trends and make a reasonable projection. Consolidated revenue and profit forecasts for FY2026 therefore cannot be confirmed from the materials. The company does disclose that the market valuation impact recorded in FY2025 will be reversed at the beginning of FY2026, with ¥56.5 billion to be recorded in FY2026.
Shareholder Returns
Regarding profit distribution, the company makes comprehensive decisions based on the current fiscal year’s performance and medium- to long-term earnings outlook, while maintaining stable dividends as a basic policy and targeting a DOE (Dividend on Equity) of 2%. Under this policy, the FY2025 dividend was set at ¥40 per share for the full year (¥20 interim and ¥20 year-end), equivalent to a 2.1% DOE. For FY2026, although the earnings forecast has been set as undetermined, the company states that it is important to ensure predictability for shareholders and has set the annual dividend forecast at ¥40 per share (¥20 interim and ¥20 year-end), which is considered distributable at this time, taking into account the DOE level of 2% at the end of FY2025. The equity ratio recovered to 19.4% at the end of FY2025, and the company will continue to examine future dividend policy throughout FY2026, comprehensively considering the medium- to long-term business environment, earnings and financial outlook, and capital market reception. In the FY2025 cash allocation, shareholder returns accounted for ¥20 billion.
Financial Targets and Capital Allocation
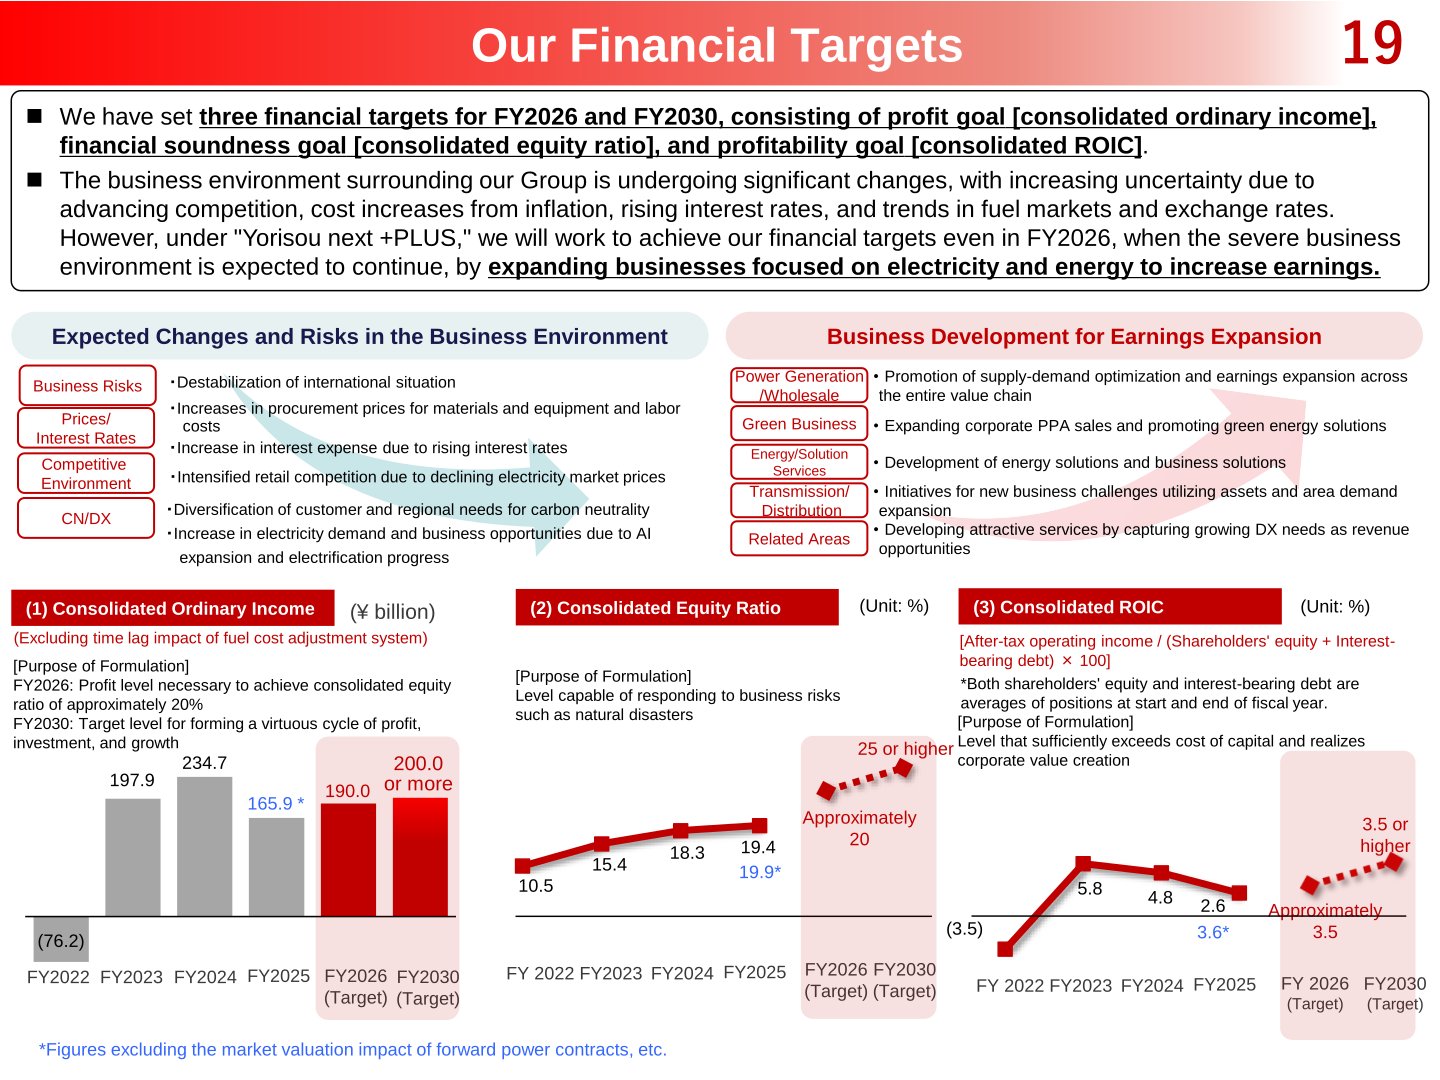
The company has set three financial targets for FY2026 and FY2030, consisting of a profit goal (consolidated ordinary income), a financial soundness goal (consolidated equity ratio) and a profitability goal (consolidated ROIC). The FY2025 figures marked with an asterisk in the materials exclude the market valuation impact of forward power contracts and others. ROIC by business segment in FY2025 was 0.5% for Power Transmission/Distribution, 4.2% (5.9% excluding the market valuation impact and others) for Power Generation/Wholesale, and 6.0% for Green Business, Energy/Solution Service and Related Domains, against profitability targets of 1.5% or higher, 5% or higher and 6% or higher respectively. Consolidated ROE was 8.1% in FY2025.
| Metric | FY2024 | FY2025 | FY2026 (Target) | FY2030 (Target) |
|---|---|---|---|---|
| Consolidated Ordinary Income (¥ billion, excluding time lag impact of fuel cost adjustment system) | 234.7 | 165.9 * | 190.0 | 200.0 or more |
| Consolidated Equity Ratio (%) | 18.3 | 19.4 (19.9 *) | Approximately 20 | 25 or higher |
| Consolidated ROIC (%) | 4.8 | 2.6 (3.6 *) | Approximately 3.5 | 3.5 or higher |
In FY2025, capital investments totalled ¥422.6 billion, comprising ¥184.6 billion for generation and sales, ¥217.2 billion for transmission and distribution, and ¥20.7 billion for other areas. Of this, approximately ¥58.0 billion was strategic investment: approximately ¥34.0 billion for thermal power decarbonization, approximately ¥14.0 billion for renewable energy development, and approximately ¥10.0 billion for new areas such as DX. Fund procurement was ¥551.8 billion (bonds ¥192.6 billion, borrowings ¥359.2 billion) against debt redemption of ¥410.0 billion (bonds ¥155.0 billion, borrowings ¥255.0 billion). To diversify funding sources, the company issued Transition Bonds (¥20.0 billion in July 2025) and, for the first time since October 1997, U.S. dollar-denominated corporate bonds (US$500 million in March 2026). The company also obtained an “A-” credit rating from S&P.
Nuclear Power and Other Topics
Onagawa Unit 2 ceased power generation on January 14, 2026 and began its 12th Periodic Operator Inspection as scheduled. The period from the start of the inspection to the resumption of power generation is expected to be approximately four months, with resumption of power generation planned for May 2026. Regarding the deadline for installation of the Specific Safety Facility (SSF), a review was approved by the Nuclear Regulation Authority on April 1, 2026 and procedures for revision are underway; if implemented, Onagawa Unit 2 is expected to be able to continue operation beyond the current installation deadline of December 2026 until around June 2027. Completion of construction for the SSF is scheduled for August 2028. The company reports stable operation of Onagawa Unit 2 in FY2025 with a capacity factor of 76.2%. For Higashidori Unit 1, evaluations relating to the design basis tsunami received assessments of “generally appropriate” at review meetings in November 2025 and January 2026, and the company aims to announce the completion timing of safety measures construction around March 2027. For Onagawa Unit 3, geological surveys are being conducted as part of preparations for a conformity review application, over a period of approximately two years from January 2025.
Other FY2025 topics disclosed include strong orders for corporate PPAs, with a cumulative total inside and outside the service area exceeding ¥150 billion, the establishment of a dedicated team for data center attraction in collaboration with NTT East and the Development Bank of Japan, an output increase at Joetsu Thermal Power Station Unit 1, Yorisou e-net membership reaching 2 million, and revision of wheeling charges in the network business.
This article is an analysis based on publicly available information and is not a recommendation to buy or sell any specific securities. Investment decisions are your own responsibility.
![[Obayashi] Investors’ Guide 2026 — The Complete 24-Article Breakdown](https://japan-equity.com/wp-content/uploads/2026/07/hub_cover-1024x1024.png)
![[Obayashi] IR & SR Policy — Feeding Dialogue Back into Management](https://japan-equity.com/wp-content/uploads/2026/07/p32_sq-1024x1024.jpg)
![[Obayashi] Domestic Civil Engineering — Resilience Spending Supports 9.6% Margin](https://japan-equity.com/wp-content/uploads/2026/07/p11_sq-1024x1024.jpg)
![[Obayashi] Overseas Construction — Orders Reach ¥1.2tn](https://japan-equity.com/wp-content/uploads/2026/07/p15_sq-1024x1024.jpg)
![[Obayashi] Share Price & External Ratings — vs TOPIX, ESG Index Inclusion](https://japan-equity.com/wp-content/uploads/2026/07/p40_sq-1024x1024.jpg)
![[Construction] ¥75.5tn Investment, Shrinking Workforce — Big-5 Market Share](https://japan-equity.com/wp-content/uploads/2026/07/p12_sq-1024x1024.jpg)



![[Obayashi] Capital Policy & Shareholder Returns — ROE 10%+, DOE ~5%, ¥100bn Buyback](https://japan-equity.com/wp-content/uploads/2026/07/p27_sq-1024x1024.jpg)
![[Obayashi] Reducing Cross-Shareholdings — ¥285.2bn Sold in Five Years](https://japan-equity.com/wp-content/uploads/2026/07/p29_sq-1024x1024.jpg)
![[Obayashi] ¥750bn Investment Plan — ¥300bn to Development, ¥190bn to Tech/DX](https://japan-equity.com/wp-content/uploads/2026/07/p30_sq-1024x1024.jpg)
![[Obayashi] MTP2022 KPIs — Operating Profit ~2x Target, ROE 14.4%](https://japan-equity.com/wp-content/uploads/2026/07/p25_sq-1024x1024.jpg)
![[Obayashi] Cash Allocation — ¥420bn Investment CF Over Five Years](https://japan-equity.com/wp-content/uploads/2026/07/p26_sq-1024x1024.jpg)
![[Obayashi] Green Energy — 44 Plants, 344MW, and the Green Hydrogen Challenge](https://japan-equity.com/wp-content/uploads/2026/07/p21_sq-1024x1024.jpg)
![[Obayashi] Tackling the Labor Shortage — Robotics Construction®](https://japan-equity.com/wp-content/uploads/2026/07/p14_sq-1024x1024.jpg)
