
This article is based on publicly available IR materials and is not a recommendation to buy or sell any specific securities.
TBS Holdings reported higher net sales and higher operating profit for FY25, the fiscal year ended March 31, 2026 (the labels “FY25” and “FY2025” are used in the materials for this same period). Consolidated net sales reached a record high, and the consolidated operating profit target of 24 billion yen set under the TBS Group Medium-Term Business Plan 2026 was achieved one year ahead of schedule. In the Media and Content business, both net sales and operating profit increased on a rise in broadcasting revenue from strong viewer ratings and growth in streaming ad revenue. Alongside the results, the company raised its FY25 year-end dividend forecast by 11 yen per share to 49 yen and updated the Medium-Term Business Plan 2026.
Consolidated Results (Full-Year Actual)
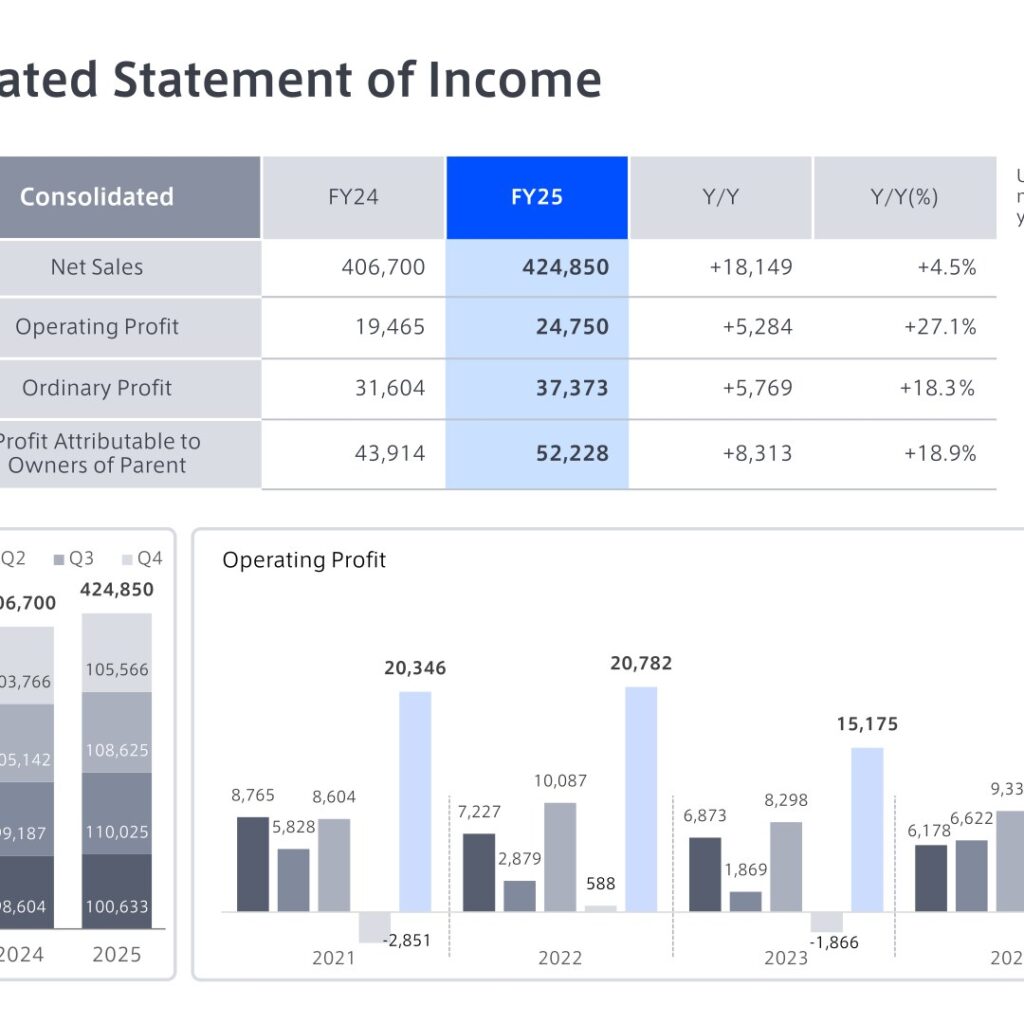
Consolidated net sales were 424,850 million yen (+18,149 million yen, +4.5% year on year) and operating profit was 24,750 million yen (+5,284 million yen, +27.1%). Ordinary profit was 37,373 million yen (+5,769 million yen, +18.3%) and profit attributable to owners of parent was 52,228 million yen (+8,313 million yen, +18.9%). By segment, Media and Content posted higher net sales and operating profit; Lifestyle posted higher net sales but lower operating profit due to higher personnel expenses at YARUKI Switch Group; and Real Estate and Others saw net sales roughly flat year on year with operating profit down on higher expenses.
| Item (millions of yen) | FY24 | FY25 | Y/Y | Y/Y(%) |
|---|---|---|---|---|
| Net Sales | 406,700 | 424,850 | +18,149 | +4.5% |
| Operating Profit | 19,465 | 24,750 | +5,284 | +27.1% |
| Ordinary Profit | 31,604 | 37,373 | +5,769 | +18.3% |
| Profit Attributable to Owners of Parent | 43,914 | 52,228 | +8,313 | +18.9% |
Segment Results
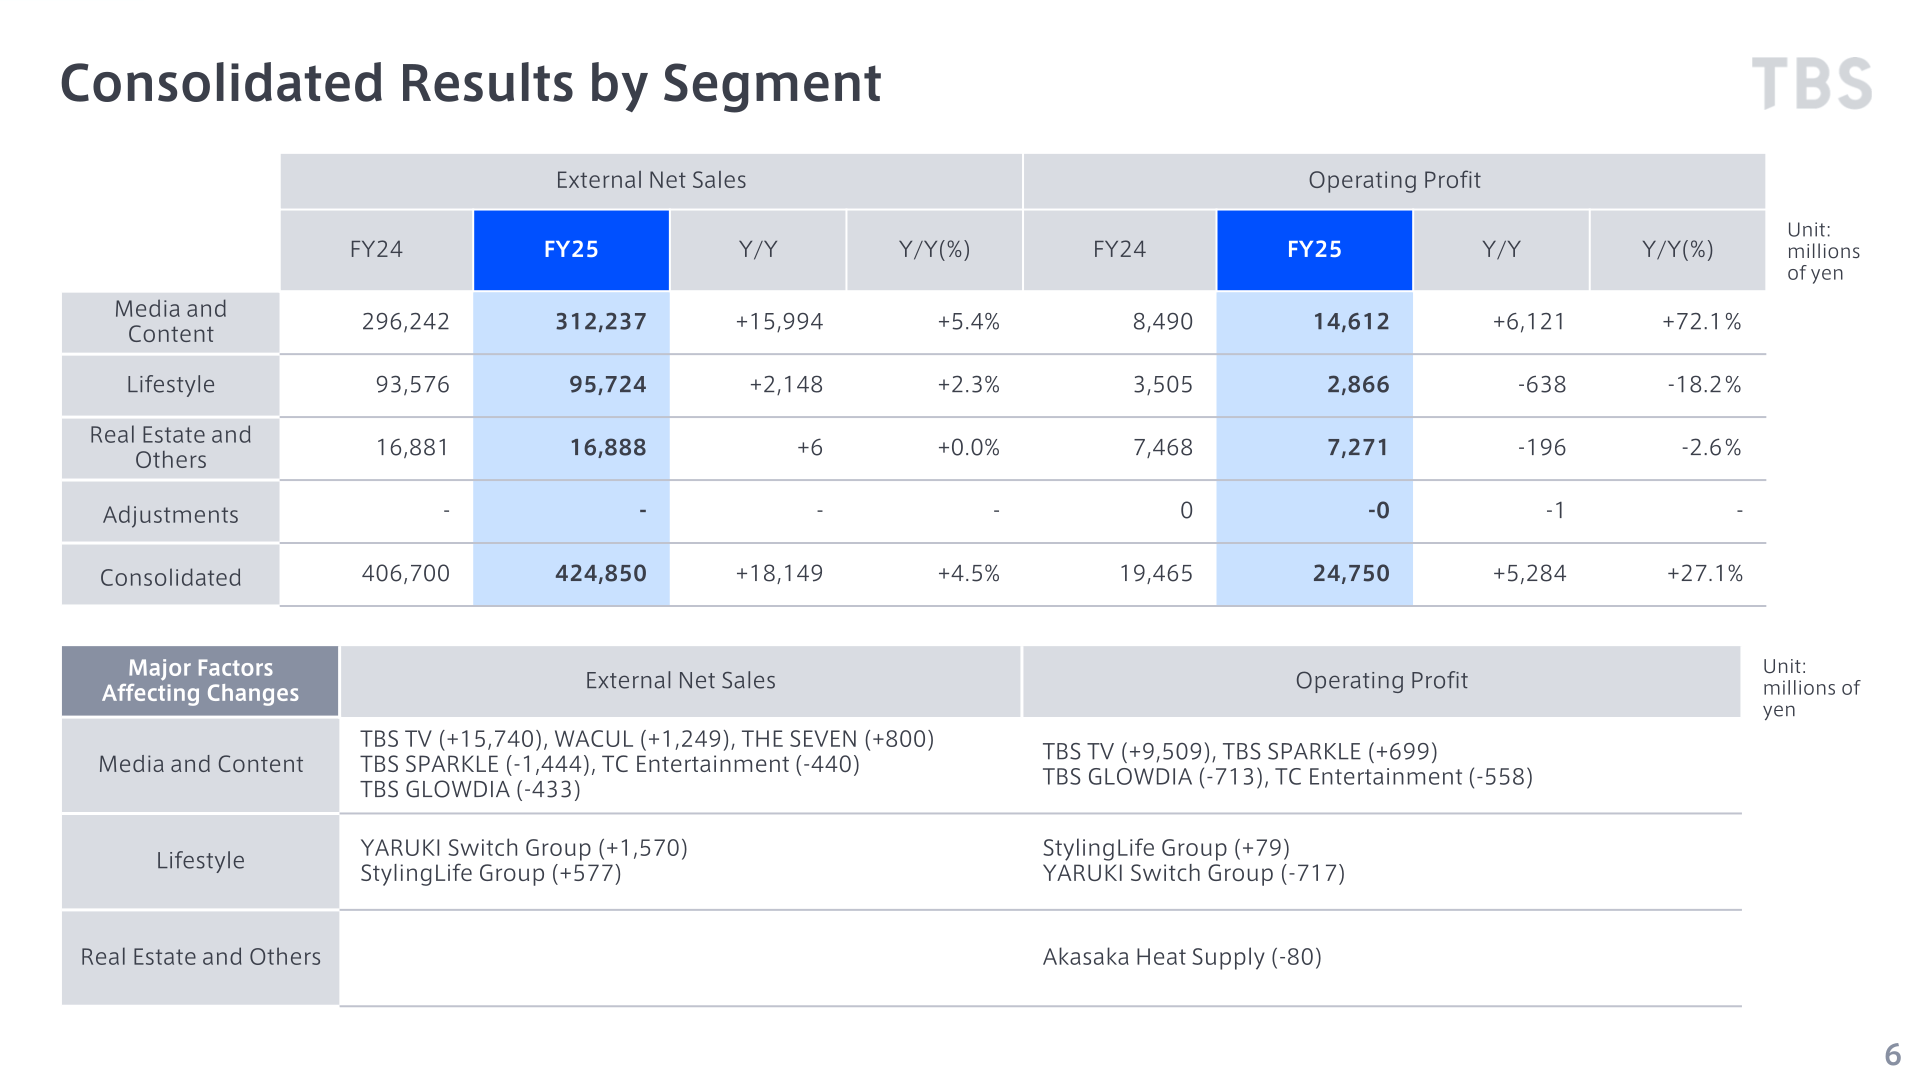
Media and Content external net sales rose to 312,237 million yen (+5.4%) and segment operating profit rose to 14,612 million yen (+72.1%), with TBS TV (+9,509 million yen) and TBS SPARKLE (+699 million yen) the main positive factors on operating profit and TBS GLOWDIA (-713 million yen) and TC Entertainment (-558 million yen) the main negative factors. Lifestyle external net sales were 95,724 million yen (+2.3%) with operating profit of 2,866 million yen (-18.2%), reflecting StylingLife Group (+79 million yen) and YARUKI Switch Group (-717 million yen). Real Estate and Others external net sales were 16,888 million yen (+0.0%) with operating profit of 7,271 million yen (-2.6%).
| Segment (millions of yen) | External Net Sales FY24 | External Net Sales FY25 | Y/Y | Operating Profit FY24 | Operating Profit FY25 | Y/Y |
|---|---|---|---|---|---|---|
| Media and Content | 296,242 | 312,237 | +15,994 | 8,490 | 14,612 | +6,121 |
| Lifestyle | 93,576 | 95,724 | +2,148 | 3,505 | 2,866 | -638 |
| Real Estate and Others | 16,881 | 16,888 | +6 | 7,468 | 7,271 | -196 |
| Adjustments | – | – | – | 0 | -0 | -1 |
| Consolidated | 406,700 | 424,850 | +18,149 | 19,465 | 24,750 | +5,284 |
TBS TV: Net Sales Breakdown
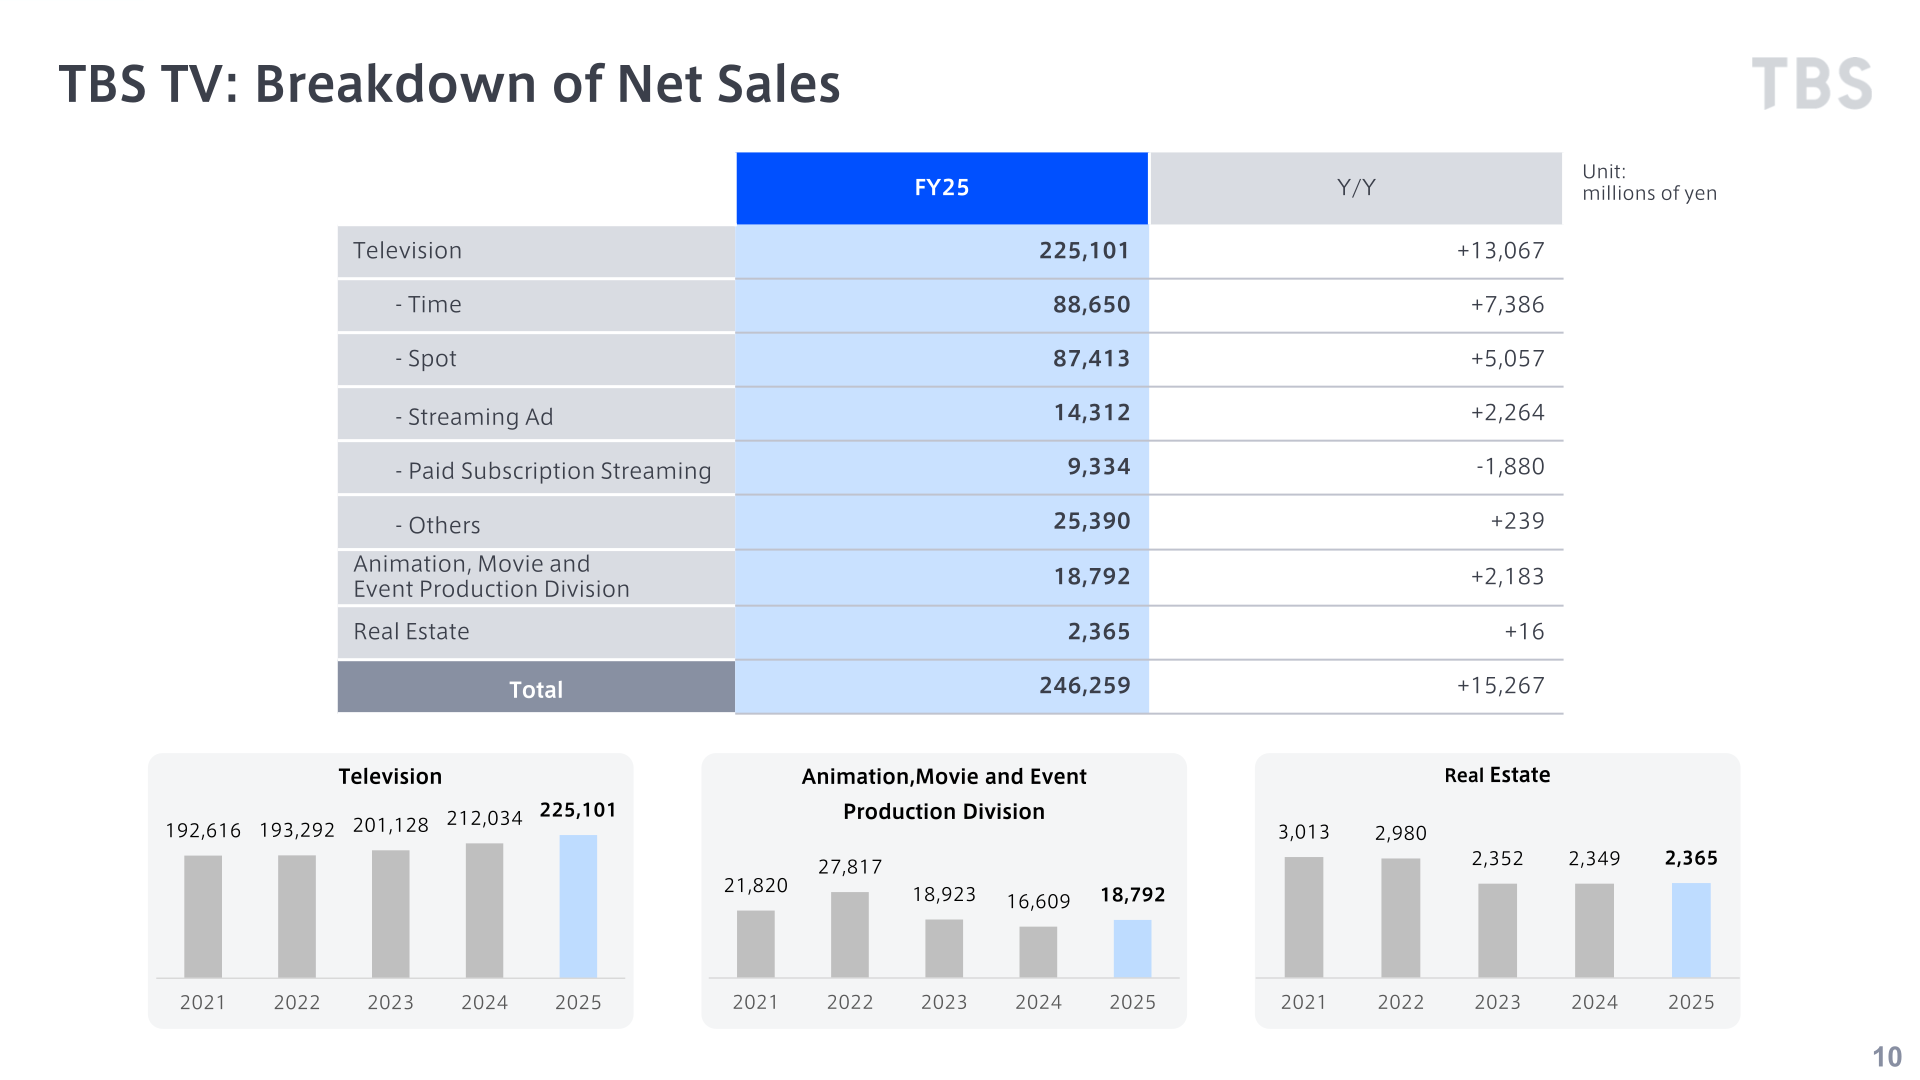
At TBS TV, net sales were 246,259 million yen (+15,267 million yen, +6.6%), operating profit was 16,820 million yen (+7,823 million yen, +87.0%), ordinary profit was 18,912 million yen (+7,162 million yen, +61.0%) and profit was 39,966 million yen (+14,238 million yen, +55.3%). The materials list extraordinary income of 43,774 million yen (gain on sale of investment securities) and extraordinary loss of 1,166 million yen (asset removal costs etc.) for TBS TV, together with TV program costs of +3,049 million yen, agency commissions of +3,348 million yen, network expense of +1,140 million yen and operating expense in the Animation, Movie and Event Production Division of +2,375 million yen. Within television revenue, Time revenue was 88,650 million yen (+7,386 million yen) and Spot revenue was 87,413 million yen (+5,057 million yen); September Time ad sales rose significantly on the World Athletics Championships Tokyo 25. Streaming Ad net sales grew to 14,312 million yen (+18.8%) on strong viewership primarily for dramas and variety shows, while Paid Subscription Streaming net sales declined to 9,334 million yen (-16.8%) on the variance in the number of titles distributed overseas.
| TBS TV Net Sales (millions of yen) | FY25 | Y/Y |
|---|---|---|
| Television | 225,101 | +13,067 |
| – Time | 88,650 | +7,386 |
| – Spot | 87,413 | +5,057 |
| – Streaming Ad | 14,312 | +2,264 |
| – Paid Subscription Streaming | 9,334 | -1,880 |
| – Others | 25,390 | +239 |
| Animation, Movie and Event Production Division | 18,792 | +2,183 |
| Real Estate | 2,365 | +16 |
| Total | 246,259 | +15,267 |
FY26 Full-Year Forecasts
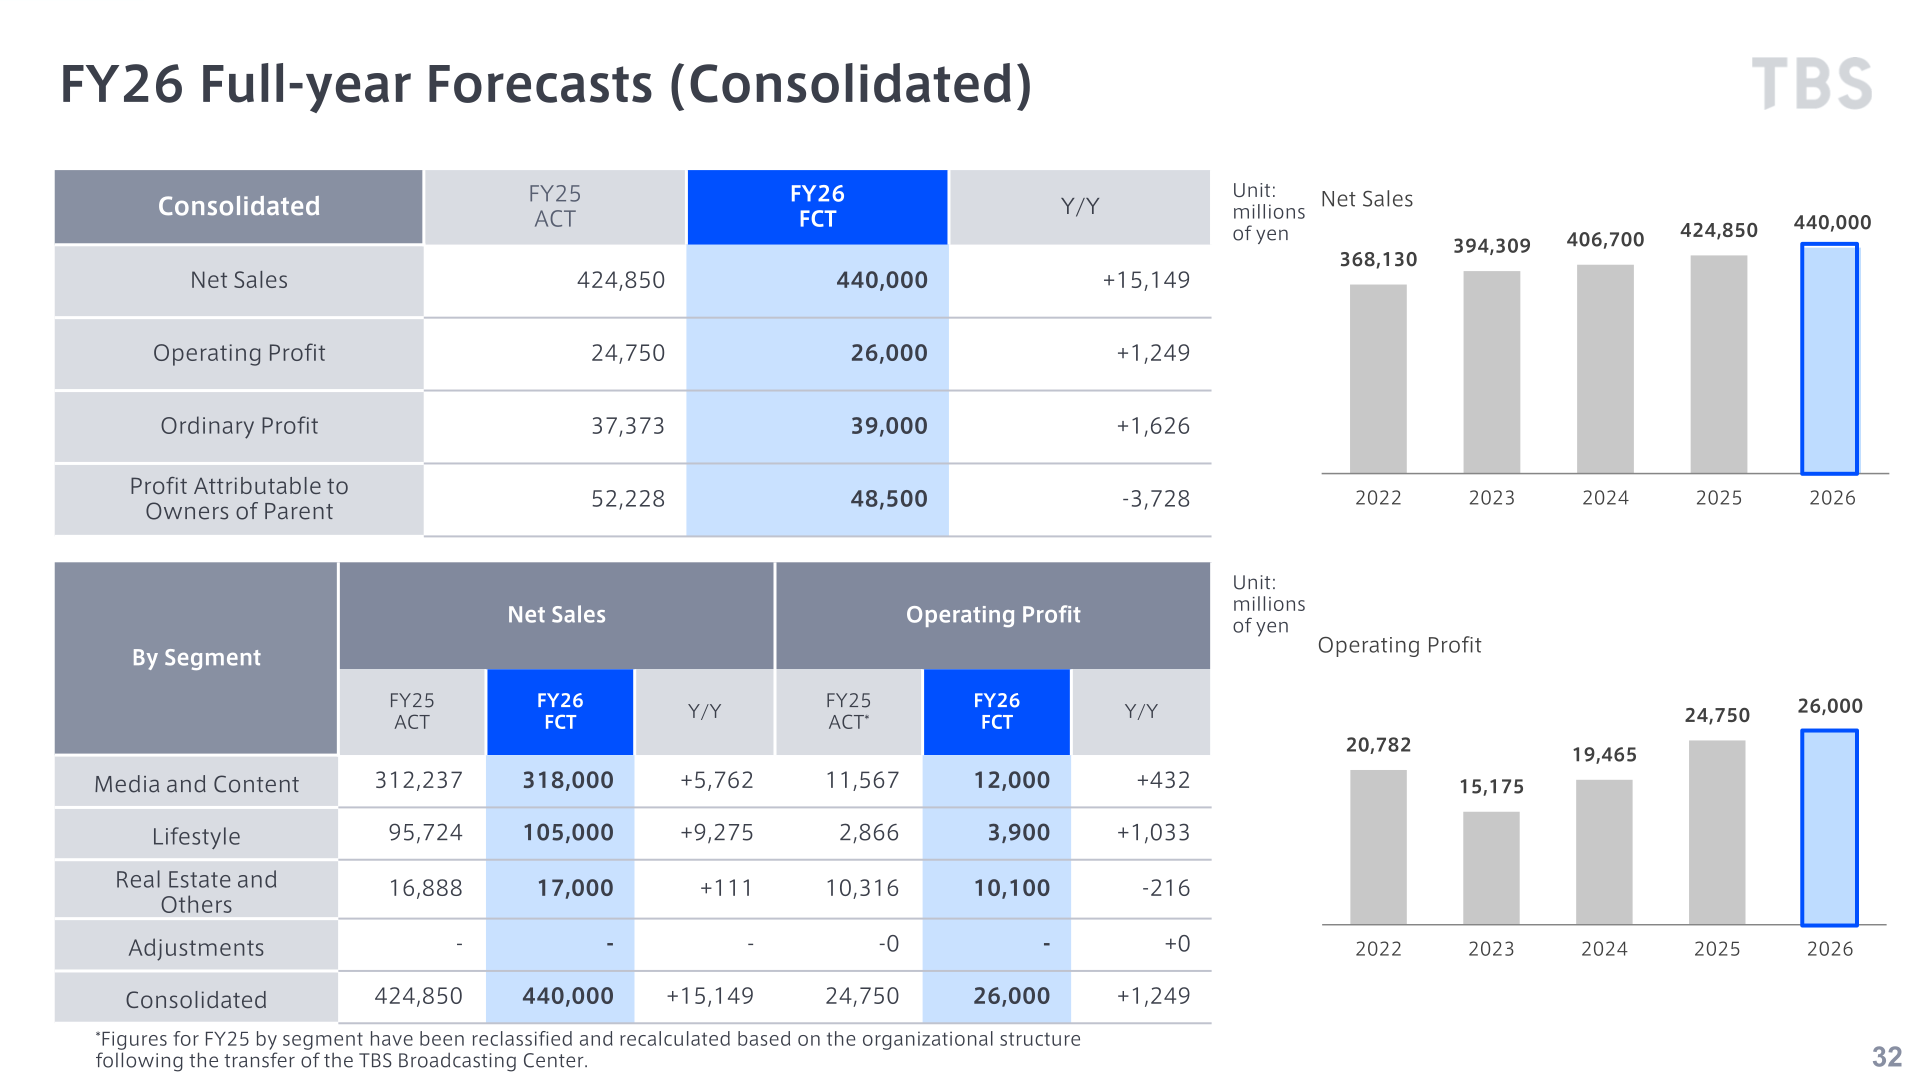
For FY26, the company forecasts consolidated net sales of 440,000 million yen (+15,149 million yen), operating profit of 26,000 million yen (+1,249 million yen), ordinary profit of 39,000 million yen (+1,626 million yen) and profit attributable to owners of parent of 48,500 million yen (-3,728 million yen). By segment, Media and Content net sales are forecast at 318,000 million yen with operating profit of 12,000 million yen, Lifestyle at 105,000 million yen and 3,900 million yen, and Real Estate and Others at 17,000 million yen and 10,100 million yen. The materials note that FY25 segment figures in this forecast table have been reclassified and recalculated based on the organizational structure following the transfer of the TBS Broadcasting Center. For TBS TV, FY26 net sales are forecast at 253,700 million yen (+7,440 million yen) with operating profit of 15,000 million yen (-1,820 million yen), Time revenue of 85,800 million yen (-3.2%), Spot revenue of 87,700 million yen (+0.3%), Streaming Ad revenue of 17,200 million yen (+20.2%) and TV program costs of 95,800 million yen (-4.5%).
| Item (millions of yen) | FY25 ACT | FY26 FCT | Y/Y |
|---|---|---|---|
| Net Sales | 424,850 | 440,000 | +15,149 |
| Operating Profit | 24,750 | 26,000 | +1,249 |
| Ordinary Profit | 37,373 | 39,000 | +1,626 |
| Profit Attributable to Owners of Parent | 52,228 | 48,500 | -3,728 |
Shareholder Returns
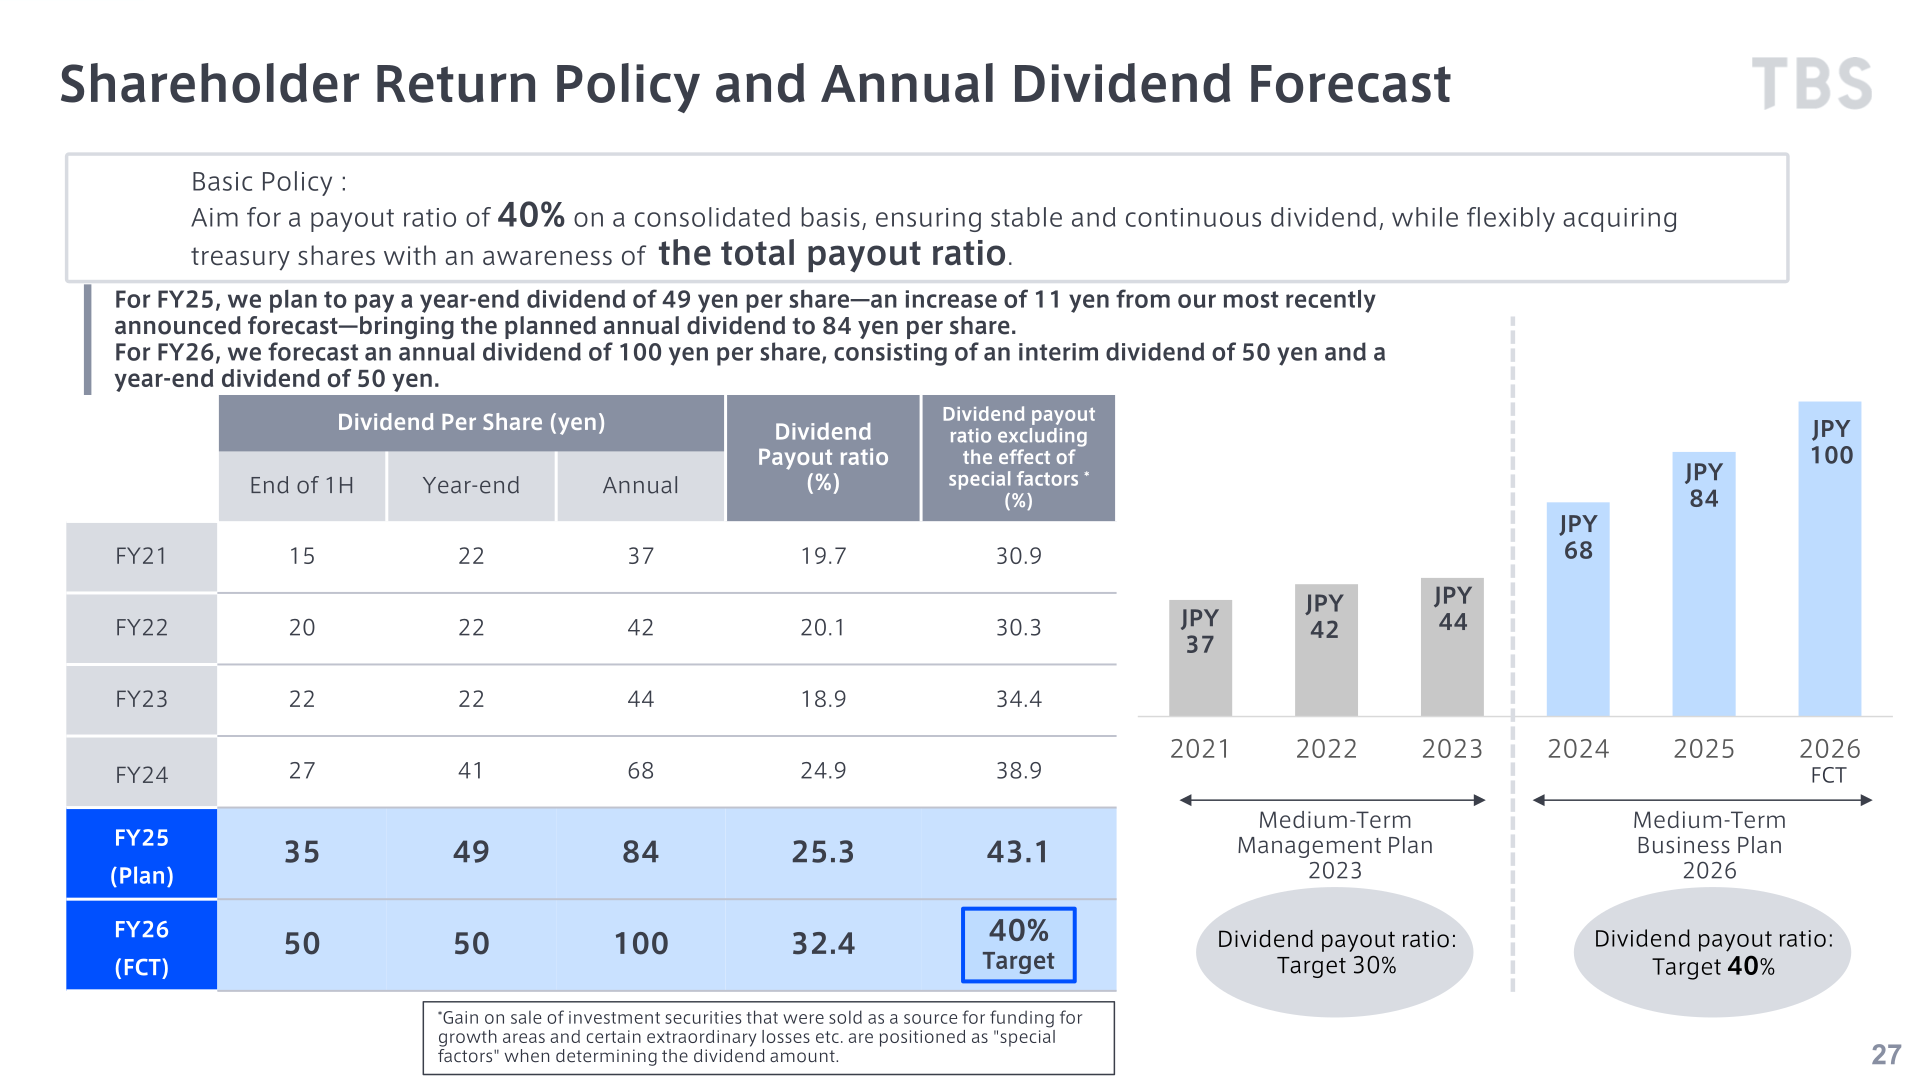
The basic policy is to aim for a payout ratio of 40% on a consolidated basis, ensuring a stable and continuous dividend, while flexibly acquiring treasury shares with an awareness of the total payout ratio. For FY25 the company plans a year-end dividend of 49 yen per share, an increase of 11 yen from the most recently announced forecast, bringing the planned annual dividend to 84 yen per share. For FY26 it forecasts an annual dividend of 100 yen per share, consisting of an interim dividend of 50 yen and a year-end dividend of 50 yen. Under the resolution on the acquisition of treasury shares, up to 6,500,000 shares (4.05% of the total number of issued shares excluding treasury shares) may be acquired for up to 36 billion yen between May 15, 2026 and February 26, 2027, and a cancellation of 4,500,000 shares is planned. In the updated Medium-Term Business Plan 2026, total shareholder returns were upscaled to 105 billion yen over the three-year period, an expansion of 45 billion yen relative to the initial plan (a 25 billion yen increase from the November announcement).
| Dividend Per Share (yen) | End of 1H | Year-end | Annual | Dividend Payout Ratio (%) | Dividend Payout Ratio Excluding the Effect of Special Factors (%) |
|---|---|---|---|---|---|
| FY23 | 22 | 22 | 44 | 18.9 | 34.4 |
| FY24 | 27 | 41 | 68 | 24.9 | 38.9 |
| FY25 (Plan) | 35 | 49 | 84 | 25.3 | 43.1 |
| FY26 (FCT) | 50 | 50 | 100 | 32.4 | 47.6 |
Medium-Term Business Plan 2026 Update and Topics
The operating profit goal of the Medium-Term Business Plan 2026 was achieved one year ahead of schedule, and the FY2026 target was updated to net sales of 440 billion yen and operating profit of 26 billion yen. On a consolidated basis in billions of yen, net sales moved from 394.3 (FY2023) and 406.7 (FY2024) to 424.8 in FY2025 (Actual) against a plan of 425.0, with operating profit of 24.7 against a plan of 21.5; the FY2030 target is net sales of 550.0 and operating profit of 38.5, with an operating profit margin of 7.00% and ROIC of 5.0%. Operating profit margin was 5.83% and ROIC 3.8% in FY2025 (Actual), with FY2026 forecast at 5.91% and 3.8%.
In the updated capital allocation, the investment securities sales target under MTBP 2026 was scaled to 135.0 billion yen based on progress to date (39.6 billion yen of cross-shareholdings sold in FY24 and 53.7 billion yen in FY25, for 93.4 billion yen over FY24 to FY25), debt financing for the Akasaka Entertainment City project was scaled from 40 billion yen to 84 billion yen, and cash flow from operating activities was revised down to 61 billion yen due to factors such as increased tax burdens from sales of shares and higher working capital requirements. On the allocation side, the plan shows investment in growth of 160 billion yen, shareholder returns of 105 billion yen and CAPEX to modernize broadcasting facilities of 15 billion yen, for a total of 280 billion yen on each side. Total investments in growth to date are 71.4 billion yen.
Other topics in the materials include the success of the World Athletics Championships Tokyo 25 (LTV4-59 golden time rating of 7.4% and prime time rating of 7.5%, peak rating of 16.3%, cumulative reach of 79.77 million viewers), the establishment on April 10, 2026 of StudioMonowa, a joint venture with CJ ENM and U-NEXT HOLDINGS with capital of 1.25 billion yen and a capital contribution ratio of CJ ENM 51%, TBS HD 40% and U-NEXT HD 9%, and THE SEVEN’s forecast net sales of more than 6.3 billion yen for FY26 and more than 8.1 billion yen for FY27. Consolidated CAPEX was 18,930 million yen in FY25 with depreciation and amortization of 15,053 million yen, and interest-bearing liabilities stood at 73.6 billion yen as of March 31, 2026 (+59.7 billion yen from the end of FY24, excluding lease obligations).
This article is an analysis based on publicly available information and is not a recommendation to buy or sell any specific securities. Investment decisions are your own responsibility.
![[Obayashi] Investors’ Guide 2026 — The Complete 24-Article Breakdown](https://japan-equity.com/wp-content/uploads/2026/07/hub_cover-1024x1024.png)
![[Obayashi] IR & SR Policy — Feeding Dialogue Back into Management](https://japan-equity.com/wp-content/uploads/2026/07/p32_sq-1024x1024.jpg)
![[Obayashi] Real Estate Development — 18.7% Margin, ¥287.7bn Unrealized Gains](https://japan-equity.com/wp-content/uploads/2026/07/p20_sq-1024x1024.jpg)
![[Obayashi] Domestic Civil Engineering — Resilience Spending Supports 9.6% Margin](https://japan-equity.com/wp-content/uploads/2026/07/p11_sq-1024x1024.jpg)
![[Obayashi] Share Price & External Ratings — vs TOPIX, ESG Index Inclusion](https://japan-equity.com/wp-content/uploads/2026/07/p40_sq-1024x1024.jpg)
![[Construction] ¥75.5tn Investment, Shrinking Workforce — Big-5 Market Share](https://japan-equity.com/wp-content/uploads/2026/07/p12_sq-1024x1024.jpg)



![[Obayashi] Capital Policy & Shareholder Returns — ROE 10%+, DOE ~5%, ¥100bn Buyback](https://japan-equity.com/wp-content/uploads/2026/07/p27_sq-1024x1024.jpg)
![[Obayashi] Reducing Cross-Shareholdings — ¥285.2bn Sold in Five Years](https://japan-equity.com/wp-content/uploads/2026/07/p29_sq-1024x1024.jpg)
![[Obayashi] ¥750bn Investment Plan — ¥300bn to Development, ¥190bn to Tech/DX](https://japan-equity.com/wp-content/uploads/2026/07/p30_sq-1024x1024.jpg)
![[Obayashi] MTP2022 KPIs — Operating Profit ~2x Target, ROE 14.4%](https://japan-equity.com/wp-content/uploads/2026/07/p25_sq-1024x1024.jpg)
![[Obayashi] Cash Allocation — ¥420bn Investment CF Over Five Years](https://japan-equity.com/wp-content/uploads/2026/07/p26_sq-1024x1024.jpg)
![[Obayashi] Green Energy — 44 Plants, 344MW, and the Green Hydrogen Challenge](https://japan-equity.com/wp-content/uploads/2026/07/p21_sq-1024x1024.jpg)
![[Obayashi] Tackling the Labor Shortage — Robotics Construction®](https://japan-equity.com/wp-content/uploads/2026/07/p14_sq-1024x1024.jpg)
