
This article is based on publicly available IR materials and is not a recommendation to buy or sell any specific securities.
Note: SENKO Group Holdings labels the fiscal year covered by this presentation as “FY 3/2026” (the fiscal year ended March 31, 2026); on this site that most recently completed fiscal year is classified as FY2025, and all headings, tables and figures below keep the labels used in the source materials.
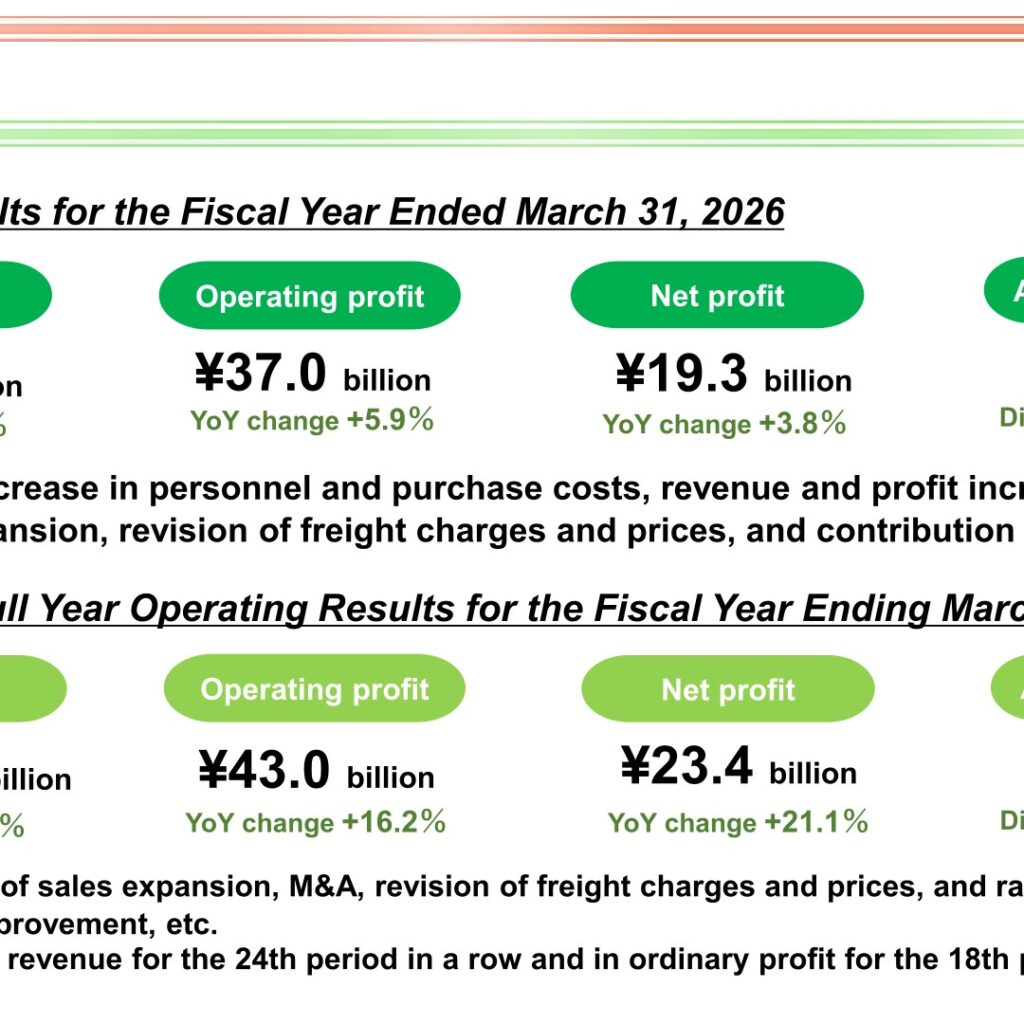
SENKO Group Holdings Co., Ltd. released its “Financial Results Presentation for the Fiscal Year Ended March 31, 2026” on May 13, 2026. Operating revenue was ¥899.6 billion (up 5.3% year on year), operating profit ¥37.0 billion (up 5.9%) and net profit ¥19.3 billion (up 3.8%). The company states that, despite an increase in personnel and purchase costs, revenue and profit increased due to sales expansion, revision of freight charges and prices, and the contribution of M&A. For the fiscal year ending March 31, 2027 the company plans operating revenue of ¥1,020.0 billion (up 13.4%), operating profit of ¥43.0 billion (up 16.2%) and net profit of ¥23.4 billion (up 21.1%), and expects an increase in revenue for the 24th period in a row and in ordinary profit for the 18th period in a row.
Consolidated Results (Full-Year Actual)
Operating revenue rose ¥45,070 million (5.3%) to ¥899,620 million, operating profit rose ¥2,050 million (5.9%) to ¥36,996 million, ordinary profit rose ¥1,474 million (4.4%) to ¥35,242 million, and profit attributable to owners of parent rose ¥710 million (3.8%) to ¥19,320 million. The operating margin was 4.1%, unchanged from the previous fiscal year, while the ordinary profit margin was 3.9% (4.0% in the previous fiscal year). As reference figures the company shows that the year-on-year increase in operating revenue was ¥22,771 million in the first half and ¥22,299 million in the second half, whereas operating profit fell ¥631 million in the first half and rose ¥2,681 million in the second half.
| Item (Million yen, %) | FY 3/2025 (Previous FY) | Margin | FY 3/2026 (Current FY) | Margin | YoY Change | % |
|---|---|---|---|---|---|---|
| Operating revenue | 854,550 | - | 899,620 | - | 45,070 | 5.3 |
| Operating profit | 34,946 | 4.1 | 36,996 | 4.1 | 2,050 | 5.9 |
| Ordinary profit | 33,767 | 4.0 | 35,242 | 3.9 | 1,474 | 4.4 |
| Profit attributable to owners of parent | 18,610 | 2.2 | 19,320 | 2.1 | 710 | 3.8 |
Against the company’s own plan for the fiscal year ended March 31, 2026, operating revenue of ¥899,620 million exceeded the plan of ¥898,000 million by ¥1,620 million (0.2%), operating profit of ¥36,996 million came in ¥4 million below the plan of ¥37,000 million, ordinary profit of ¥35,242 million exceeded the plan of ¥35,000 million by ¥242 million (0.7%), and profit attributable to owners of parent of ¥19,320 million exceeded the plan of ¥19,200 million by ¥120 million (0.6%).
Segment Results
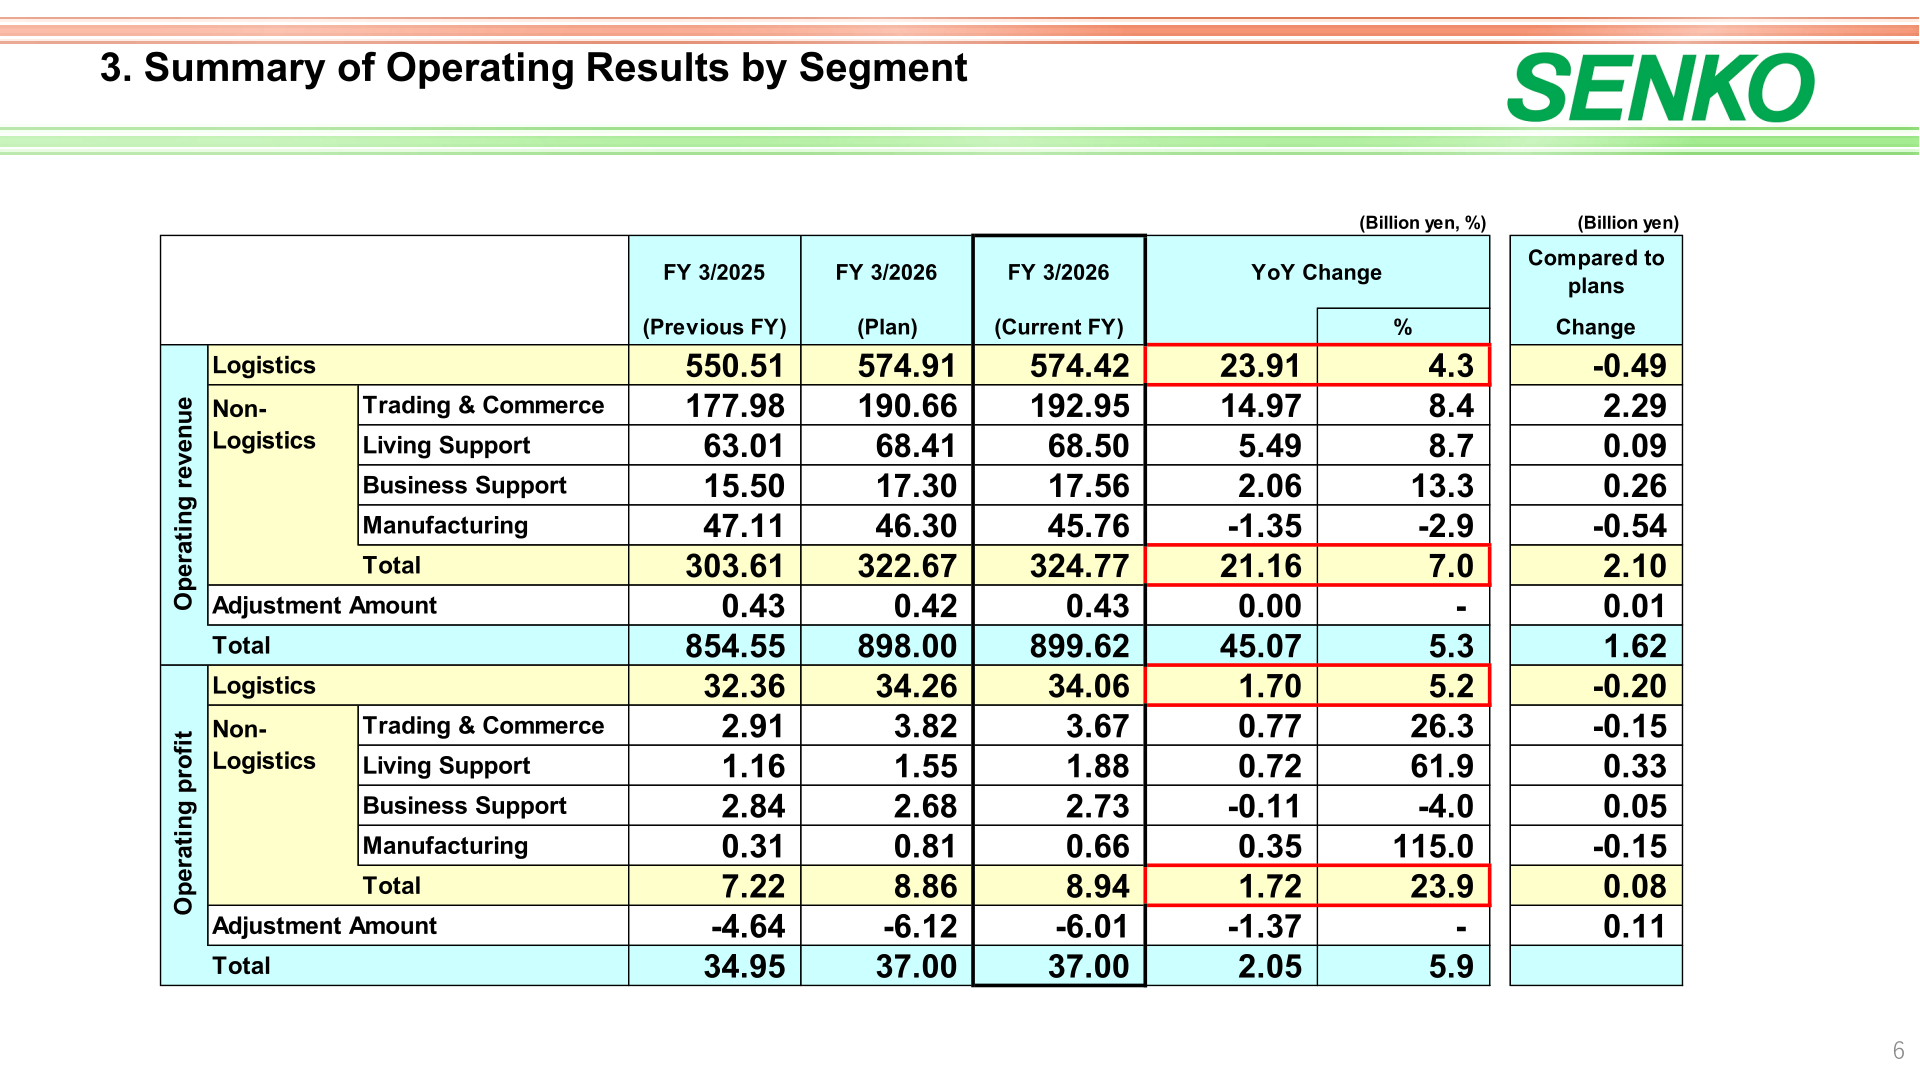
The group reports five business segments: Logistics, Trading & Commerce, Living Support, Business Support and Manufacturing (the latter four are shown together as “Non-Logistics”). Logistics operating revenue was ¥574.42 billion (up 4.3%) with operating profit of ¥34.06 billion (up 5.2%), and Non-Logistics operating revenue totalled ¥324.77 billion (up 7.0%) with operating profit of ¥8.94 billion (up 23.9%). Within Logistics, operating revenue comprised domestic logistics ¥387.60 billion, cold chain logistics ¥73.63 billion, international logistics ¥70.51 billion and maritime transport ¥42.68 billion, and the segment operating profit ratio was 5.9%. Within Trading & Commerce, operating revenue comprised trading & commerce & sales ¥54.28 billion, household paper wholesale ¥111.37 billion and international trade ¥27.30 billion, with an operating profit ratio of 1.9%.
| Segment (Billion yen, %) | Operating revenue FY 3/2025 | Operating revenue FY 3/2026 | YoY % | Operating profit FY 3/2025 | Operating profit FY 3/2026 | YoY % |
|---|---|---|---|---|---|---|
| Logistics | 550.51 | 574.42 | 4.3 | 32.36 | 34.06 | 5.2 |
| Trading & Commerce | 177.98 | 192.95 | 8.4 | 2.91 | 3.67 | 26.3 |
| Living Support | 63.01 | 68.50 | 8.7 | 1.16 | 1.88 | 61.9 |
| Business Support | 15.50 | 17.56 | 13.3 | 2.84 | 2.73 | -4.0 |
| Manufacturing | 47.11 | 45.76 | -2.9 | 0.31 | 0.66 | 115.0 |
| Non-Logistics total | 303.61 | 324.77 | 7.0 | 7.22 | 8.94 | 23.9 |
| Adjustment Amount | 0.43 | 0.43 | – | -4.64 | -6.01 | – |
| Total | 854.55 | 899.62 | 5.3 | 34.95 | 37.00 | 5.9 |
For the full year, the company attributes the ¥45.07 billion increase in operating revenue mainly to acquisition of new customers (¥50.31 billion), M&A (¥18.14 billion) and revision of freight charges and prices (¥12.35 billion), offset by changes in cargo volume from existing customers (-¥35.74 billion). On the operating profit side, revision of freight charges and prices contributed ¥12.35 billion and acquisition of new customers ¥5.72 billion, while changes in cargo volume from existing customers reduced profit by ¥6.05 billion, the impact of base pay increase and other personnel cost fluctuations by ¥3.64 billion, the rise in truck hiring expenses (including labor) by ¥3.78 billion and the impact of purchase price and forex fluctuations by ¥3.32 billion.
Balance Sheet and Cash Flows
Total assets stood at ¥822.02 billion, an increase of ¥103.28 billion, with total net assets of ¥264.18 billion (up ¥20.96 billion). The equity ratio was 27.6% at the end of the current fiscal year against 30.2% at the end of the previous fiscal year, interest-bearing debt was ¥332.84 billion (up ¥56.08 billion), and the net D/E ratio was 1.05 times against 0.95 times a year earlier. Cash flows from operating activities were ¥61.12 billion (¥44.72 billion in the previous fiscal year), cash flows from investing activities were -¥61.86 billion (-¥58.02 billion), cash flows from financing activities were ¥21.22 billion (¥0.45 billion), and cash and cash equivalents at the end of the fiscal year were ¥89.36 billion (¥67.31 billion). Main items included purchase of property, plant and equipment of -¥42.84 billion, purchase of shares of subsidiaries of -¥17.76 billion, issuance of bonds of ¥34.83 billion and purchase of treasury shares of -¥8.50 billion.
FY 3/2027 Forecast
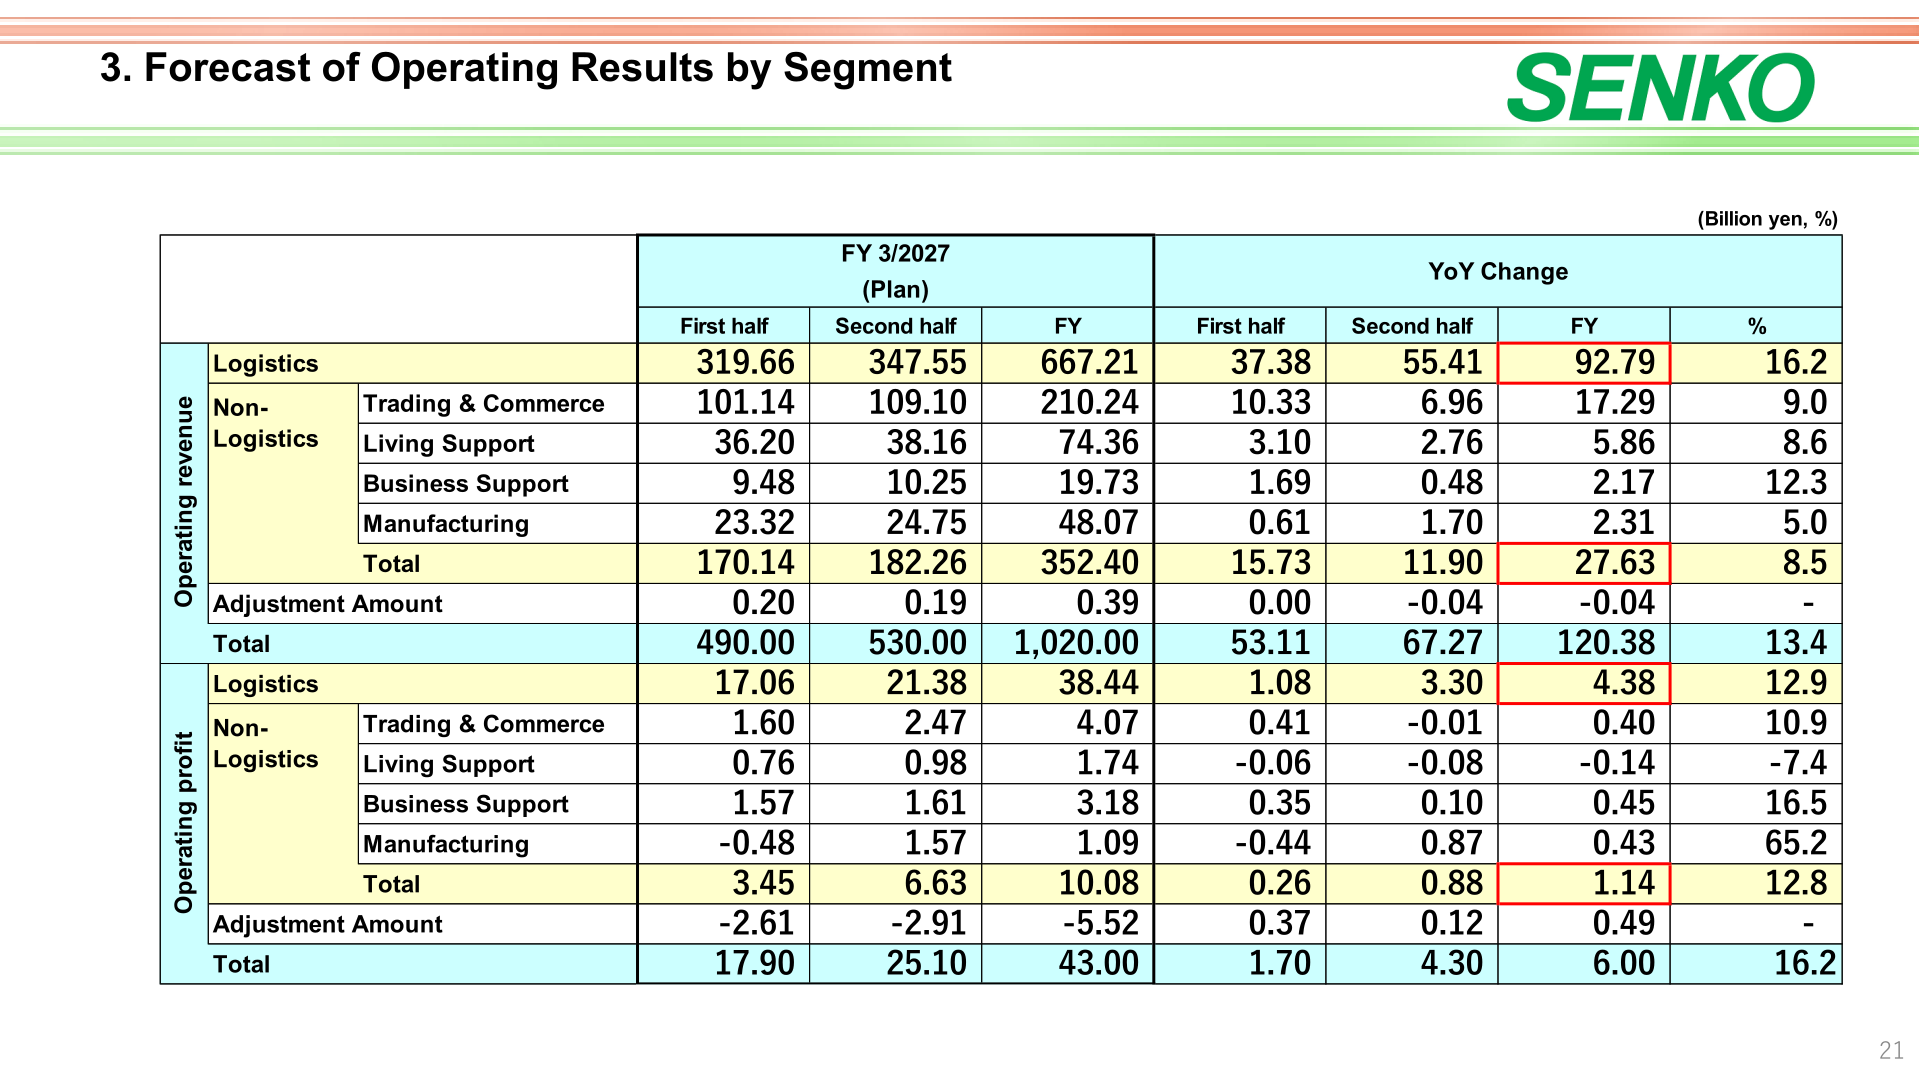
For the fiscal year ending March 31, 2027 the company plans operating revenue of ¥1,020,000 million (up 13.4%), operating profit of ¥43,000 million (up 16.2%), ordinary profit of ¥39,300 million (up 11.5%) and profit attributable to owners of parent of ¥23,400 million (up 21.1%), with an operating margin of 4.2%. By half, the plan is operating revenue of ¥490,000 million and operating profit of ¥17,900 million in the first half, and operating revenue of ¥530,000 million and operating profit of ¥25,100 million in the second half. The company cites promotion of sales expansion, M&A, revision of freight charges and prices, and rationalization and efficiency improvement as the drivers.
| Item (Million yen, %) | FY 3/2026 (Actual) | Margin | FY 3/2027 (Plan) | Margin | YoY Change | % |
|---|---|---|---|---|---|---|
| Operating revenue | 899,620 | - | 1,020,000 | - | 120,380 | 13.4 |
| Operating profit | 36,996 | 4.1 | 43,000 | 4.2 | 6,004 | 16.2 |
| Ordinary profit | 35,242 | 3.9 | 39,300 | 3.9 | 4,058 | 11.5 |
| Profit attributable to owners of parent | 19,320 | 2.1 | 23,400 | 2.3 | 4,080 | 21.1 |
| Segment (Billion yen, %) | Operating revenue FY 3/2027 (Plan) | YoY % | Operating profit FY 3/2027 (Plan) | YoY % |
|---|---|---|---|---|
| Logistics | 667.21 | 16.2 | 38.44 | 12.9 |
| Trading & Commerce | 210.24 | 9.0 | 4.07 | 10.9 |
| Living Support | 74.36 | 8.6 | 1.74 | -7.4 |
| Business Support | 19.73 | 12.3 | 3.18 | 16.5 |
| Manufacturing | 48.07 | 5.0 | 1.09 | 65.2 |
| Non-Logistics total | 352.40 | 8.5 | 10.08 | 12.8 |
| Adjustment Amount | 0.39 | – | -5.52 | – |
| Total | 1,020.00 | 13.4 | 43.00 | 16.2 |
Of the planned ¥120.38 billion increase in operating revenue, the company attributes ¥74.70 billion to M&A, ¥39.04 billion to acquisition of new customers and ¥11.06 billion to revision of freight charges and prices. Within Logistics, planned operating revenue by area is domestic logistics ¥449.56 billion, cold chain logistics ¥92.80 billion, international logistics ¥79.12 billion and maritime transport ¥45.73 billion. General capital investment is planned at ¥38.78 billion (¥41.64 billion actual in the fiscal year ended March 31, 2026), broken down into vehicles ¥9.68 billion, cargo-handling equipment and other ¥19.86 billion, large-scale facilities ¥5.99 billion and non-production facilities (EDP-related, etc.) ¥3.25 billion, with depreciation planned at ¥37.23 billion against ¥32.53 billion in the fiscal year ended March 31, 2026.
Shareholder Returns
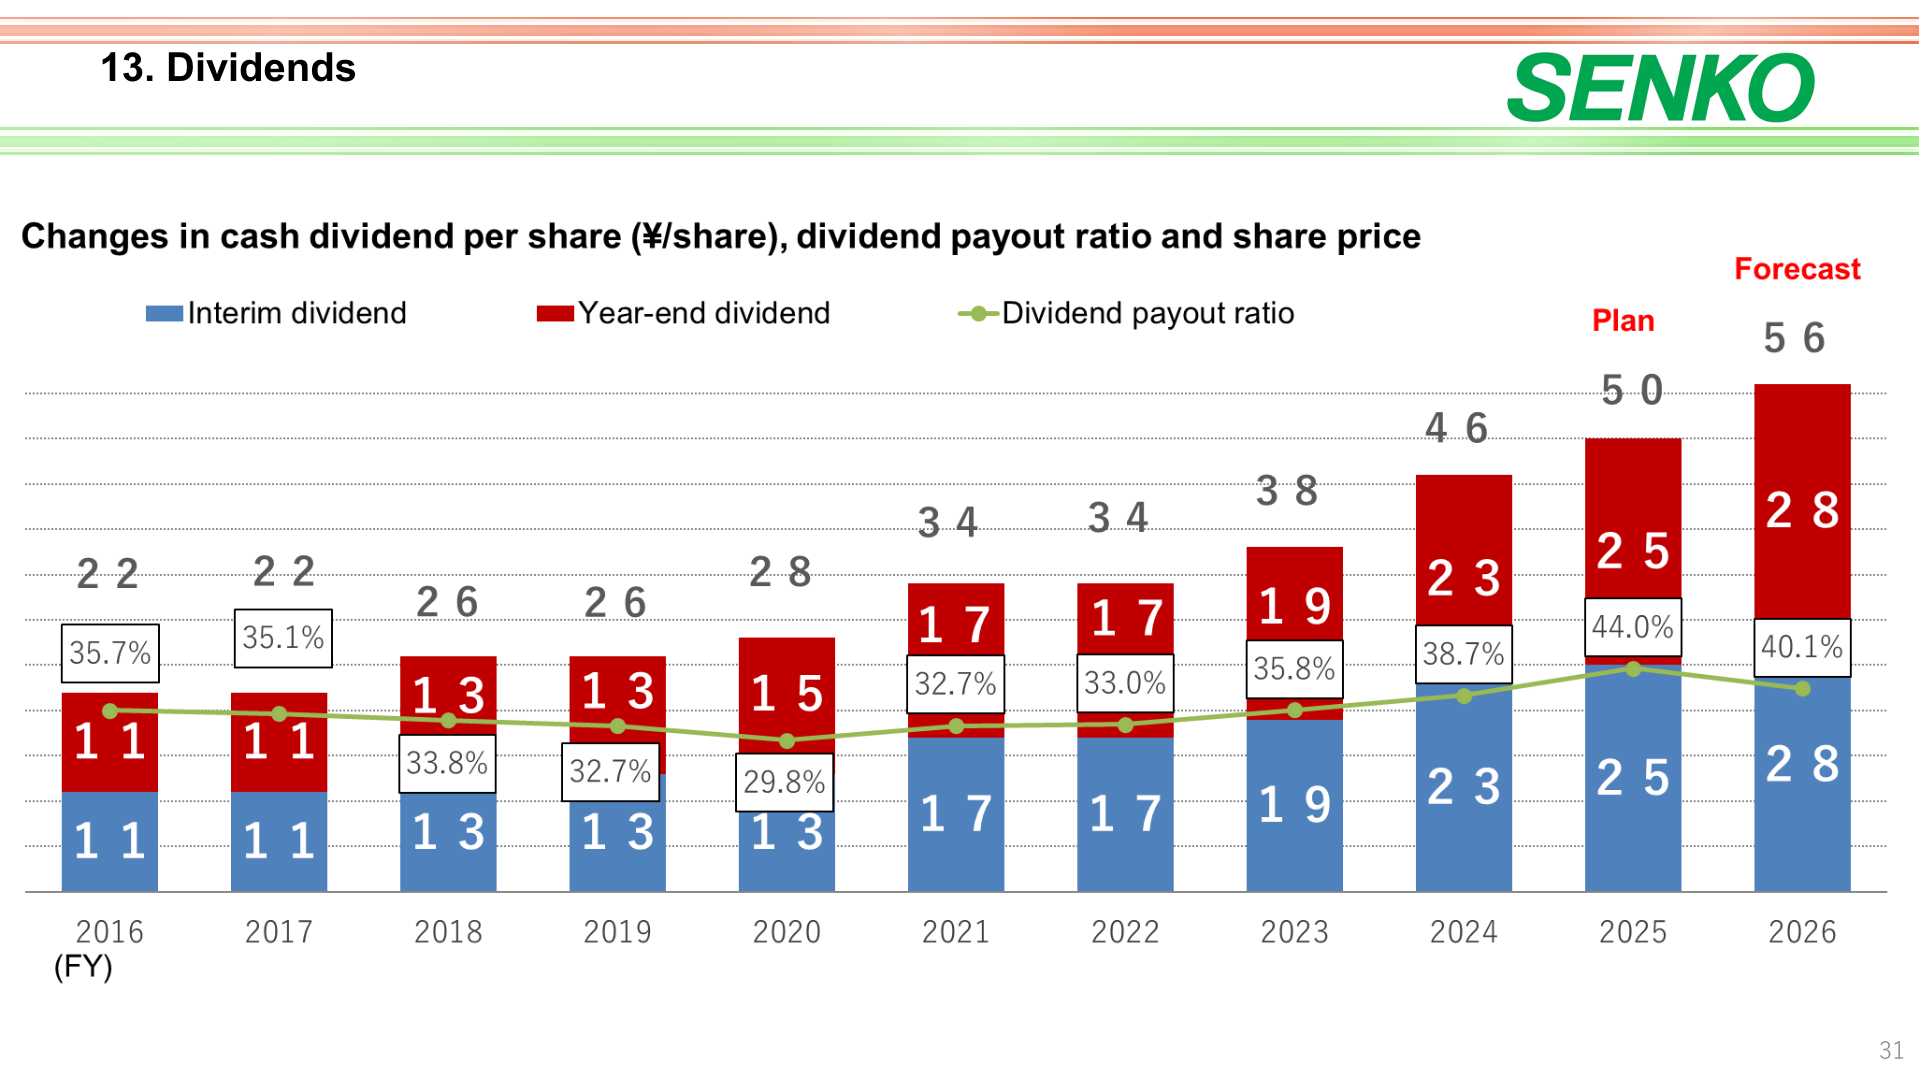
For the fiscal year ended March 31, 2026 the annual dividend is ¥50 per share (plan), consisting of an interim dividend of ¥25 and a year-end dividend of ¥25, for a dividend payout ratio of 44.0%. For the fiscal year ending March 31, 2027 the company forecasts an annual dividend of ¥56 per share, consisting of an interim dividend of ¥28 and a year-end dividend of ¥28, for a dividend payout ratio of 40.1%. On the same dividend chart, the preceding FY2024 column shows an annual dividend of ¥46 per share (interim ¥23, year-end ¥23) with a dividend payout ratio of 38.7%. Purchase of treasury shares of ¥8.50 billion is shown in financing cash flows for the fiscal year ended March 31, 2026, and the company’s initiatives to enhance corporate value set a dividend payout ratio target of 40%.
Initiatives to Enhance Corporate Value
The company sets out an operating margin target of 4.5% or more, an ROE target of 10% or more, a dividend payout ratio target of 40%, and a PBR that it aims to maintain and further improve at least 1 times on an ongoing basis. It states that its cost of shareholders’ equity is approximately 8% and that it recognizes this as on par with the market’s expected level; the ROE chart shows 8.7% for FY3/2026, and the company states that ROIC for the fiscal year ended March 31, 2026 is 4.5% and is expected to improve through profitability enhancements in businesses that require improved profitability. Over the four years from FY2022 to FY2025 the company invested ¥78.2 billion and conducted M&A with 24 companies; operating profit from those 24 companies increased by ¥4.0 billion over four years, raising the overall profit margin by 0.1 percentage points.
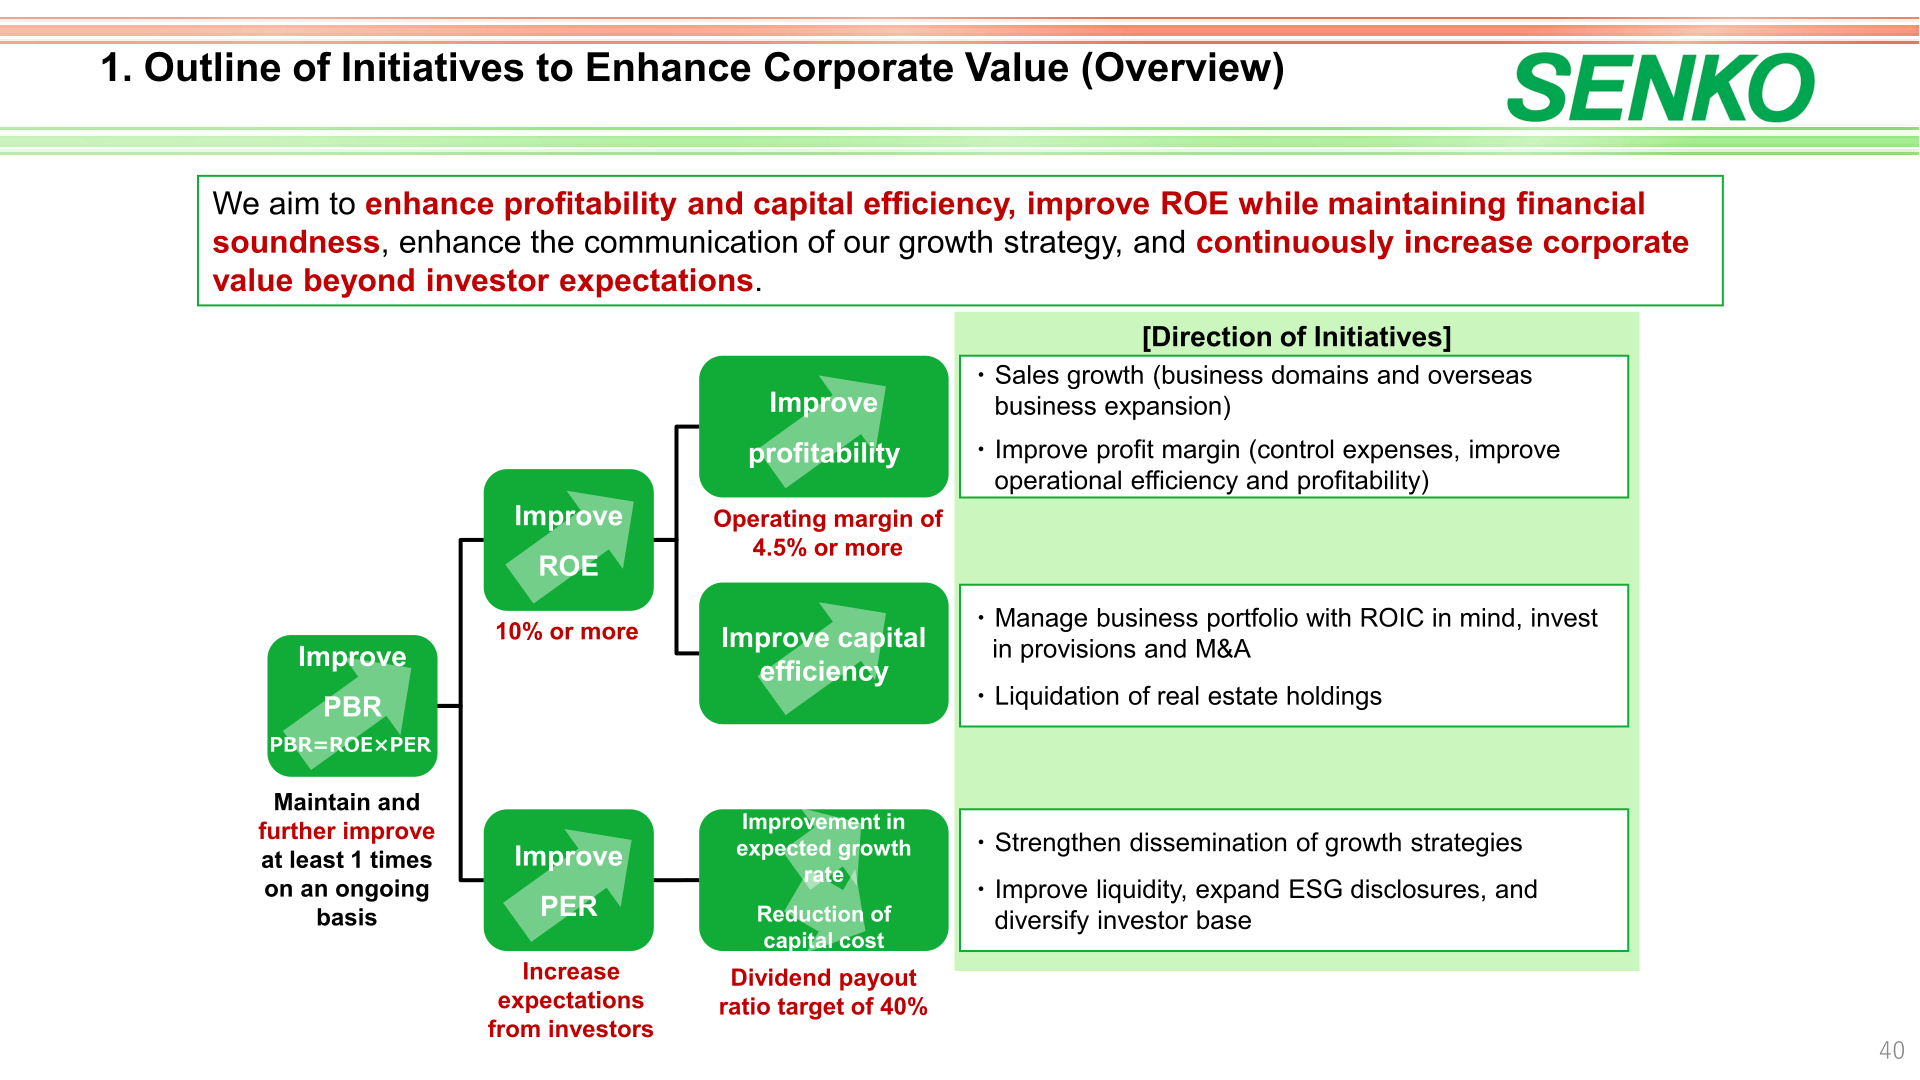
On capital allocation, the company reports that investment of ¥186.4 billion was completed by the end of March 2026 against planned capital investment of ¥200 billion, and that strategic investment totalled ¥86.1 billion (¥50.2 billion in M&A of logistics business and ¥35.9 billion in M&A of non-logistics business), for total uses of funds of ¥272.5 billion between April 2022 and March 2026.
Topics: M&A, Restructuring and Governance
Companies newly consolidated in the P/L for FY2026 include Maruwn Corporation and Total Fresh Connection Pte Ltd (from April 2026), Umios Logistics Corporation (from October 2026, plan), K.K. CLEANSTAR (from January 2026), Toho Sogo Security Guard Inc., Vérité Co., Ltd. and PDS International Pvt. Ltd. (from October 2025). The company acquired 51% of the shares of Umios Logistics Corporation, which recorded operating revenue of ¥25,352 million and operating profit of ¥2,524 million in FY 3/2025 and had 900 employees as of April 1, 2026, from its parent company Umios Corporation.
In Manufacturing, structural reforms at Chuo Kagaku Co., Ltd. involve consolidation of production sites and in-house production of certain products; an extraordinary loss of ¥740 million was recorded in the fiscal year ended March 31, 2026, and a P&L improvement effect of approximately ¥650 million per year is expected from the fiscal year ending March 31, 2028 onwards. In Living Support, S-Life Partners Co., Ltd. (renamed from SERIO Holdings Co., Ltd. effective April 1, 2026) is positioned as the core company of the business, and in Trading & Commerce, SENKO SHOJI CO.,LTD. merged with SIT on April 1, 2026. On governance, the company will propose reducing the term of directors from two years to one year and appointing one additional independent outside director at the 2026 Annual Meeting of Shareholders, which would make independent outside directors half of the Board of Directors.
As of March 31, 2026 the group comprised 214 companies (Logistics 138, Trading & Commerce 22, Living Support 19, Business Support 26, Manufacturing 9, including 18 non-consolidated companies), 8,502 group vehicles (trailer heads only; 10,999 including trailers), 48 owned ships and 92 controlled ships, total storage area of 5.37 million square metres and 27,835 group employees excluding part-time workers.
This article is an analysis based on publicly available information and is not a recommendation to buy or sell any specific securities. Investment decisions are your own responsibility.
![[Obayashi] Investors’ Guide 2026 — The Complete 24-Article Breakdown](https://japan-equity.com/wp-content/uploads/2026/07/hub_cover-1024x1024.png)
![[Obayashi] IR & SR Policy — Feeding Dialogue Back into Management](https://japan-equity.com/wp-content/uploads/2026/07/p32_sq-1024x1024.jpg)
![[Obayashi] Domestic Civil Engineering — Resilience Spending Supports 9.6% Margin](https://japan-equity.com/wp-content/uploads/2026/07/p11_sq-1024x1024.jpg)
![[Obayashi] Overseas Construction — Orders Reach ¥1.2tn](https://japan-equity.com/wp-content/uploads/2026/07/p15_sq-1024x1024.jpg)
![[Obayashi] Share Price & External Ratings — vs TOPIX, ESG Index Inclusion](https://japan-equity.com/wp-content/uploads/2026/07/p40_sq-1024x1024.jpg)
![[Construction] ¥75.5tn Investment, Shrinking Workforce — Big-5 Market Share](https://japan-equity.com/wp-content/uploads/2026/07/p12_sq-1024x1024.jpg)



![[Obayashi] Capital Policy & Shareholder Returns — ROE 10%+, DOE ~5%, ¥100bn Buyback](https://japan-equity.com/wp-content/uploads/2026/07/p27_sq-1024x1024.jpg)
![[Obayashi] Reducing Cross-Shareholdings — ¥285.2bn Sold in Five Years](https://japan-equity.com/wp-content/uploads/2026/07/p29_sq-1024x1024.jpg)
![[Obayashi] ¥750bn Investment Plan — ¥300bn to Development, ¥190bn to Tech/DX](https://japan-equity.com/wp-content/uploads/2026/07/p30_sq-1024x1024.jpg)
![[Obayashi] MTP2022 KPIs — Operating Profit ~2x Target, ROE 14.4%](https://japan-equity.com/wp-content/uploads/2026/07/p25_sq-1024x1024.jpg)
![[Obayashi] Cash Allocation — ¥420bn Investment CF Over Five Years](https://japan-equity.com/wp-content/uploads/2026/07/p26_sq-1024x1024.jpg)
![[Obayashi] Green Energy — 44 Plants, 344MW, and the Green Hydrogen Challenge](https://japan-equity.com/wp-content/uploads/2026/07/p21_sq-1024x1024.jpg)
![[Obayashi] Tackling the Labor Shortage — Robotics Construction®](https://japan-equity.com/wp-content/uploads/2026/07/p14_sq-1024x1024.jpg)
