
This article is based on publicly available IR materials and is not a recommendation to buy or sell any specific securities.
The 77 Bank, Ltd. reported record-high profit attributable to owners of the parent for the fifth consecutive year in the fiscal year ended March 31, 2026, which the Bank labels FY2025 in its IR presentation dated June 2, 2026. Consolidated profit attributable to owners of the parent rose to JPY 54.0 bn from JPY 39.3 bn, and consolidated ordinary profits rose to JPY 78.5 bn from JPY 56.3 bn. The Bank states that the record result was achieved mainly because of increased interest on loans and bills discounted and profit on investment in securities. For FY2026 the Bank expects record-high profit again, mainly because of increased loans and improved yields of loans and bills discounted, and it has revised its Policy on Return of Profits to Shareholders to target a dividend payout ratio of 40% or more by FY2027.
Consolidated Results (Full-Year Actual)
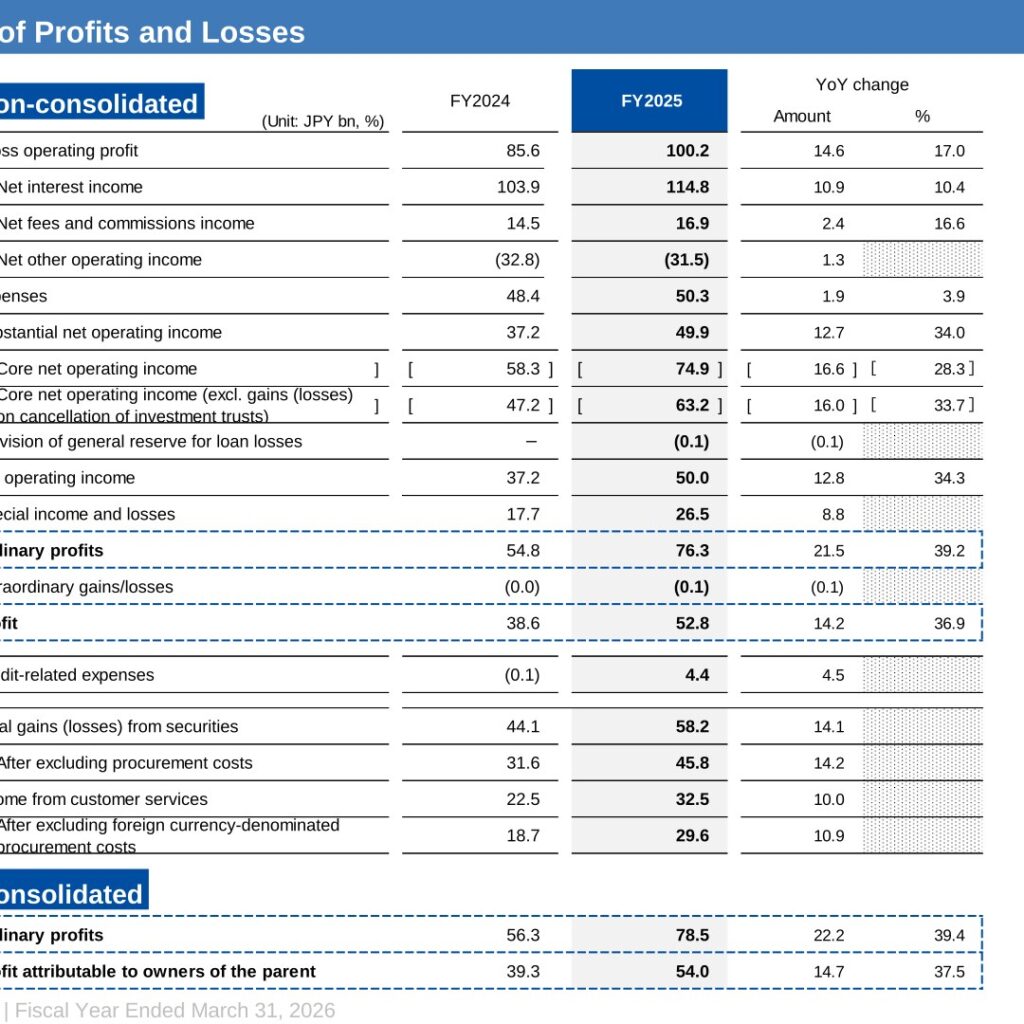
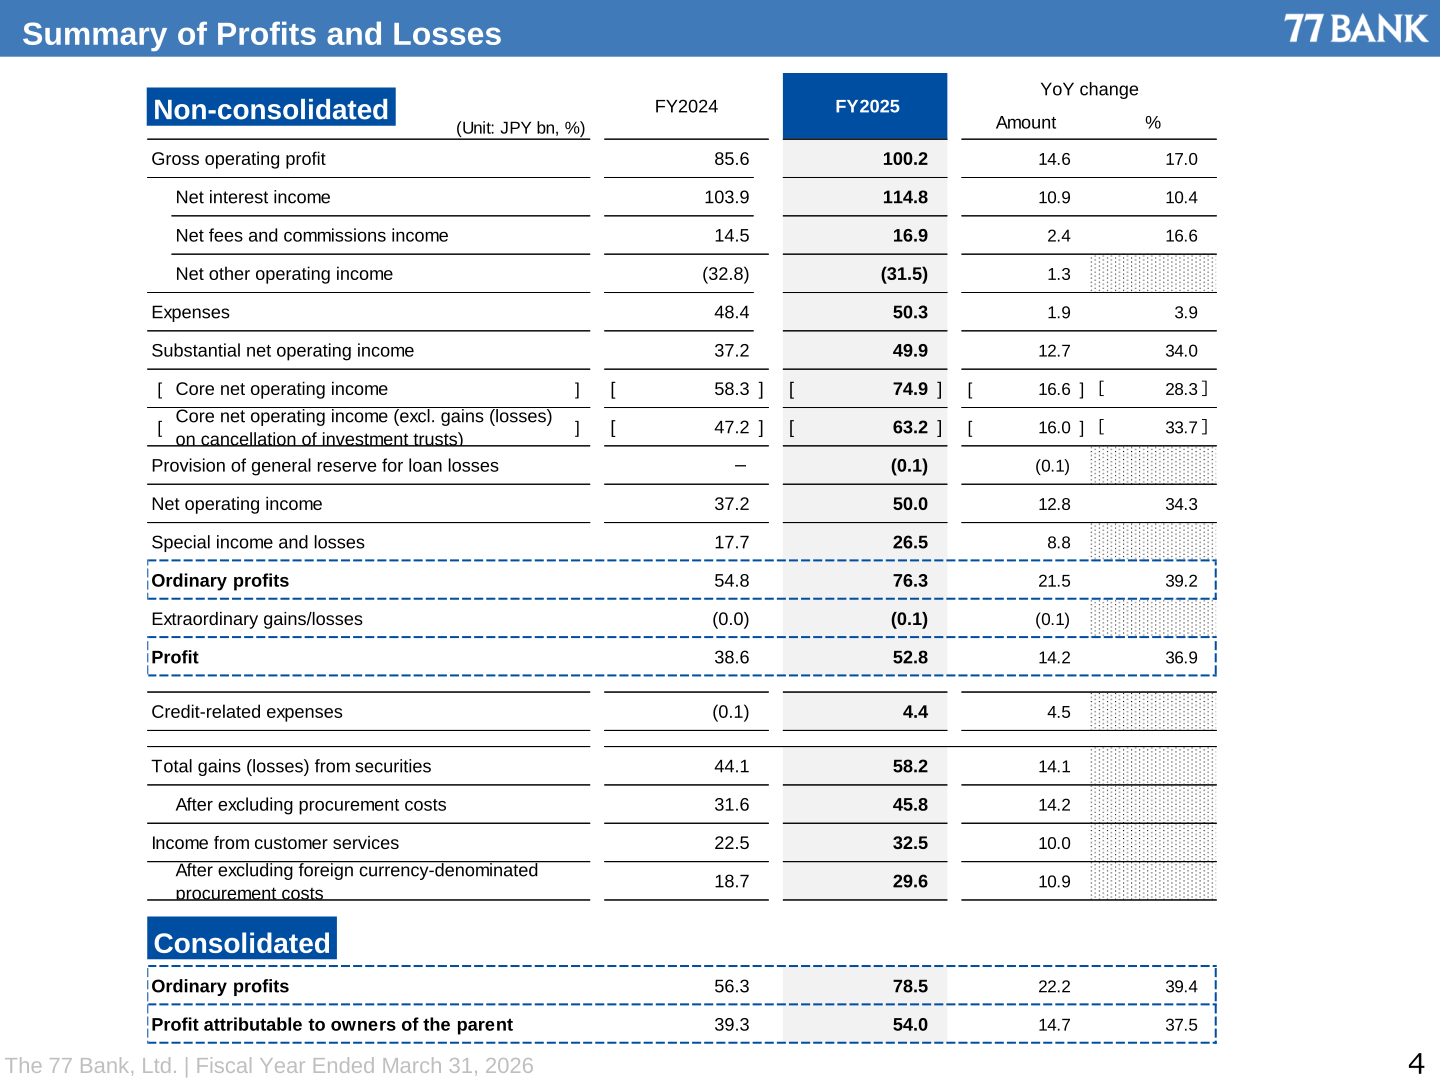
On a non-consolidated basis, gross operating profit increased 17.0% to JPY 100.2 bn, while expenses rose 3.9% to JPY 50.3 bn. Substantial net operating income increased 34.0% to JPY 49.9 bn, and core net operating income was JPY 74.9 bn (JPY 63.2 bn excluding gains (losses) on cancellation of investment trusts). Non-consolidated ordinary profits rose 39.2% to JPY 76.3 bn and profit rose 36.9% to JPY 52.8 bn. Income from customer services improved to JPY 32.5 bn from JPY 22.5 bn, and to JPY 29.6 bn from JPY 18.7 bn after excluding foreign currency-denominated procurement costs. Credit-related expenses swung to a charge of JPY 4.4 bn from JPY (0.1) bn.
| Item (Unit: JPY bn, %) | FY2024 | FY2025 | YoY change (Amount) | YoY change (%) |
|---|---|---|---|---|
| Gross operating profit (non-consolidated) | 85.6 | 100.2 | 14.6 | 17.0 |
| Net interest income | 103.9 | 114.8 | 10.9 | 10.4 |
| Net fees and commissions income | 14.5 | 16.9 | 2.4 | 16.6 |
| Net other operating income | (32.8) | (31.5) | 1.3 | — |
| Expenses | 48.4 | 50.3 | 1.9 | 3.9 |
| Substantial net operating income | 37.2 | 49.9 | 12.7 | 34.0 |
| [ Core net operating income ] | [ 58.3 ] | [ 74.9 ] | [ 16.6 ] | [ 28.3 ] |
| [ Core net operating income (excl. gains (losses) on cancellation of investment trusts) ] | [ 47.2 ] | [ 63.2 ] | [ 16.0 ] | [ 33.7 ] |
| Net operating income | 37.2 | 50.0 | 12.8 | 34.3 |
| Special income and losses | 17.7 | 26.5 | 8.8 | — |
| Ordinary profits (non-consolidated) | 54.8 | 76.3 | 21.5 | 39.2 |
| Profit (non-consolidated) | 38.6 | 52.8 | 14.2 | 36.9 |
| Credit-related expenses | (0.1) | 4.4 | 4.5 | — |
| Total gains (losses) from securities | 44.1 | 58.2 | 14.1 | — |
| After excluding procurement costs | 31.6 | 45.8 | 14.2 | — |
| Income from customer services | 22.5 | 32.5 | 10.0 | — |
| Ordinary profits (consolidated) | 56.3 | 78.5 | 22.2 | 39.4 |
| Profit attributable to owners of the parent (consolidated) | 39.3 | 54.0 | 14.7 | 37.5 |
Net Interest Income, Loans and Deposits
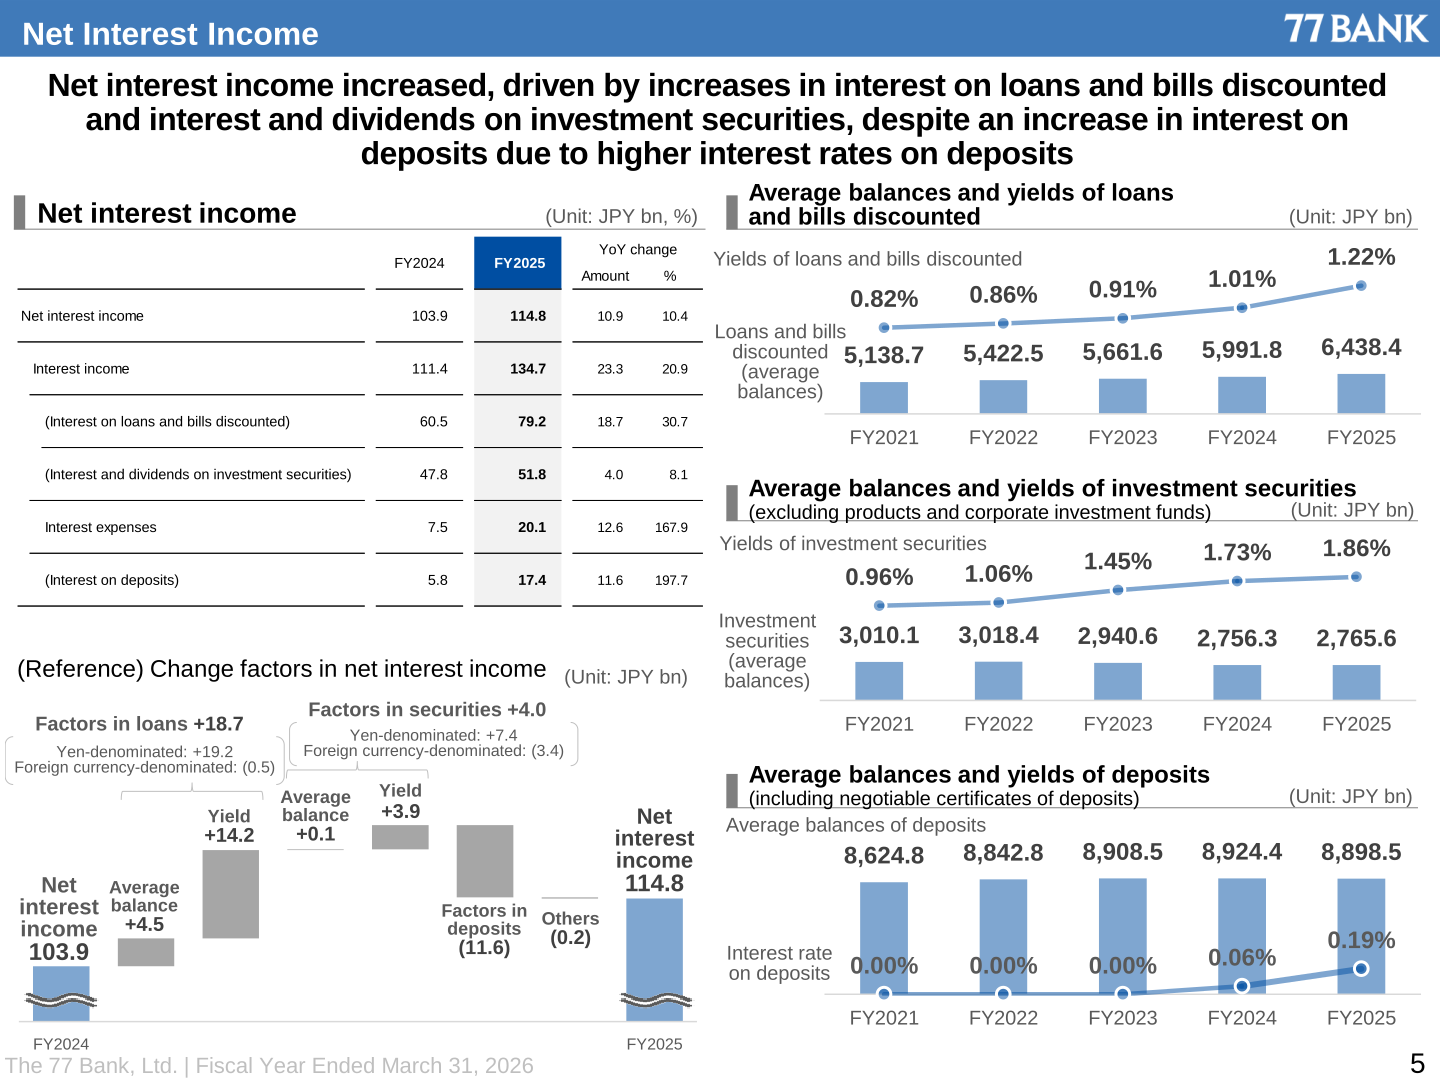
Net interest income increased, driven by increases in interest on loans and bills discounted and interest and dividends on investment securities, despite an increase in interest on deposits due to higher interest rates on deposits. Average balances of loans and bills discounted grew 7.4% to JPY 6,438.4 bn and the overall yield rose to 1.22% from 1.01%, with yen-denominated corporate loan average balances up 11.2% to JPY 4,468.3 bn. Average balances of deposits (including negotiable certificates of deposits) were JPY 8,898.5 bn and the interest rate on deposits rose to 0.19% from 0.06%. Average balances of investment securities were JPY 2,765.6 bn with a yield of 1.86%. The balance of investment securities on an amortized cost basis was JPY 2,781.2 bn at end-March 2026, down 1.7% year on year.
| Item (Unit: JPY bn, %) | FY2024 | FY2025 | YoY change (Amount) | YoY change (%) |
|---|---|---|---|---|
| Net interest income | 103.9 | 114.8 | 10.9 | 10.4 |
| Interest income | 111.4 | 134.7 | 23.3 | 20.9 |
| (Interest on loans and bills discounted) | 60.5 | 79.2 | 18.7 | 30.7 |
| (Interest and dividends on investment securities) | 47.8 | 51.8 | 4.0 | 8.1 |
| Interest expenses | 7.5 | 20.1 | 12.6 | 167.9 |
| (Interest on deposits) | 5.8 | 17.4 | 11.6 | 197.7 |
| Loans and bills discounted (average balances) | 5,991.8 | 6,438.4 | — | [+7.4%] |
| Yields of loans and bills discounted | 1.01% | 1.22% | — | — |
| Investment securities (average balances) | 2,756.3 | 2,765.6 | — | — |
| Yields of investment securities | 1.73% | 1.86% | — | — |
| Deposits (average balances, incl. NCDs) | 8,924.4 | 8,898.5 | — | [(0.2)%] |
| Interest rate on deposits | 0.06% | 0.19% | — | — |
Fees, Expenses and Credit-Related Expenses
Net fees and commissions rose to JPY 16.9 bn from JPY 14.5 bn, with fees and commissions income up JPY 2.7 bn to JPY 24.5 bn. Fees and commissions from corporate clients increased to JPY 5.7 bn from JPY 4.8 bn and financing fee-type housing loan fees rose to JPY 2.2 bn from JPY 0.7 bn. Group companies’ revenue increased to JPY 8.0 bn from JPY 7.1 bn. Expenses rose to JPY 50.3 bn from JPY 48.4 bn, with personnel expenses at JPY 25.5 bn, non-personnel expenses at JPY 20.8 bn (of which system-related expenses JPY 9.5 bn) and tax at JPY 4.0 bn; core OHR improved to 40.20% from 45.34%. Credit-related expenses were JPY 4.4 bn against JPY (0.1) bn a year earlier, as specific reserve for loan losses increased because the number of bankruptcies and discontinued businesses remained high. The ratio of reserve for loan losses was 0.9%, the same level as the previous fiscal year, and disclosed claims under the Financial Reconstruction Law were JPY 125.1 bn at end-March 2026, a ratio of 1.86%.
Group Company Results
The presentation discloses profits and losses for the Group’s finance and non-finance subsidiaries. 77 Lease posted the largest operating revenue at JPY 12,672 mn with profit of JPY 471 mn, while 77 Securities lifted profit to JPY 243 mn on operating revenue of JPY 1,445 mn. 77 NEXT CONSULTING, established in January 2025 with a fiscal year ending on December 31, recorded operating revenue of JPY 168 mn.
| Group company (Unit: JPY mn) | Operating revenue FY2025 | YoY change | Profit FY2025 | YoY change |
|---|---|---|---|---|
| 77 Lease | 12,672 | 737 | 471 | 197 |
| 77 Shin-Yo Hosyo | 1,752 | 75 | 908 | 40 |
| 77 Card | 2,140 | 81 | 143 | (51) |
| 77 Securities | 1,445 | 310 | 243 | 157 |
| 77 Research and Consulting | 838 | 111 | 164 | 34 |
| 77 Partners | 129 | 59 | 36 | 33 |
| 77 Human Design | 119 | 24 | (50) | (72) |
| 77 Digital Solutions | 156 | 48 | 25 | 34 |
| 77 Insurance Service | 193 | 118 | (39) | 60 |
| 77 Business With | 78 | 49 | (17) | 4 |
| 77 NEXT CONSULTING | 168 | ― | 2 | ― |
| 77 Capital | 92 | 7 | 6 | (2) |
FY2026 Forecast
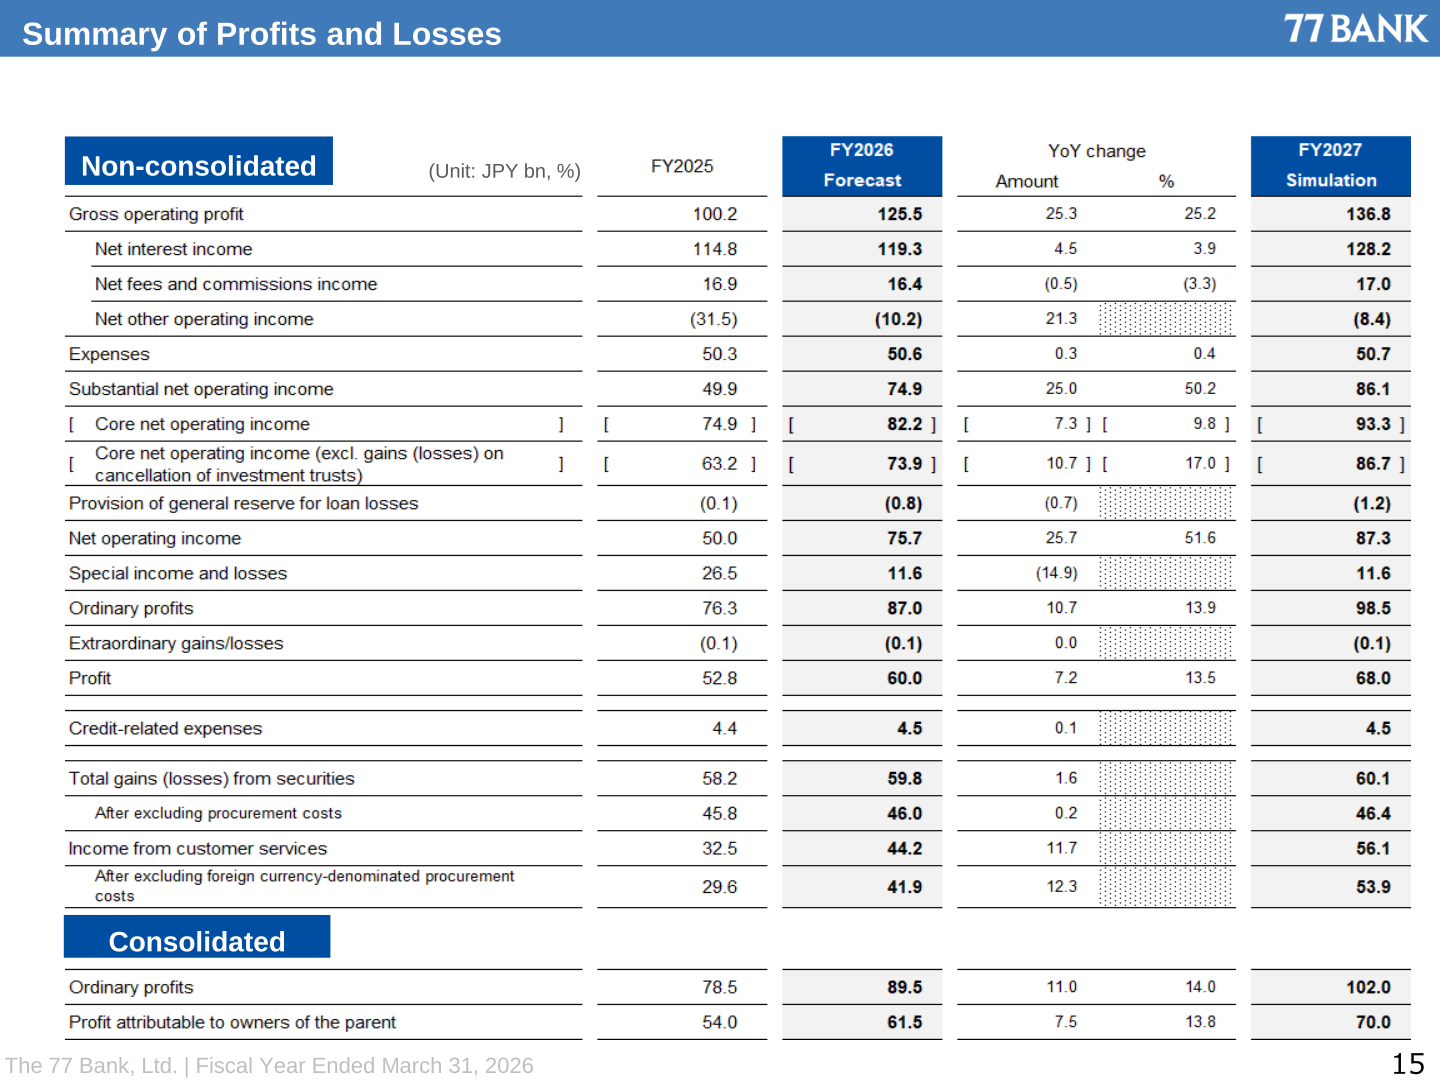
For FY2026 the Bank forecasts non-consolidated gross operating profit of JPY 125.5 bn (up 25.2%), expenses of JPY 50.6 bn, ordinary profits of JPY 87.0 bn and profit of JPY 60.0 bn. On a consolidated basis, ordinary profits are forecast at JPY 89.5 bn and profit attributable to owners of the parent at JPY 61.5 bn, up 13.8%. The presentation also shows an FY2027 simulation, with consolidated ordinary profits of JPY 102.0 bn and profit attributable to owners of the parent of JPY 70.0 bn. The interest rate assumption is that the benchmark interest rate will rise to 1.00%, effective October 2026.
| Item (Unit: JPY bn, %) | FY2025 | FY2026 Forecast | YoY change (Amount) | YoY change (%) | FY2027 Simulation |
|---|---|---|---|---|---|
| Gross operating profit (non-consolidated) | 100.2 | 125.5 | 25.3 | 25.2 | 136.8 |
| Net interest income | 114.8 | 119.3 | 4.5 | 3.9 | 128.2 |
| Net fees and commissions income | 16.9 | 16.4 | (0.5) | (3.3) | 17.0 |
| Net other operating income | (31.5) | (10.2) | 21.3 | — | (8.4) |
| Expenses | 50.3 | 50.6 | 0.3 | 0.4 | 50.7 |
| Substantial net operating income | 49.9 | 74.9 | 25.0 | 50.2 | 86.1 |
| Ordinary profits (non-consolidated) | 76.3 | 87.0 | 10.7 | 13.9 | 98.5 |
| Profit (non-consolidated) | 52.8 | 60.0 | 7.2 | 13.5 | 68.0 |
| Credit-related expenses | 4.4 | 4.5 | 0.1 | — | 4.5 |
| Total gains (losses) from securities | 58.2 | 59.8 | 1.6 | — | 60.1 |
| Income from customer services | 32.5 | 44.2 | 11.7 | — | 56.1 |
| Ordinary profits (consolidated) | 78.5 | 89.5 | 11.0 | 14.0 | 102.0 |
| Profit attributable to owners of the parent (consolidated) | 54.0 | 61.5 | 7.5 | 13.8 | 70.0 |
Shareholder Returns
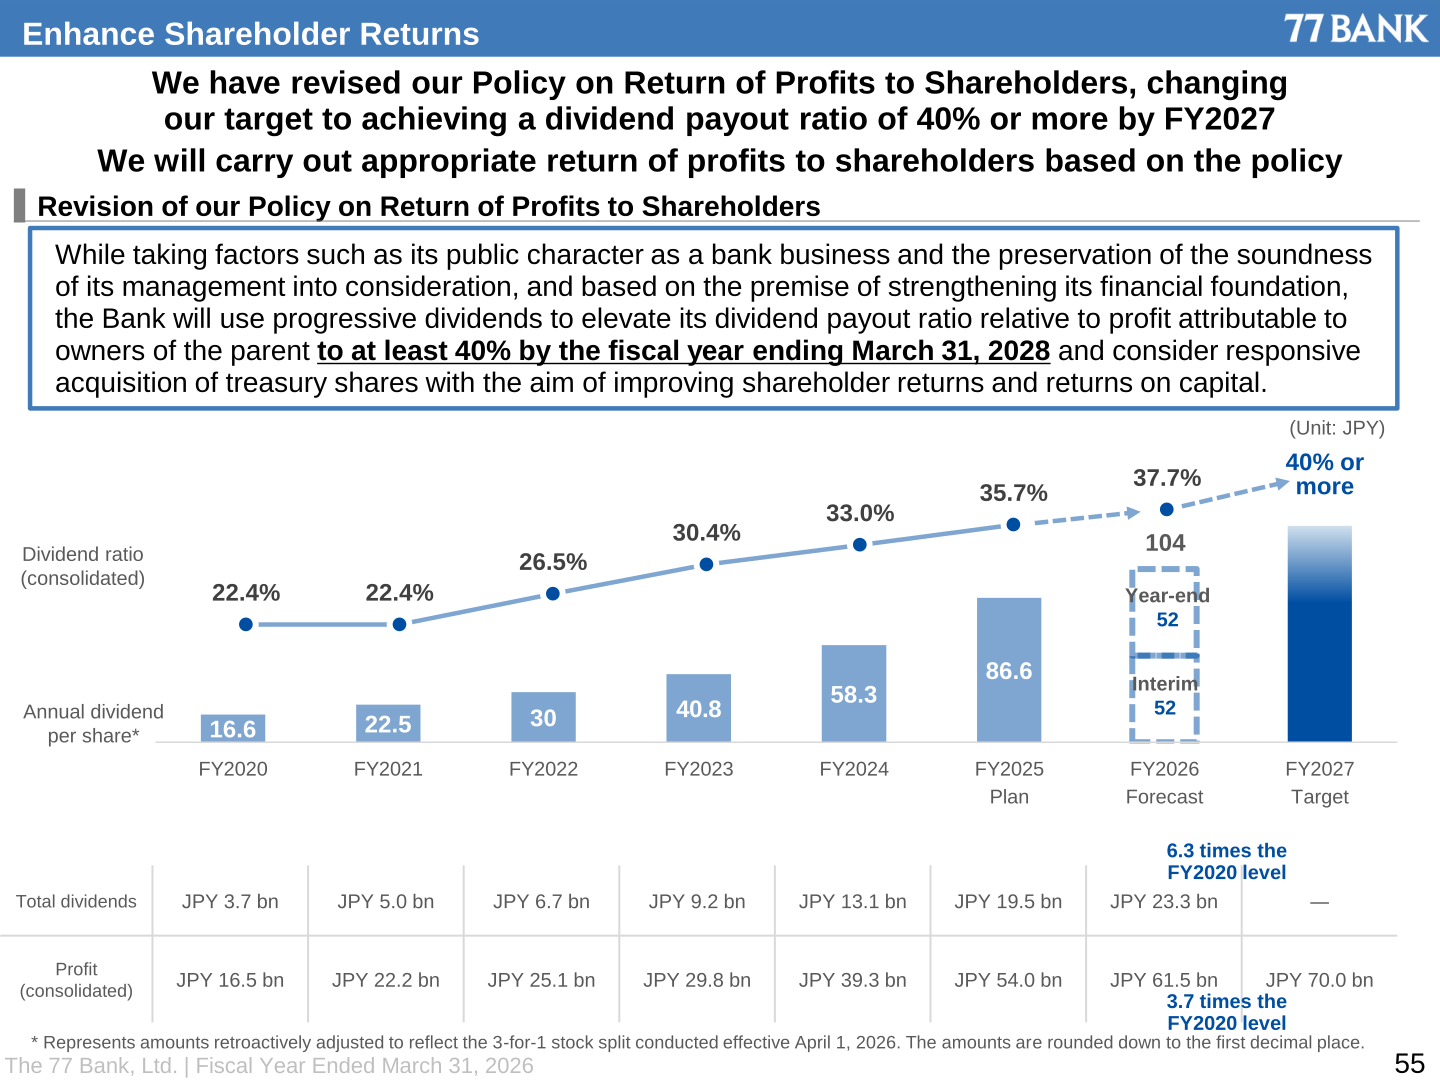
The Bank achieved its target dividend ratio of 35% or more, with a FY2025 dividend ratio of 35.7%, and has revised its Policy on Return of Profits to Shareholders. Under the revised policy, while taking factors such as its public character as a bank business and the preservation of the soundness of its management into consideration, and based on the premise of strengthening its financial foundation, the Bank will use progressive dividends to elevate its dividend payout ratio relative to profit attributable to owners of the parent to at least 40% by the fiscal year ending March 31, 2028, and consider responsive acquisition of treasury shares with the aim of improving shareholder returns and returns on capital. The FY2025 annual dividend per share is JPY 86.6 (plan) and the FY2026 forecast is JPY 104 (interim JPY 52, year-end JPY 52), 6.3 times the FY2020 level. Per-share amounts are retroactively adjusted to reflect the 3-for-1 stock split conducted effective April 1, 2026 and are rounded down to the first decimal place.
| Item | FY2024 | FY2025 (Plan) | FY2026 (Forecast) | FY2027 (Target) |
|---|---|---|---|---|
| Annual dividend per share (Unit: JPY) | 58.3 | 86.6 | 104 | — |
| Dividend ratio (consolidated) | 33.0% | 35.7% | 37.7% | 40% or more |
| Total dividends | JPY 13.1 bn | JPY 19.5 bn | JPY 23.3 bn | ― |
| Profit (consolidated) | JPY 39.3 bn | JPY 54.0 bn | JPY 61.5 bn | JPY 70.0 bn |
“Vision 2030” (R.V.) Financial Targets
With five years passed since the launch of “Vision 2030”, the Bank states that profitability and productivity have increased significantly, and it has revised its financial targets for FY2030 to profit of JPY 90.0 bn, ROE of 10% and core OHR of no more than 35%. FY2025 results against these indicators were PBR of 0.98x, consolidated ROE of 8.53%, consolidated profit of JPY 54.0 bn, core OHR of 40.20%, consolidated capital adequacy ratio of 10.58%, a cross-shareholdings ratio to consolidated net assets of 8.5%, a consolidated dividend ratio of 35.7% and PER of 12.61x. Consolidated ROE is projected at 8.62% for FY2026 and 9.18% in the FY2027 simulation. On capital, the Bank notes that its capital adequacy ratio must be sufficient for supporting the region during emergencies in light of the impact of the Great East Japan Earthquake, when the capital adequacy ratio decreased by roughly 1.6%; accordingly the FY2030 target has been set at around 10% (10.0 to 10.5%), with a management range during the plan of 9.5% to 10.5%.
| Indicator | FY2025 | “Vision 2030” (R.V.) financial targets, etc. | (Reference) Targets before review |
|---|---|---|---|
| PBR | 0.98x | Greater than 1.0x | Greater than 1.0x |
| ROE (consolidated) | 8.53% | 10% | 7% or more |
| Profit (consolidated) | JPY 54.0 bn | JPY 90.0 bn | JPY 45.0 bn |
| Core OHR | 40.20% | No more than 35% | No more than 40% |
| Capital adequacy ratio (consolidated) | 10.58% | Roughly 10% [10.0%–10.5%] | Roughly 10% [10.0%–10.5%] |
| Cross-shareholdings Ratio to net assets (consolidated) | 8.5% | Continue to reduce | Continue to reduce (Below 10%) |
| Dividend ratio (consolidated) | 35.7% | 40% or more (End-Mar. 2028) | 35% or more |
| PER | 12.61x | Greater than 10x (Theoretical value) | 14.3x or more (Theoretical value) |
This article is an analysis based on publicly available information and is not a recommendation to buy or sell any specific securities. Investment decisions are your own responsibility.
![[Obayashi] Investors’ Guide 2026 — The Complete 24-Article Breakdown](https://japan-equity.com/wp-content/uploads/2026/07/hub_cover-1024x1024.png)
![[Obayashi] IR & SR Policy — Feeding Dialogue Back into Management](https://japan-equity.com/wp-content/uploads/2026/07/p32_sq-1024x1024.jpg)
![[Obayashi] Domestic Civil Engineering — Resilience Spending Supports 9.6% Margin](https://japan-equity.com/wp-content/uploads/2026/07/p11_sq-1024x1024.jpg)
![[Obayashi] Overseas Construction — Orders Reach ¥1.2tn](https://japan-equity.com/wp-content/uploads/2026/07/p15_sq-1024x1024.jpg)
![[Obayashi] Share Price & External Ratings — vs TOPIX, ESG Index Inclusion](https://japan-equity.com/wp-content/uploads/2026/07/p40_sq-1024x1024.jpg)
![[Construction] ¥75.5tn Investment, Shrinking Workforce — Big-5 Market Share](https://japan-equity.com/wp-content/uploads/2026/07/p12_sq-1024x1024.jpg)



![[Obayashi] Capital Policy & Shareholder Returns — ROE 10%+, DOE ~5%, ¥100bn Buyback](https://japan-equity.com/wp-content/uploads/2026/07/p27_sq-1024x1024.jpg)
![[Obayashi] Reducing Cross-Shareholdings — ¥285.2bn Sold in Five Years](https://japan-equity.com/wp-content/uploads/2026/07/p29_sq-1024x1024.jpg)
![[Obayashi] ¥750bn Investment Plan — ¥300bn to Development, ¥190bn to Tech/DX](https://japan-equity.com/wp-content/uploads/2026/07/p30_sq-1024x1024.jpg)
![[Obayashi] MTP2022 KPIs — Operating Profit ~2x Target, ROE 14.4%](https://japan-equity.com/wp-content/uploads/2026/07/p25_sq-1024x1024.jpg)
![[Obayashi] Cash Allocation — ¥420bn Investment CF Over Five Years](https://japan-equity.com/wp-content/uploads/2026/07/p26_sq-1024x1024.jpg)
![[Obayashi] Green Energy — 44 Plants, 344MW, and the Green Hydrogen Challenge](https://japan-equity.com/wp-content/uploads/2026/07/p21_sq-1024x1024.jpg)
![[Obayashi] Tackling the Labor Shortage — Robotics Construction®](https://japan-equity.com/wp-content/uploads/2026/07/p14_sq-1024x1024.jpg)
