
This article is based on publicly available IR materials and is not a recommendation to buy or sell any specific securities.
Note on fiscal-year labels: this article covers the fiscal year ended March 31, 2026, which Sanrio Company, Ltd. labels “FY3/2026” in its presentation. Our site classifies the most recent completed fiscal year as FY2025, so the title uses that label while the body, tables and segment figures keep the labels used in the source material. The presentation also notes that the reporting period covers April 2025 to March 2026 for Japan and January 2025 to December 2025 for overseas operations.
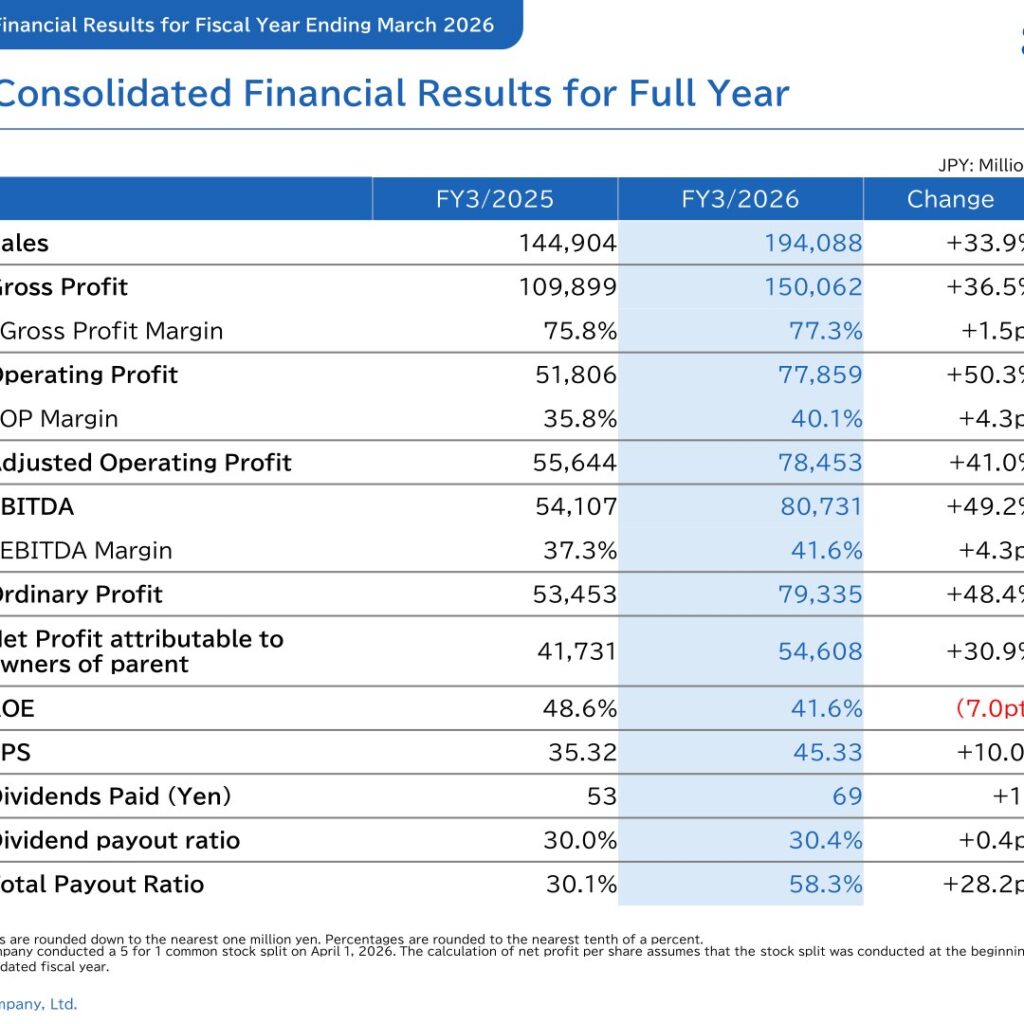
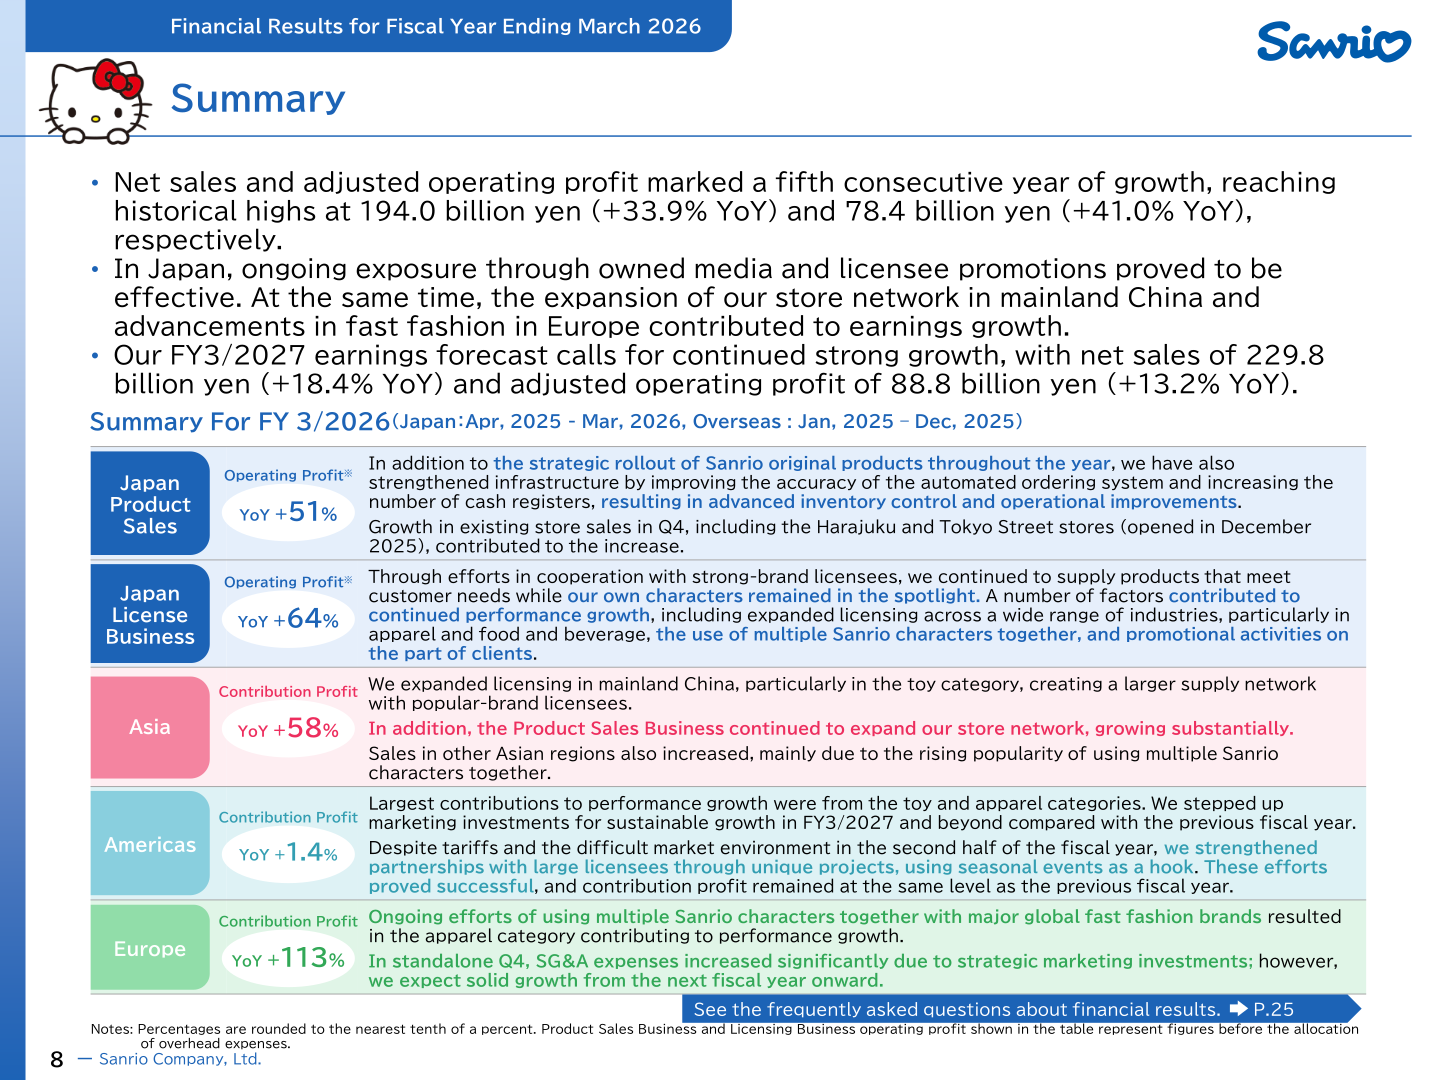
Sanrio reported net sales of 194,088 million yen for FY3/2026, up 33.9% year on year, and adjusted operating profit of 78,453 million yen, up 41.0%. The company describes this as a fifth consecutive year of growth for both net sales and adjusted operating profit, with both reaching historical highs. Operating profit rose 50.3% to 77,859 million yen and net profit attributable to owners of parent rose 30.9% to 54,608 million yen. For FY3/2027 the company forecasts net sales of 229,800 million yen (+18.4%) and adjusted operating profit of 88,800 million yen (+13.2%).
Consolidated Results (Full-Year Actual)
The presentation attributes the increase in Japan to ongoing exposure through owned media and licensee promotions, while the expansion of the store network in mainland China and advancements in fast fashion in Europe contributed to earnings growth. Gross profit margin improved 1.5pt to 77.3% and the operating profit margin improved 4.3pt to 40.1%. ROE declined 7.0pt to 41.6%. Figures are stated in millions of yen and are rounded down to the nearest one million yen; percentages are rounded to the nearest tenth of a percent.
| Item (JPY: Million) | FY3/2026 | FY3/2025 | Change |
|---|---|---|---|
| Sales | 194,088 | 144,904 | +33.9% |
| Gross Profit | 150,062 | 109,899 | +36.5% |
| Gross Profit Margin | 77.3% | 75.8% | +1.5pt |
| Operating Profit | 77,859 | 51,806 | +50.3% |
| OP Margin | 40.1% | 35.8% | +4.3pt |
| Adjusted Operating Profit | 78,453 | 55,644 | +41.0% |
| EBITDA | 80,731 | 54,107 | +49.2% |
| EBITDA Margin | 41.6% | 37.3% | +4.3pt |
| Ordinary Profit | 79,335 | 53,453 | +48.4% |
| Net Profit attributable to owners of parent | 54,608 | 41,731 | +30.9% |
| ROE | 41.6% | 48.6% | (7.0pt) |
| EPS (Yen) | 45.33 | 35.32 | +10.01 |
The company notes that it conducted a 5 for 1 common stock split on April 1, 2026, and that the calculation of net profit per share assumes that the stock split was conducted at the beginning of the previous consolidated fiscal year. Adjusted operating profit is a proprietary indicator defined by the company, referring to operating profit excluding the impact of consolidation adjustments arising from the difference in fiscal year-ends between the parent company in Japan and overseas subsidiaries.
Segment Results
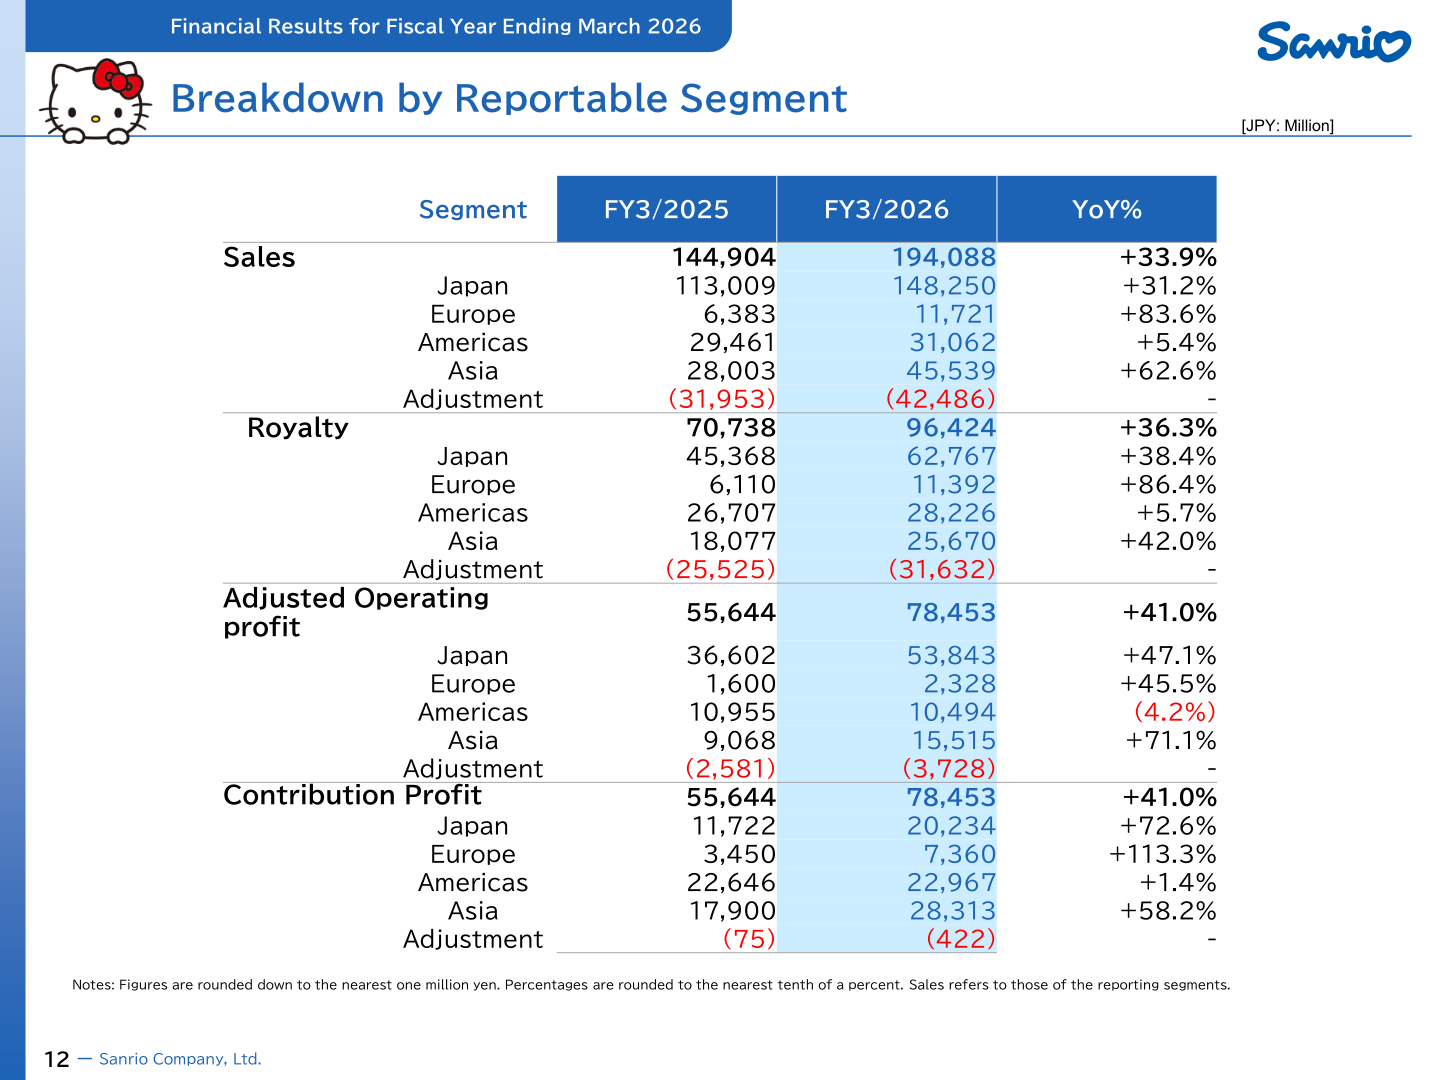
Sanrio reports by region: Japan, Europe, Americas and Asia, with an Adjustment line. Alongside sales and adjusted operating profit, the company discloses royalty revenue and “contribution profit,” a Sanrio-specific indicator calculated by adding royalty payments made to headquarters back to the operating profit of overseas subsidiaries. From Q2 FY3/2026 contribution profit is presented net of consolidation adjustments related to differences in fiscal periods, and past figures are retrospectively restated.
| Item / Segment (JPY: Million) | FY3/2026 | FY3/2025 | YoY% |
|---|---|---|---|
| Sales | 194,088 | 144,904 | +33.9% |
| Sales — Japan | 148,250 | 113,009 | +31.2% |
| Sales — Europe | 11,721 | 6,383 | +83.6% |
| Sales — Americas | 31,062 | 29,461 | +5.4% |
| Sales — Asia | 45,539 | 28,003 | +62.6% |
| Sales — Adjustment | (42,486) | (31,953) | – |
| Royalty | 96,424 | 70,738 | +36.3% |
| Royalty — Japan | 62,767 | 45,368 | +38.4% |
| Royalty — Europe | 11,392 | 6,110 | +86.4% |
| Royalty — Americas | 28,226 | 26,707 | +5.7% |
| Royalty — Asia | 25,670 | 18,077 | +42.0% |
| Royalty — Adjustment | (31,632) | (25,525) | – |
| Adjusted Operating Profit | 78,453 | 55,644 | +41.0% |
| Adjusted OP — Japan | 53,843 | 36,602 | +47.1% |
| Adjusted OP — Europe | 2,328 | 1,600 | +45.5% |
| Adjusted OP — Americas | 10,494 | 10,955 | (4.2%) |
| Adjusted OP — Asia | 15,515 | 9,068 | +71.1% |
| Adjusted OP — Adjustment | (3,728) | (2,581) | – |
| Contribution Profit | 78,453 | 55,644 | +41.0% |
| Contribution Profit — Japan | 20,234 | 11,722 | +72.6% |
| Contribution Profit — Europe | 7,360 | 3,450 | +113.3% |
| Contribution Profit — Americas | 22,967 | 22,646 | +1.4% |
| Contribution Profit — Asia | 28,313 | 17,900 | +58.2% |
| Contribution Profit — Adjustment | (422) | (75) | – |
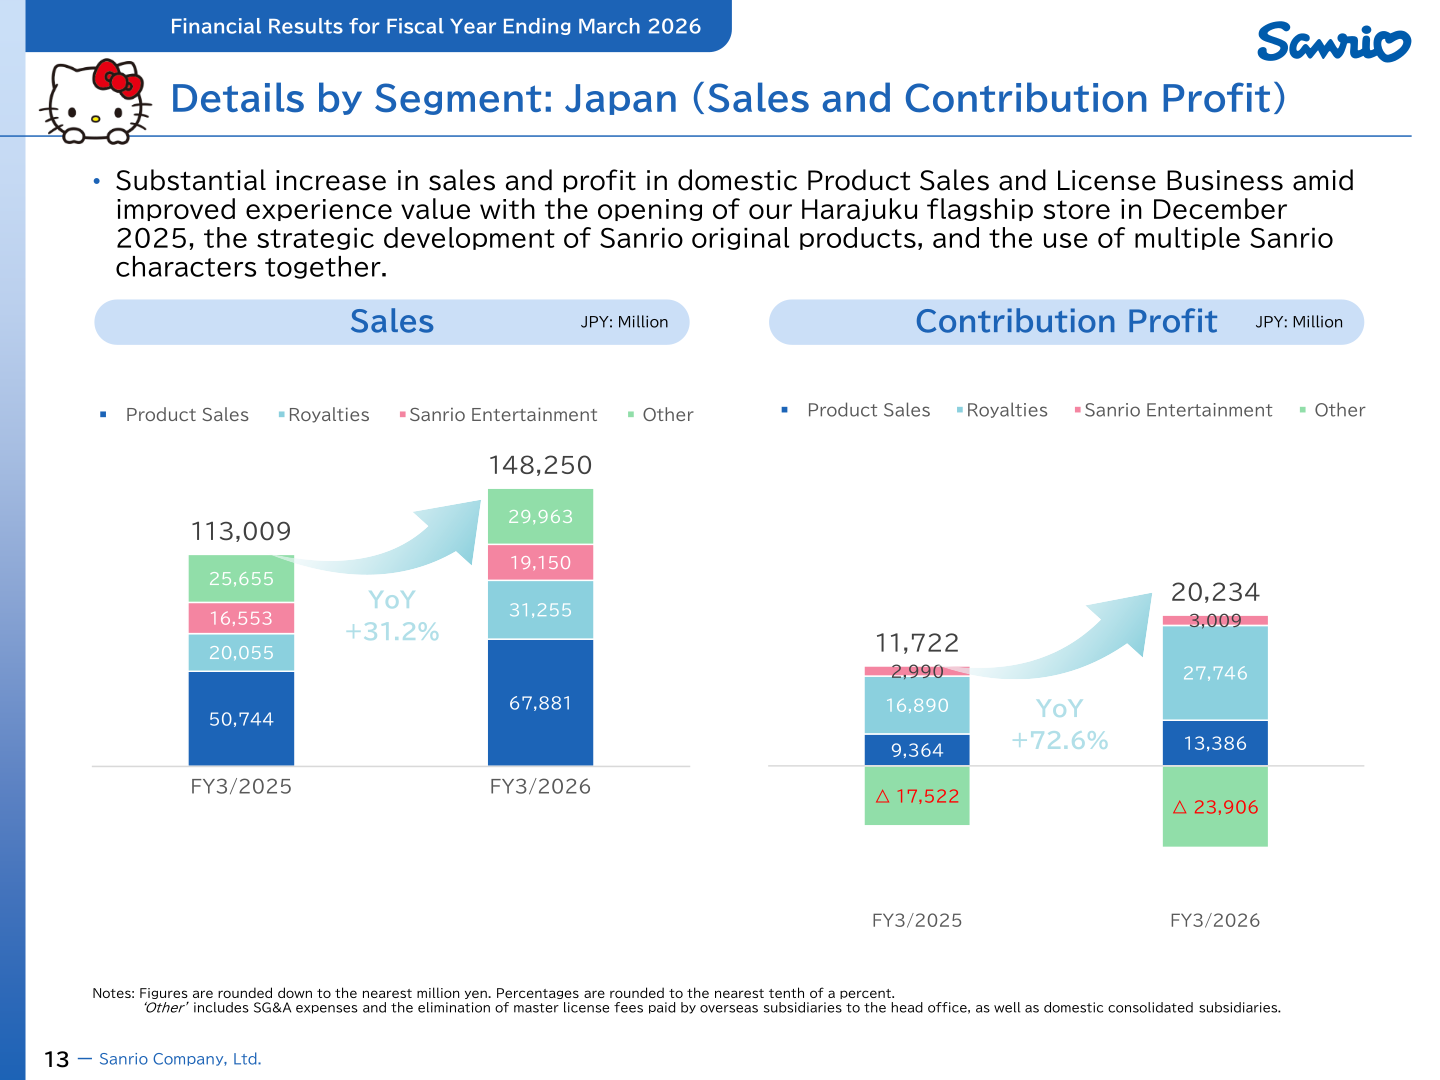
Within Japan, the company breaks sales down into Product Sales, Royalties, Sanrio Entertainment (the theme park business) and Other. Sanrio attributes the substantial increase in sales and profit in the domestic Product Sales and License businesses to improved experience value with the opening of the Harajuku flagship store in December 2025, the strategic development of Sanrio original products, and the use of multiple Sanrio characters together. “Other” includes SG&A expenses and the elimination of master license fees paid by overseas subsidiaries to the head office, as well as domestic consolidated subsidiaries.
| Japan breakdown (JPY: Million) | FY3/2026 | FY3/2025 |
|---|---|---|
| Sales — Product Sales | 67,881 | 50,744 |
| Sales — Royalties | 31,255 | 20,055 |
| Sales — Sanrio Entertainment | 19,150 | 16,553 |
| Sales — Other | 29,963 | 25,655 |
| Sales — Japan total | 148,250 | 113,009 |
| Contribution Profit — Product Sales | 13,386 | 9,364 |
| Contribution Profit — Royalties | 27,746 | 16,890 |
| Contribution Profit — Sanrio Entertainment | 3,009 | 2,990 |
| Contribution Profit — Other | △ 23,906 | △ 17,522 |
| Contribution Profit — Japan total | 20,234 | 11,722 |
For the Americas, the company states that brand momentum remained favorable despite slowing performance growth due to delays and stoppages in production and shipments by some licensees as a result of the U.S. tariffs. In Asia, Product Sales performance in mainland China was strong at new and existing stores, mainly in first-tier cities, while merchandise licensing continued to be strong, particularly for toys. In Europe, global fast fashion brands and other apparel contributed positively to business performance. The presentation notes 59 stores in mainland China as of the end of December 2025 (5 direct stores and 54 FC stores), an increase of 31 stores year on year.
Balance Sheet
Total assets rose 15.9% to 234,684 million yen and net assets rose 44.9% to 155,971 million yen, with the company citing an increase of 39.1 billion yen in retained earnings. Interest-bearing debt fell 65.4% to 13,938 million yen and net cash, defined as cash and deposits less interest-bearing debts, rose 41.7% to 111,495 million yen.
| Item (JPY: Million) | FY3/2026 | FY3/2025 | YoY(%) |
|---|---|---|---|
| Current assets | 168,567 | 151,698 | +11.1% |
| Cash and deposits | 125,433 | 118,976 | +5.4% |
| Non-current assets | 66,117 | 50,707 | +30.4% |
| Total assets | 234,684 | 202,406 | +15.9% |
| Total liabilities | 78,713 | 94,798 | (17.0%) |
| Interest-bearing debt | 13,938 | 40,291 | (65.4%) |
| Net assets | 155,971 | 107,608 | +44.9% |
| Net cash | 111,495 | 78,685 | +41.7% |
| Equity ratio | 66.4% | 52.9% | 13.5pt |
FY3/2027 Forecast
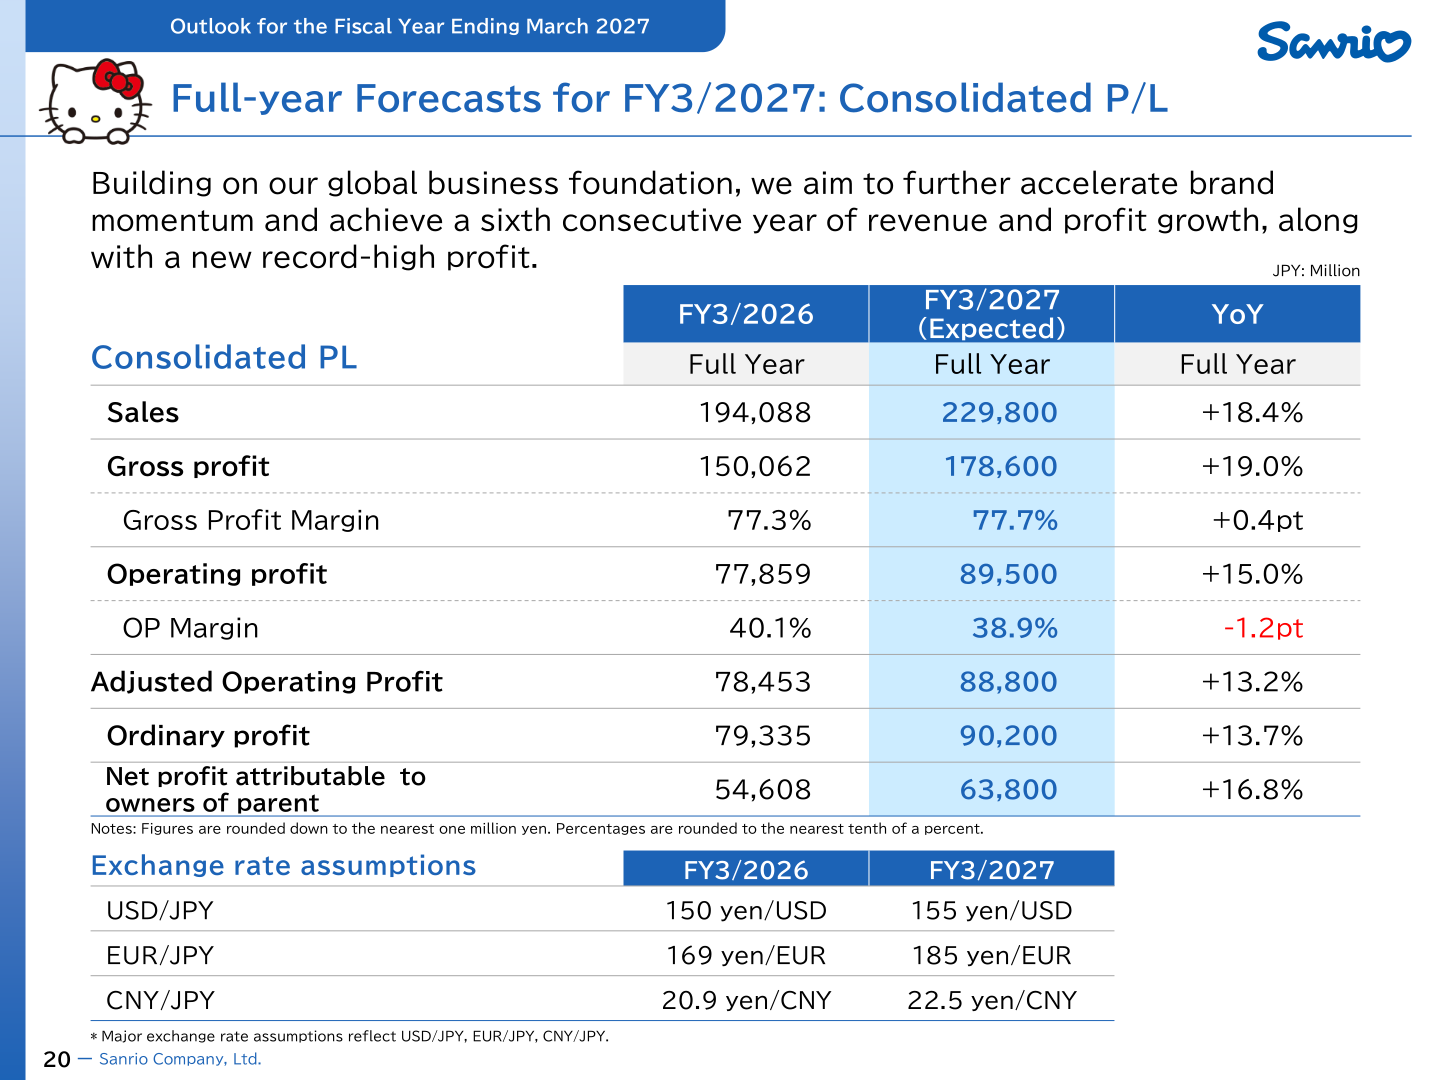
Sanrio states that, building on its global business foundation, it aims to further accelerate brand momentum and achieve a sixth consecutive year of revenue and profit growth, along with a new record-high profit. Exchange rate assumptions move from 150 yen/USD, 169 yen/EUR and 20.9 yen/CNY in FY3/2026 to 155 yen/USD, 185 yen/EUR and 22.5 yen/CNY in FY3/2027.
| Consolidated PL (JPY: Million) | FY3/2027 (Expected) | FY3/2026 (Actual) | YoY |
|---|---|---|---|
| Sales | 229,800 | 194,088 | +18.4% |
| Gross profit | 178,600 | 150,062 | +19.0% |
| Gross Profit Margin | 77.7% | 77.3% | +0.4pt |
| Operating profit | 89,500 | 77,859 | +15.0% |
| OP Margin | 38.9% | 40.1% | -1.2pt |
| Adjusted Operating Profit | 88,800 | 78,453 | +13.2% |
| Ordinary profit | 90,200 | 79,335 | +13.7% |
| Net profit attributable to owners of parent | 63,800 | 54,608 | +16.8% |
By region, the company forecasts higher sales in all four segments for FY3/2027. In Japan, investments made by the Japan HQ to expand global character exposure, along with higher personnel costs to strengthen the business foundation, are expected to weigh on contribution profit, which is forecast to decline 3.8%. For the Americas, the company expects the negative impact of tariffs to continue along with an increase in expenses for strengthening and expanding the business base. In Asia, the company plans to open roughly 20 new stores in the Product Sales Business, mainly in Tier 1 and Tier 2 cities.
| Segment (JPY: Million) | Sales FY3/2027 Forecast | Sales YoY | Contribution Profit FY3/2027 Forecast | Contribution Profit YoY |
|---|---|---|---|---|
| Japan | 172,167 | +16.1% | 19,456 | -3.8% |
| Americas | 33,820 | +8.9% | 24,265 | +5.7% |
| Asia | 57,074 | +25.3% | 35,240 | +24.5% |
| Europe | 14,811 | +26.4% | 10,484 | +42.4% |
Shareholder Returns
Dividends paid rose 16 yen to 69 yen per share, with the dividend payout ratio at 30.4% versus 30.0% a year earlier, and the total payout ratio at 58.3% versus 30.1%. In the Q&A section of the presentation, the company states that its basic policy for shareholder returns is to provide stable and consistent dividends, and that its financial policy targets a dividend payout ratio of at least 30%. It adds that it will conduct a comprehensive review of progress under the growth investment framework in its medium-term management plan, which calls for 50 billion yen or more through FY3/2027, and that after that review it intends to consider shareholder returns of up to 30 billion yen as one important option if it is unable to identify a sufficient number of attractive investment opportunities. The company also says its policy of prioritizing growth investments remains unchanged and that it will consider opportunistic share buybacks using excess capital.
| Item | FY3/2026 | FY3/2025 | Change |
|---|---|---|---|
| Dividends Paid (Yen) | 69 | 53 | +16 |
| Dividend payout ratio | 30.4% | 30.0% | +0.4pt |
| Total Payout Ratio | 58.3% | 30.1% | +28.2pt |
Long-Term Vision and Medium-Term Plan Progress
Sanrio says its disclosures based on the medium-term management plan extend through FY3/2027, and that it intends to shift from formulating medium-term management plans to implementing strategies and measures in a more flexible and agile manner to achieve its FY3/2035 long-term vision, announced in May 2025. The company describes progress on the plan’s three approaches as generally on track. In the Q&A it states that it has consistently regarded its stock price as a key management indicator and that its long-term vision through FY3/2035 includes a target market capitalization of 5 trillion yen.
On the character portfolio, the presentation shows Hello Kitty at 37.3% of the FY3/2026 mix versus 38.6% in FY3/2025, with a wide range of Sanrio characters at 16.2% versus 16.0% and other Sanrio characters at 46.5% versus 45.4%; the composition is calculated based on gross profit from the Product Sales business and the License business in Japan and overseas, with FY3/2025 data retrospectively restated. Regional market share targets by FY3/2035 are given as up to +5pt from approximately 19% in Japan, up to +5pt from approximately 16% in China, 10% from approximately 4% in North America, and up to +5pt from approximately 1% in Europe.
On the medium-term investment framework, the company shows an allocation through FY3/2027 of 10 billion yen for marketing, 10 billion yen for game development, 3 billion yen for edutainment and digital areas, 1.5 billion yen for Sanrio+, and 4 billion yen for systems, for a total of 30 billion yen in organic investments, plus 50 billion yen or more for inorganic investments. Progress for the period FY3/2025 to FY3/2026 is shown as approximately 15 billion yen in total organic investments and several billion yen of total investment on the inorganic side, including investments in ClaN, Brave Group and IG Port and making Gugenka a subsidiary.
On the new game business, the company launched its own game brand, Sanrio Games, and plans to release a total of 10 titles or so by the end of the fiscal year ending March 31, 2029. The first title is shown as Hello Kitty Party Land, a party game with a launch date of October 29th, 2026 in Japan and overseas. Because launches are expected in the second half of FY3/2027, the company says it does not expect a contribution to business performance until the following fiscal year.
Governance Topic Disclosed with the Results
The presentation opens with an explanation of the Special Investigation Committee’s findings regarding suspected inappropriate compensation received by a former managing director. The company states that the total amount in question was US$1,682,018 (approximately ¥252,302,700, calculated at an exchange rate of USD1 = JPY150), including a cost of living adjustment bonus, and that the financial benefits provided have been recorded as an expense of the U.S. subsidiary for the respective fiscal years. It adds that, at this time, no misstatements have been confirmed in the company’s consolidated earnings or those of the U.S. subsidiary in question, and that while it will incur investigation costs related to the incident for FY3/2027, it expects the impact of those costs to be immaterial. The director in question has resigned, and the President and CEO will return 30% of monthly compensation for three months and the Senior Managing Director 10% of monthly compensation for one month.
This article is an analysis based on publicly available information and is not a recommendation to buy or sell any specific securities. Investment decisions are your own responsibility.
![[Obayashi] Investors’ Guide 2026 — The Complete 24-Article Breakdown](https://japan-equity.com/wp-content/uploads/2026/07/hub_cover-1024x1024.png)
![[Obayashi] IR & SR Policy — Feeding Dialogue Back into Management](https://japan-equity.com/wp-content/uploads/2026/07/p32_sq-1024x1024.jpg)
![[Obayashi] Domestic Civil Engineering — Resilience Spending Supports 9.6% Margin](https://japan-equity.com/wp-content/uploads/2026/07/p11_sq-1024x1024.jpg)
![[Obayashi] Overseas Construction — Orders Reach ¥1.2tn](https://japan-equity.com/wp-content/uploads/2026/07/p15_sq-1024x1024.jpg)
![[Obayashi] Share Price & External Ratings — vs TOPIX, ESG Index Inclusion](https://japan-equity.com/wp-content/uploads/2026/07/p40_sq-1024x1024.jpg)
![[Construction] ¥75.5tn Investment, Shrinking Workforce — Big-5 Market Share](https://japan-equity.com/wp-content/uploads/2026/07/p12_sq-1024x1024.jpg)



![[Obayashi] Capital Policy & Shareholder Returns — ROE 10%+, DOE ~5%, ¥100bn Buyback](https://japan-equity.com/wp-content/uploads/2026/07/p27_sq-1024x1024.jpg)
![[Obayashi] Reducing Cross-Shareholdings — ¥285.2bn Sold in Five Years](https://japan-equity.com/wp-content/uploads/2026/07/p29_sq-1024x1024.jpg)
![[Obayashi] ¥750bn Investment Plan — ¥300bn to Development, ¥190bn to Tech/DX](https://japan-equity.com/wp-content/uploads/2026/07/p30_sq-1024x1024.jpg)
![[Obayashi] MTP2022 KPIs — Operating Profit ~2x Target, ROE 14.4%](https://japan-equity.com/wp-content/uploads/2026/07/p25_sq-1024x1024.jpg)
![[Obayashi] Cash Allocation — ¥420bn Investment CF Over Five Years](https://japan-equity.com/wp-content/uploads/2026/07/p26_sq-1024x1024.jpg)
![[Obayashi] Green Energy — 44 Plants, 344MW, and the Green Hydrogen Challenge](https://japan-equity.com/wp-content/uploads/2026/07/p21_sq-1024x1024.jpg)
![[Obayashi] Tackling the Labor Shortage — Robotics Construction®](https://japan-equity.com/wp-content/uploads/2026/07/p14_sq-1024x1024.jpg)
