
This article is based on publicly available IR materials and is not a recommendation to buy or sell any specific securities.
Note: Goldwin labels the fiscal year ended March 31, 2026 as “FY26.3”; this article follows this site’s convention of classifying the latest completed fiscal year as FY2025, while all labels in the text and tables below are kept as they appear in the company’s materials. In FY26.3, Goldwin posted net sales of 137,516 million yen (103.9% YoY) and operating profit of 25,859 million yen (118.0% YoY), with the materials describing both as record highs. The operating profit margin recovered to 18.8% as the one-time expenses recorded in FY25.3 were eliminated, although net sales came in at 97.9% of plan, roughly 3 billion yen short of the target, on a decline in inbound demand from mainland China and sluggish sales of some winter collection items. For FY27.3 the company plans net sales of 145,400 million yen (105.7% YoY) and operating profit of 26,100 million yen (100.9% YoY).
Consolidated Results (Full-Year Actual)
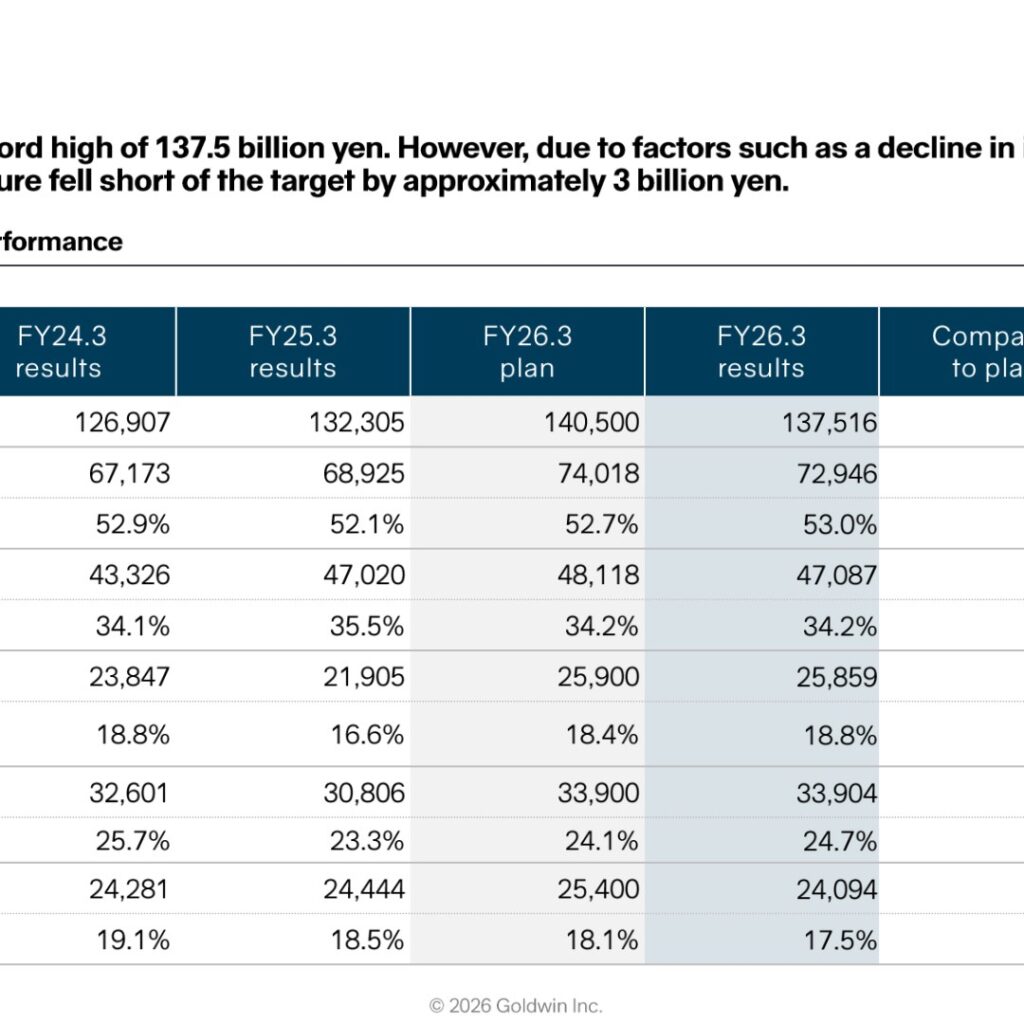
Net sales reached a record high of 137,516 million yen, but fell short of the plan by approximately 3 billion yen. The gross profit margin was 53.0%, up 0.9 percentage points YoY and 0.3pt above the planned 52.7%. SG&A expenses were 47,087 million yen, described as on par with the previous fiscal year, which had included one-time expenses. Ordinary profit was 33,904 million yen (110.1% YoY), while net income was 24,094 million yen (98.6% YoY) after an extraordinary loss arising from the sale of stocks was recognized.
| Item (Unit: million yen) | FY26.3 results | FY25.3 results | YoY | FY26.3 plan | Compared to plan |
|---|---|---|---|---|---|
| Net sales | 137,516 | 132,305 | 103.9% | 140,500 | 97.9% |
| Gross profit | 72,946 | 68,925 | 105.8% | 74,018 | 98.6% |
| Gross profit margin | 53.0% | 52.1% | 0.9pt | 52.7% | 0.4pt |
| SG & A expenses | 47,087 | 47,020 | 100.1% | 48,118 | 97.9% |
| SG & A ratio | 34.2% | 35.5% | (1.3)pt | 34.2% | 0.0pt |
| Operating profit | 25,859 | 21,905 | 118.0% | 25,900 | 99.8% |
| Operating profit margin | 18.8% | 16.6% | 2.2pt | 18.4% | 0.4pt |
| Ordinary profit | 33,904 | 30,806 | 110.1% | 33,900 | 100.0% |
| Ordinary profit margin | 24.7% | 23.3% | 1.4pt | 24.1% | 0.5pt |
| Net income | 24,094 | 24,444 | 98.6% | 25,400 | 94.9% |
| Net income margin | 17.5% | 18.5% | (1.0)pt | 18.1% | (0.6)pt |
The materials also present a comparison excluding one-time expenses. FY25.3 one-time expenses consisted of J-ESOP 3.0 billion yen plus a head office relocation of 500 million yen, 3.5 billion yen in total. On that basis, FY25.3 operating profit would have been 25,405 million yen, so FY26.3 operating profit of 25,859 million yen represents 101.8% YoY, and the company notes that the structural increase in SG&A expenses is expected to continue. On the balance sheet, the equity ratio was 76.9% and ROE was 20.1%, with interest-bearing debt of 1,070 million yen and a D/E ratio of 0.008 times, which the company describes as an effectively debt-free status.
Segment Results
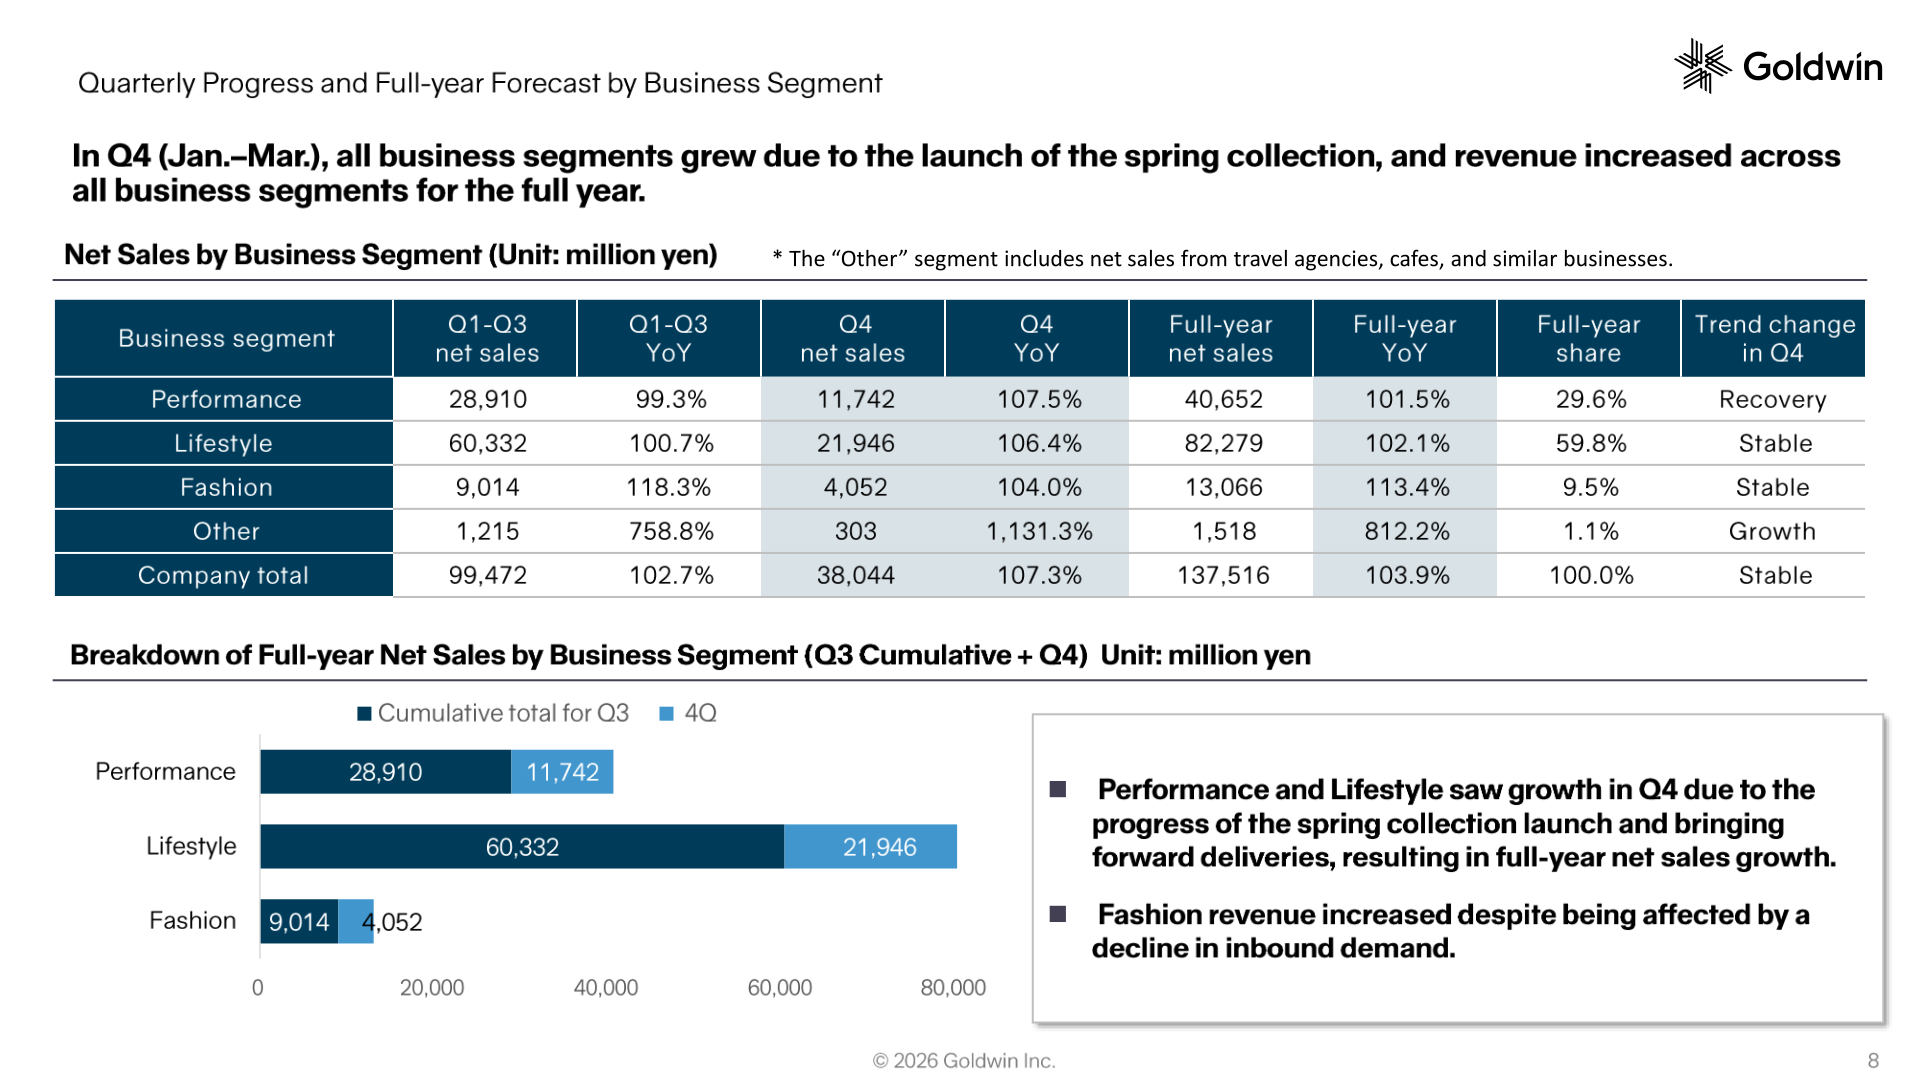
Net sales increased across all business segments for the full year. Lifestyle, the largest segment at 59.8% of full-year net sales, grew to 82,279 million yen (102.1% YoY), Performance was 40,652 million yen (101.5% YoY) with a 29.6% share, and Fashion was 13,066 million yen (113.4% YoY) with a 9.5% share. The Other segment, which the materials note includes net sales from travel agencies, cafes and similar businesses, was 1,518 million yen. For FY27.3, the company expects Lifestyle to drive growth, while Fashion is projected to decline because the WOOLRICH brand is in the final stages of being phased out and the previous period’s actual sales of 1.5 billion yen have been excluded from the plan.
| Business segment (Unit: million yen) | FY25.3 net sales | FY26.3 net sales | FY26.3 YoY | FY27.3 plan | FY27.3 YoY |
|---|---|---|---|---|---|
| Performance | 40,049 | 40,652 | 101.5% | 40,900 | 100.6% |
| Lifestyle | 80,550 | 82,279 | 102.1% | 89,400 | 108.7% |
| Fashion | 11,519 | 13,066 | 113.4% | 12,300 | 94.1% |
| Other | 186 | 1,518 | 816.1% | 2,800 | 184.5% |
| Total | 132,305 | 137,516 | 103.9% | 145,400 | 105.7% |
Channels, Inbound Demand and Q4 Trends
Full-year e-commerce sales rose 15.7% to 20,017 million yen and the e-commerce ratio increased to 14.6%, which the company describes as accelerating the structural shift in sales channels. Inbound sales accounted for 26.5% of sales at self-operated stores, up 1.1pt YoY, with mainland China accounting for 49.6% of inbound sales versus 57.4% in the previous year; the materials state that inbound demand from mainland China declined from the latter half of November but that H1 growth and demand from South Korea, Southeast Asia, Europe and the US compensated for this. In Q4 (January-March), net sales were 38,044 million yen (+7.3% YoY), helped by bringing forward deliveries of some spring collection items, primarily to the wholesale sector, worth approximately 1.0 billion yen, while the Q4 gross profit margin was 51.9%, down 0.4pt YoY. Inventories at the end of FY26.3 stood at 102.7% YoY. The company opened 16 self-operated stores and closed 15 in FY2026 for a net increase of one store, and plans a net increase of eight stores in FY2027.
FY27.3 Forecast
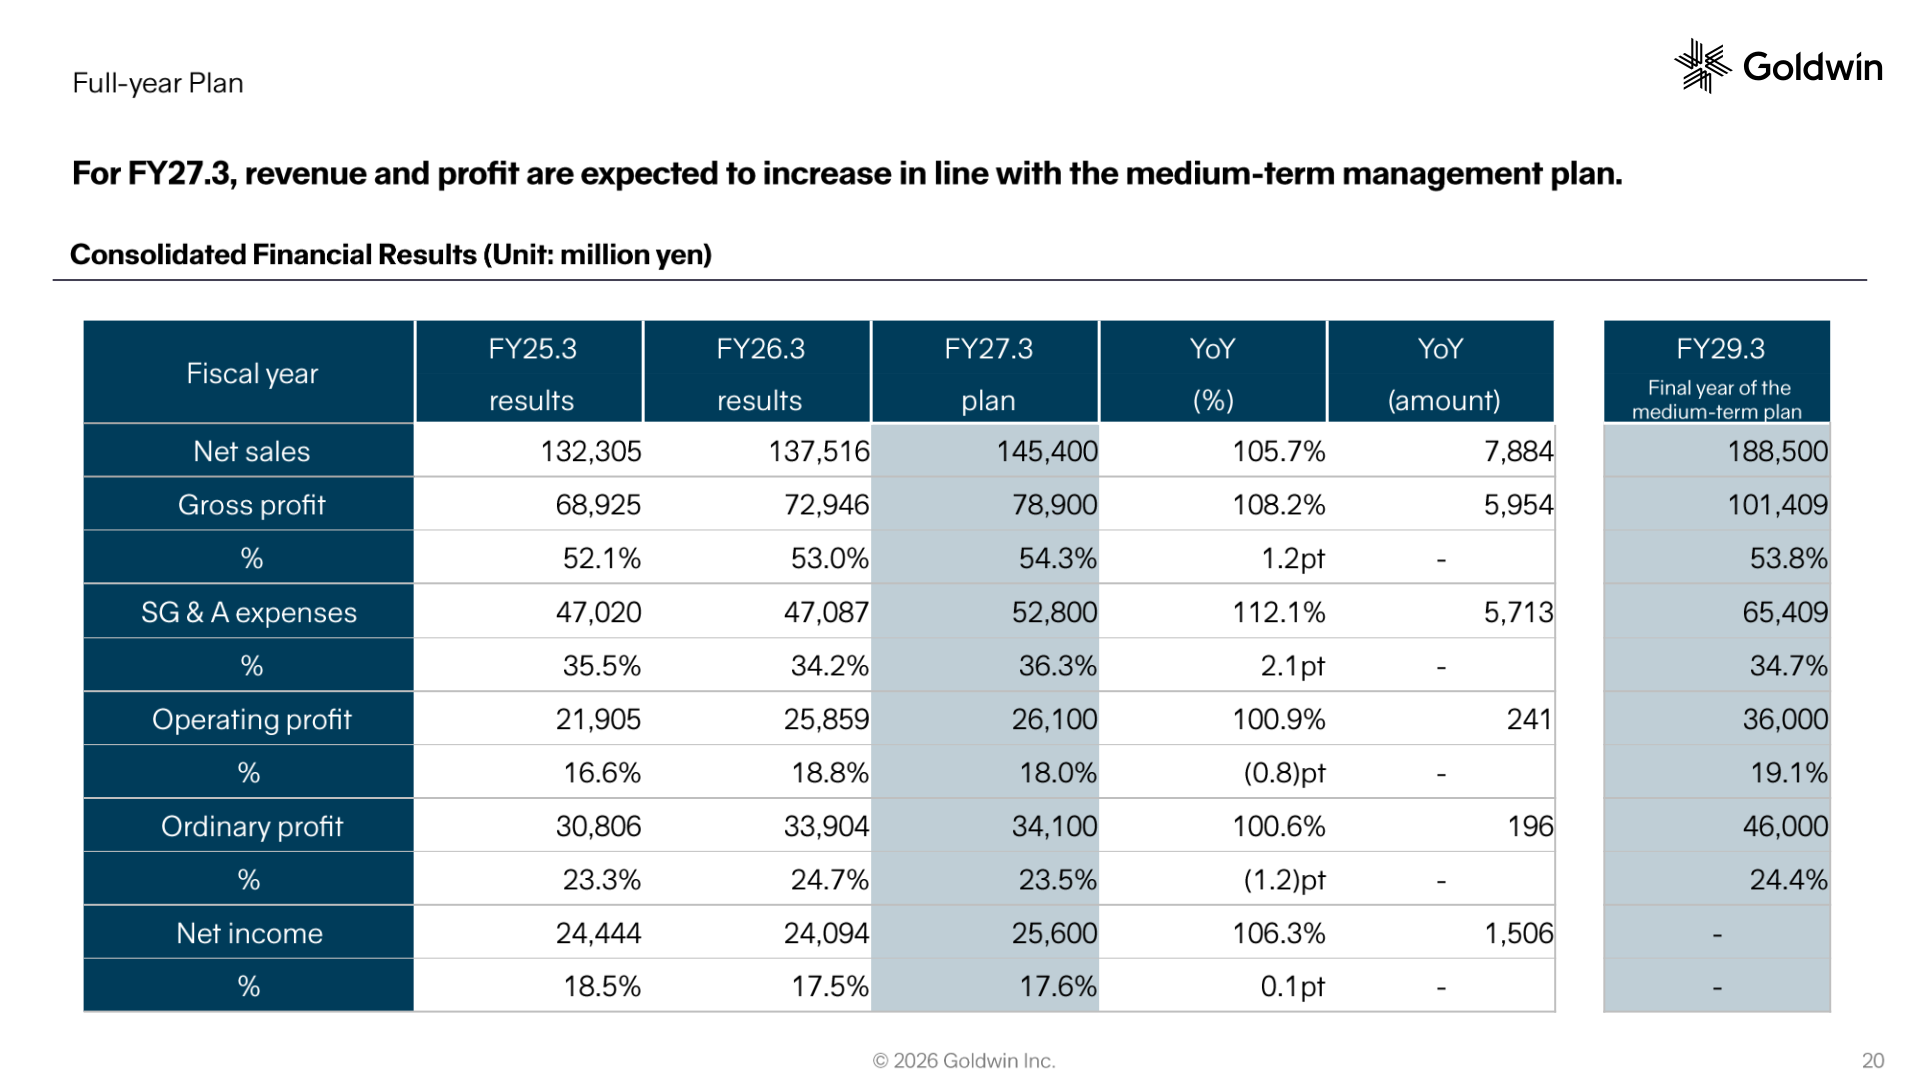
For FY27.3, the company expects both revenue and profit to increase in line with the medium-term management plan. The gross profit margin is planned to improve by 1.3 percentage points to 54.3%, while the operating profit margin is projected at 18.0% as SG&A expenses rise on growth investments and strengthened human capital. SG&A expenses are planned to increase by 5.7 billion yen versus the previous year, and from FY27.3 onwards 1.1 billion yen of R&D-related costs will be reclassified from cost of sales to SG&A expenses. By half, the plan calls for net sales of 59,900 million yen in H1 and 85,500 million yen in H2. Assumptions by brand include THE NORTH FACE at 110.6 billion yen (105.7% YoY), with apparel at 106.0% and gear at 104.8% of the prior year, and Goldwin at 10.1 billion yen (+53.6% YoY).
| Item (Unit: million yen) | FY27.3 plan | FY26.3 results | YoY (%) | YoY (amount) | FY29.3 (final year of the medium-term plan) |
|---|---|---|---|---|---|
| Net sales | 145,400 | 137,516 | 105.7% | 7,884 | 188,500 |
| Gross profit | 78,900 | 72,946 | 108.2% | 5,954 | 101,409 |
| Gross profit margin | 54.3% | 53.0% | 1.2pt | – | 53.8% |
| SG & A expenses | 52,800 | 47,087 | 112.1% | 5,713 | 65,409 |
| SG & A ratio | 36.3% | 34.2% | 2.1pt | – | 34.7% |
| Operating profit | 26,100 | 25,859 | 100.9% | 241 | 36,000 |
| Operating profit margin | 18.0% | 18.8% | (0.8)pt | – | 19.1% |
| Ordinary profit | 34,100 | 33,904 | 100.6% | 196 | 46,000 |
| Ordinary profit margin | 23.5% | 24.7% | (1.2)pt | – | 24.4% |
| Net income | 25,600 | 24,094 | 106.3% | 1,506 | – |
| Net income margin | 17.6% | 17.5% | 0.1pt | – | – |
Shareholder Returns
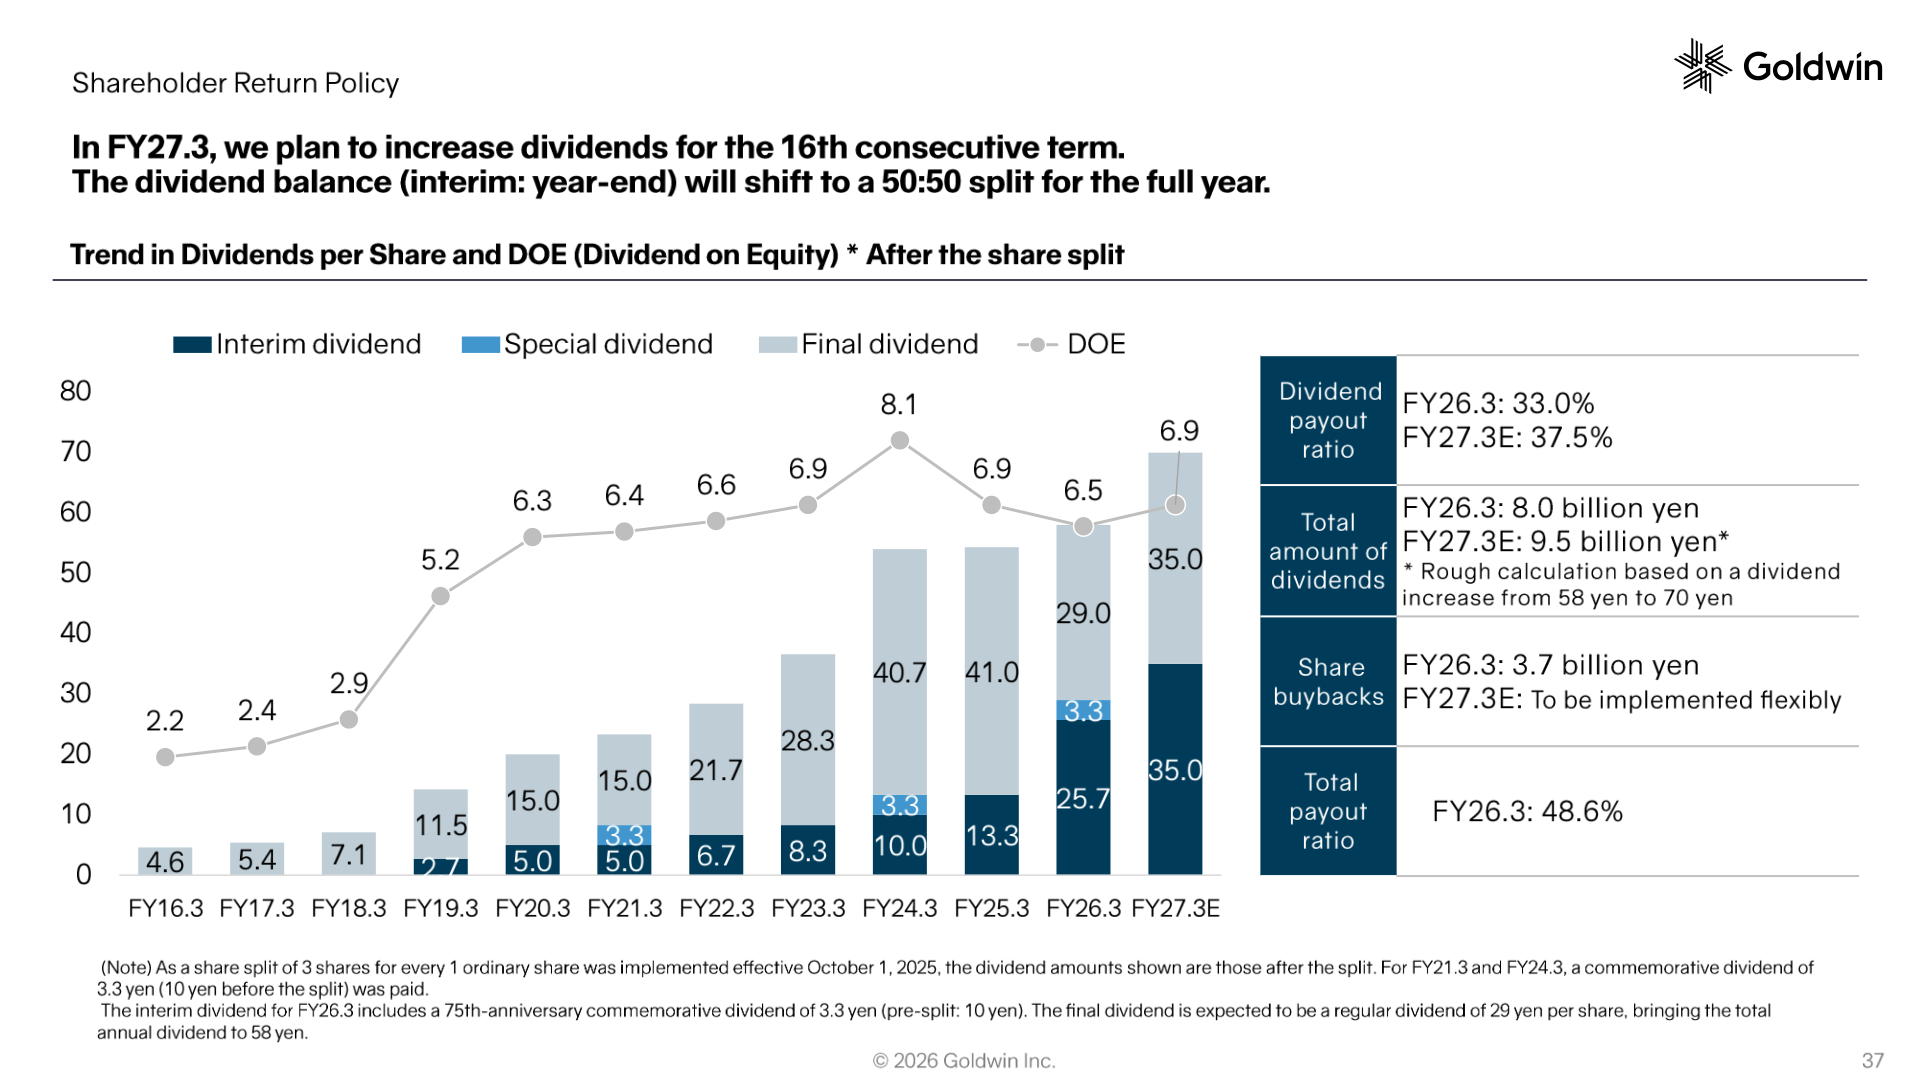
The company plans to increase dividends for the 16th consecutive term in FY27.3, and the dividend balance between the interim and year-end payments will shift to a 50:50 split for the full year. Following a three-for-one share split effective October 1, 2025, the FY26.3 interim dividend includes a 75th-anniversary commemorative dividend of 3.3 yen (10 yen before the split), and the year-end dividend is expected to be a regular dividend of 29 yen per share, bringing the total annual dividend to 58 yen. DOE is projected at 6.9% for FY27.3 against a medium-term management plan KPI of 6% or more, and the target total payout ratio guideline is approximately 40%, with share buybacks to be implemented flexibly. Under the cash allocation policy, the company plans to allocate 120-130 billion yen of operating cash flow over five years, of which 30-40% (36-52 billion yen) is earmarked for shareholder returns, building on cumulative operating cash flow of approximately 96 billion yen over the past five years. FY26.3 operating cash flow was 26,257 million yen (a 19.1% margin) and free cash flow was 12,789 million yen (9.3%).
| Item | FY26.3 | FY27.3 (plan) |
|---|---|---|
| Annual dividend per share (after the share split) | 58 yen | 70 yen |
| DOE | 6.5% | 6.9% |
| Dividend payout ratio | 33.0% | 37.5% |
| Total amount of dividends | 8.0 billion yen | 9.5 billion yen |
| Share buybacks | 3.7 billion yen | To be implemented flexibly |
| Total payout ratio | 48.6% | – |
Medium-Term Plan and Topics
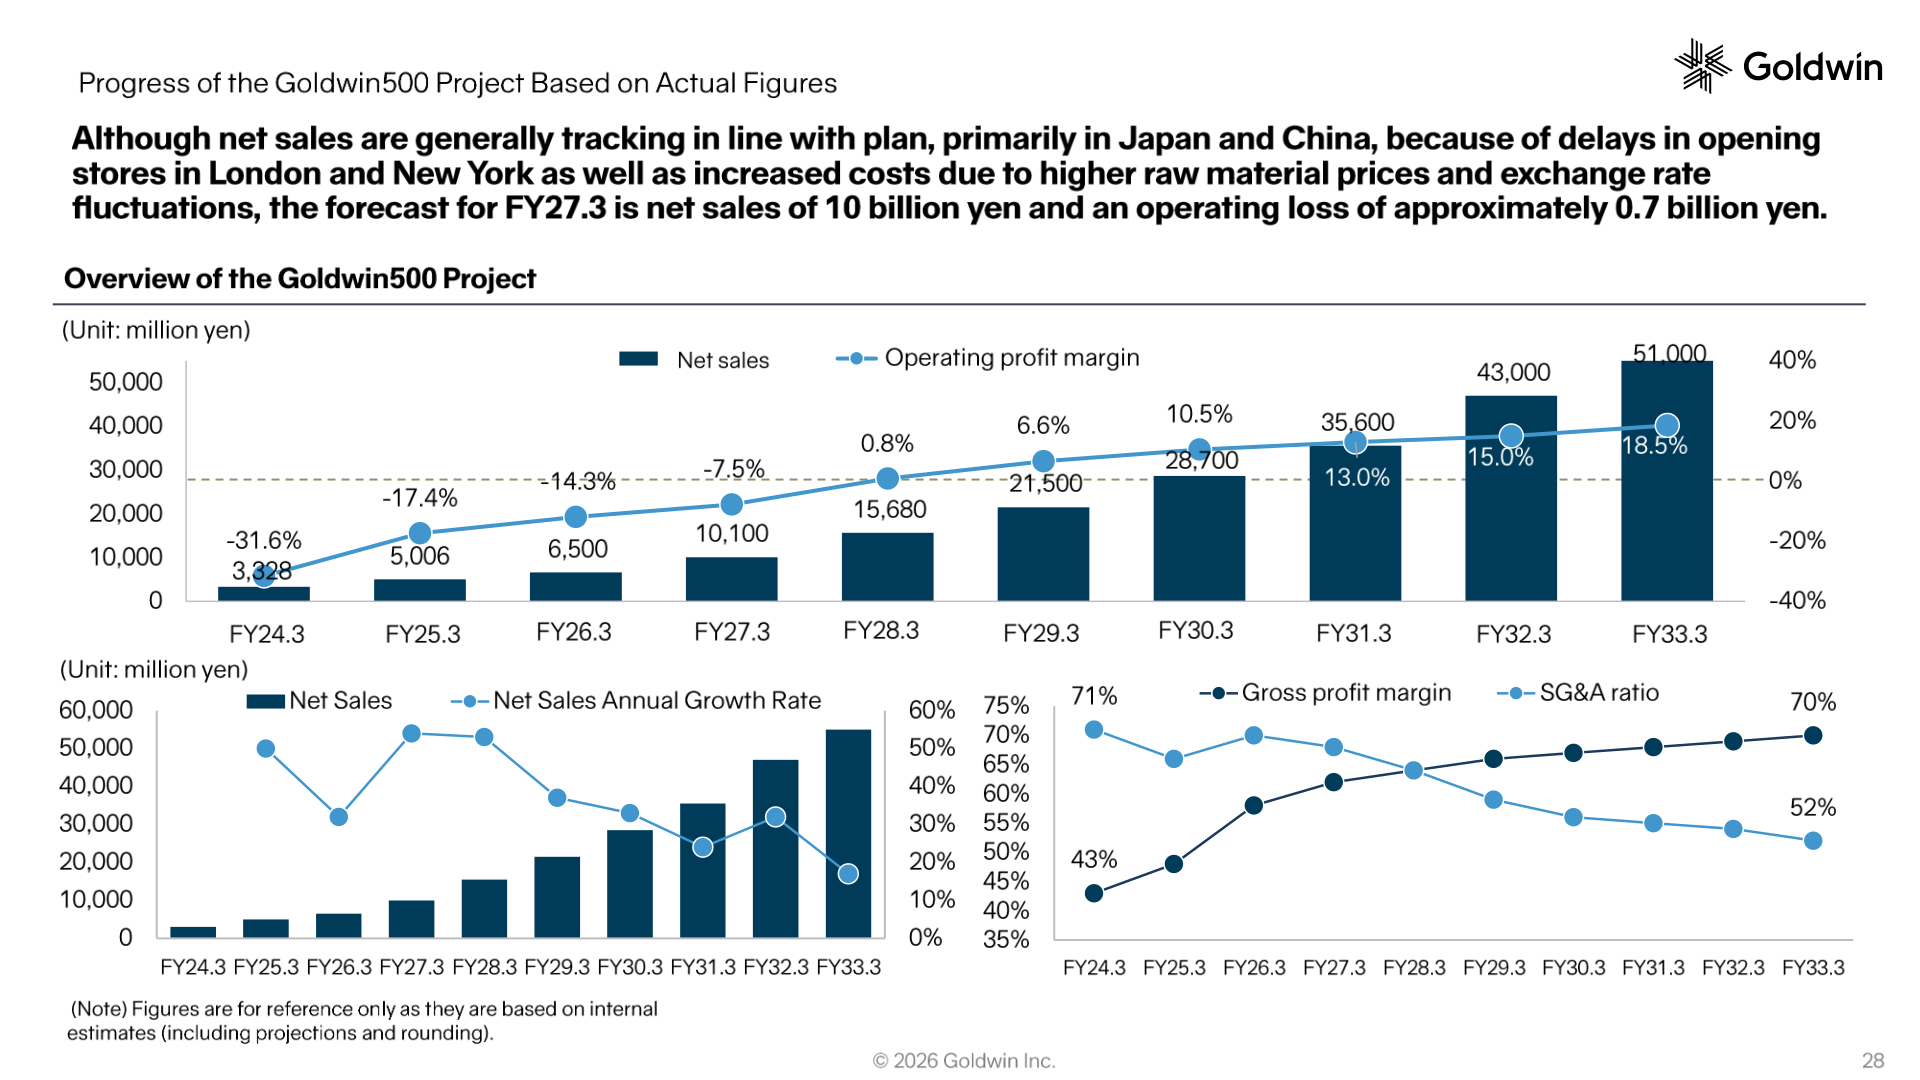
Under the Goldwin500 project, net sales are described as generally tracking in line with plan, primarily in Japan and China, but because of delays in opening stores in London and New York as well as increased costs from higher raw material prices and exchange rate fluctuations, the FY27.3 forecast is net sales of 10 billion yen and an operating loss of approximately 0.7 billion yen, with the timing for turning profitable pushed back to FY28.3. The project’s net sales path is shown as 3.3 billion yen in FY24.3, 15.7 billion yen in FY28.3 and 51.0 billion yen in FY33.3. The company states that it expanded from 9 to 15 stores in China and that its Chinese subsidiary has achieved profitability. Goldwin brand stores opened in London on January 31, 2026, Seoul on February 14, 2026 and New York on April 24, 2026, and the FY27.3 plan calls for two new stores in Japan and six more in mainland China. For THE NORTH FACE, FY27.3 marks the brand’s 60th anniversary, with a “NEVER STOP EXPLORING EXHIBITION” planned at the Tokyo Head Office for approximately one month in October and limited-edition anniversary items at shops. The sales organization was also reorganized from a region-based structure to a business-format-based structure with a Retail Division and a Wholesale Division.
This article is an analysis based on publicly available information and is not a recommendation to buy or sell any specific securities. Investment decisions are your own responsibility.
![[Obayashi] Investors’ Guide 2026 — The Complete 24-Article Breakdown](https://japan-equity.com/wp-content/uploads/2026/07/hub_cover-1024x1024.png)
![[Obayashi] IR & SR Policy — Feeding Dialogue Back into Management](https://japan-equity.com/wp-content/uploads/2026/07/p32_sq-1024x1024.jpg)
![[Obayashi] Real Estate Development — 18.7% Margin, ¥287.7bn Unrealized Gains](https://japan-equity.com/wp-content/uploads/2026/07/p20_sq-1024x1024.jpg)
![[Obayashi] Domestic Civil Engineering — Resilience Spending Supports 9.6% Margin](https://japan-equity.com/wp-content/uploads/2026/07/p11_sq-1024x1024.jpg)
![[Obayashi] Share Price & External Ratings — vs TOPIX, ESG Index Inclusion](https://japan-equity.com/wp-content/uploads/2026/07/p40_sq-1024x1024.jpg)
![[Construction] ¥75.5tn Investment, Shrinking Workforce — Big-5 Market Share](https://japan-equity.com/wp-content/uploads/2026/07/p12_sq-1024x1024.jpg)



![[Obayashi] Capital Policy & Shareholder Returns — ROE 10%+, DOE ~5%, ¥100bn Buyback](https://japan-equity.com/wp-content/uploads/2026/07/p27_sq-1024x1024.jpg)
![[Obayashi] Reducing Cross-Shareholdings — ¥285.2bn Sold in Five Years](https://japan-equity.com/wp-content/uploads/2026/07/p29_sq-1024x1024.jpg)
![[Obayashi] ¥750bn Investment Plan — ¥300bn to Development, ¥190bn to Tech/DX](https://japan-equity.com/wp-content/uploads/2026/07/p30_sq-1024x1024.jpg)
![[Obayashi] MTP2022 KPIs — Operating Profit ~2x Target, ROE 14.4%](https://japan-equity.com/wp-content/uploads/2026/07/p25_sq-1024x1024.jpg)
![[Obayashi] Cash Allocation — ¥420bn Investment CF Over Five Years](https://japan-equity.com/wp-content/uploads/2026/07/p26_sq-1024x1024.jpg)
![[Obayashi] Green Energy — 44 Plants, 344MW, and the Green Hydrogen Challenge](https://japan-equity.com/wp-content/uploads/2026/07/p21_sq-1024x1024.jpg)
![[Obayashi] Tackling the Labor Shortage — Robotics Construction®](https://japan-equity.com/wp-content/uploads/2026/07/p14_sq-1024x1024.jpg)
