
This article is based on publicly available IR materials and is not a recommendation to buy or sell any specific securities.
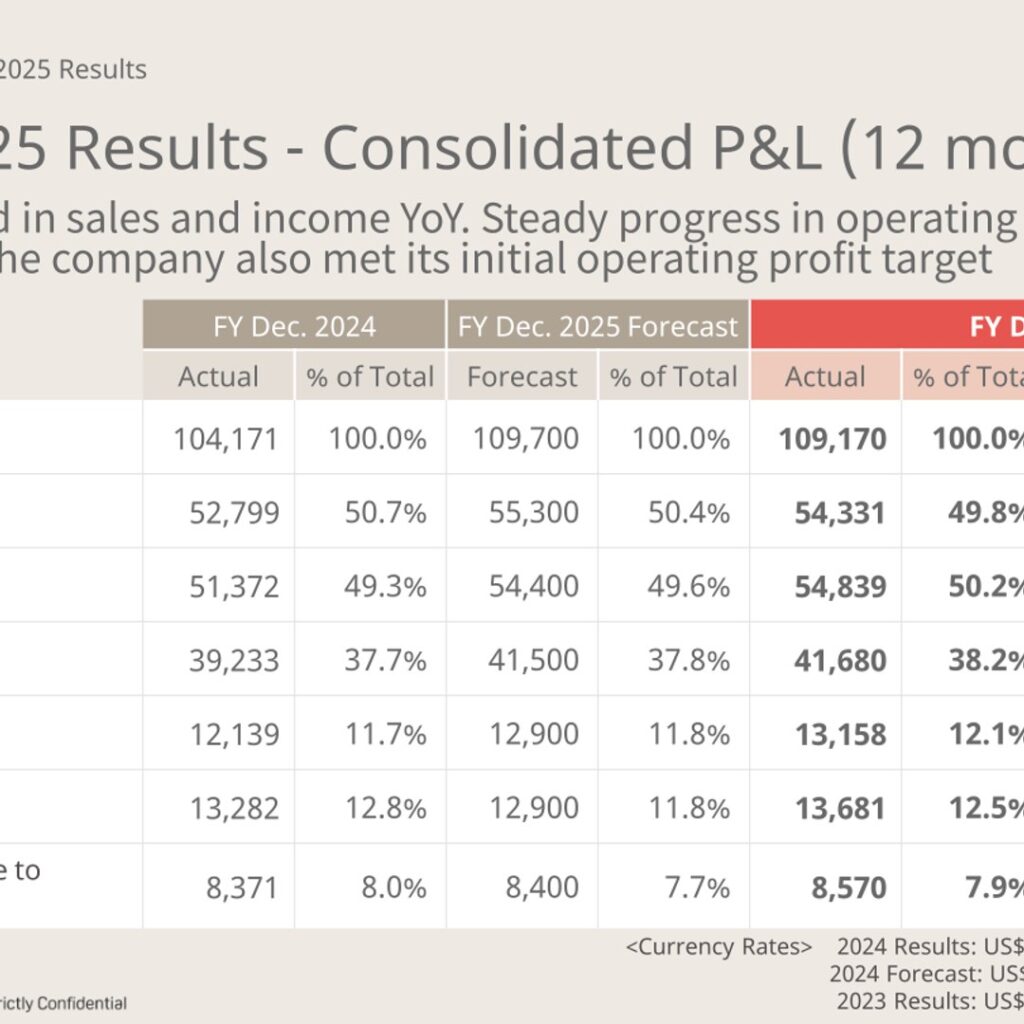
Pigeon closed FY Dec. 2025 (the 69th fiscal year, the 12 months ended December 31, 2025) with year-on-year increases in both sales and income. Net sales came to 109,170 million yen (104.8% of the previous year), operating income to 13,158 million yen (108.4%), and net income attributable to owners of parent to 8,570 million yen (102.4%). The operating margin improved to 12.1% from 11.7%, and the materials note that the consolidated operating margin has increased for two consecutive years. Alongside the results, the company disclosed its 9th Mid-Term Management Plan covering FY Dec. 2026 (70th) through FY Dec. 2028 (72nd).
Consolidated Results (Full-Year Actual)
Net sales increased across all business segments, with the China Business posting double-digit growth. Gross profit rose to 54,839 million yen (106.7%) as the gross margin improved to 50.2% from 49.3%, while SG&A expenses increased to 41,680 million yen (106.2%). Against the company’s own forecast of 109,700 million yen in net sales and 12,900 million yen in operating income, actual results came in at 99.5% and 102.0% respectively, meaning the initial operating profit target was met. The materials attribute the year-on-year operating income increase of 1.0 billion yen to increased gross profit from higher sales and gross margin improvement, which absorbed higher personnel, travel and logistics, marketing-related and other expenses.
| Item (Million JPY) | FY Dec. 2025 Actual | FY Dec. 2024 Actual | YoY Change |
|---|---|---|---|
| Net Sales | 109,170 | 104,171 | 104.8% |
| Cost of Sales | 54,331 | 52,799 | 102.9% |
| Gross Profit | 54,839 | 51,372 | 106.7% |
| SG&A Expenses | 41,680 | 39,233 | 106.2% |
| Operating Income | 13,158 | 12,139 | 108.4% |
| Ordinary Income | 13,681 | 13,282 | 103.0% |
| Net Income Attributable to Owners of Parent | 8,570 | 8,371 | 102.4% |
| Operating Margin (% of Net Sales) | 12.1% | 11.7% | — |
| Gross Margin (% of Net Sales) | 50.2% | 49.3% | — |
On the balance sheet, total assets stood at 110,088 million yen (101.6%) and net assets at 85,887 million yen (101.5%) at the end of December 2025, lifting the equity ratio to 75.3% from 74.9%. Inventories rose to 16,265 million yen, up 2,252 million yen (116.1%) from the previous fiscal year-end; the company states it will enhance efficiency and CCC by reinforcing monitoring. Borrowings were nil in both periods. The currency rates applied for FY Dec. 2025 actual results were US$1 = JPY149.66 and CNY1 = JPY20.82.
Segment Results
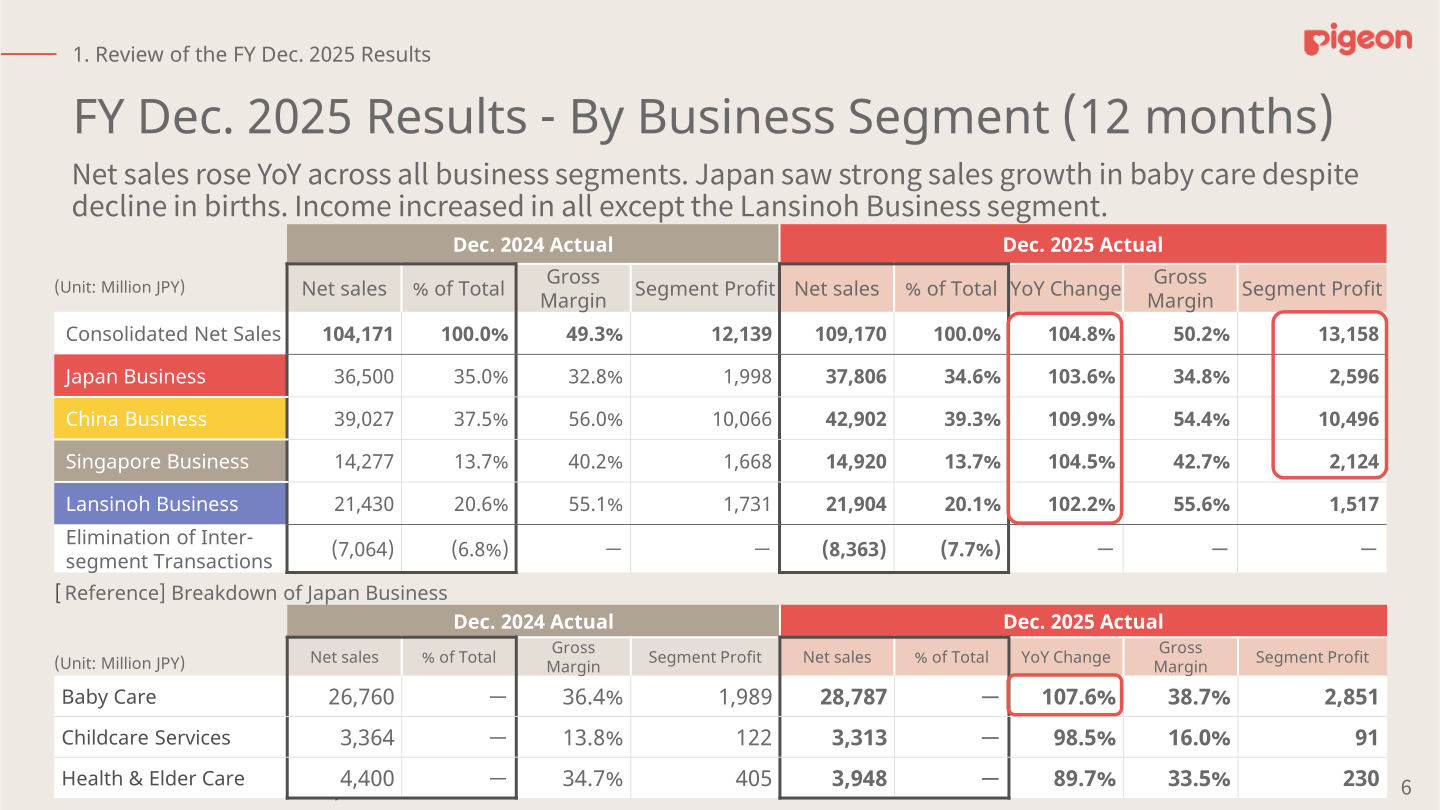
Net sales rose year on year in all four business segments, and segment profit increased in all segments except the Lansinoh Business. In Japan, sales and income rose mainly on nursing bottles/nipples and skincare products, with Q4 YTD sales of baby care products up 7.6% YoY and net sales through the company’s own e-commerce channel growing approximately 70% YoY. In China, Q4 YTD sales in mainland China ended at +6% YoY on a local-currency basis, with nursing bottles/nipples up 5.9% YoY and baby skincare up over 20%; the Q4 YTD EC ratio was 78%. In Singapore, the shift to wide-neck nursing bottles lifted the wide-neck share of nursing bottle/nipple sales by over 10 pts (to over 60%) YoY, and the segment’s gross margin in yen rose 2.5 pts YoY. Lansinoh group sales ended +2.2% YoY, with Europe strong and North America solid on nursing bottles/nipples, but income declined due to the impact of U.S. tariffs; the segment’s gross margin in yen still rose 0.5 pts YoY. Within the Japan Business, the reference breakdown shows Baby Care net sales of 28,787 million yen (107.6%) with segment profit of 2,851 million yen, Childcare Services 3,313 million yen (98.5%) with 91 million yen, and Health & Elder Care 3,948 million yen (89.7%) with 230 million yen.
| Segment (Million JPY) | Net Sales FY Dec. 2025 | Net Sales FY Dec. 2024 | YoY Change | Segment Profit FY Dec. 2025 | Segment Profit FY Dec. 2024 |
|---|---|---|---|---|---|
| Consolidated Net Sales | 109,170 | 104,171 | 104.8% | 13,158 | 12,139 |
| Japan Business | 37,806 | 36,500 | 103.6% | 2,596 | 1,998 |
| China Business | 42,902 | 39,027 | 109.9% | 10,496 | 10,066 |
| Singapore Business | 14,920 | 14,277 | 104.5% | 2,124 | 1,668 |
| Lansinoh Business | 21,904 | 21,430 | 102.2% | 1,517 | 1,731 |
| Elimination of Inter-segment Transactions | (8,363) | (7,064) | — | — | — |
FY2026 Forecast
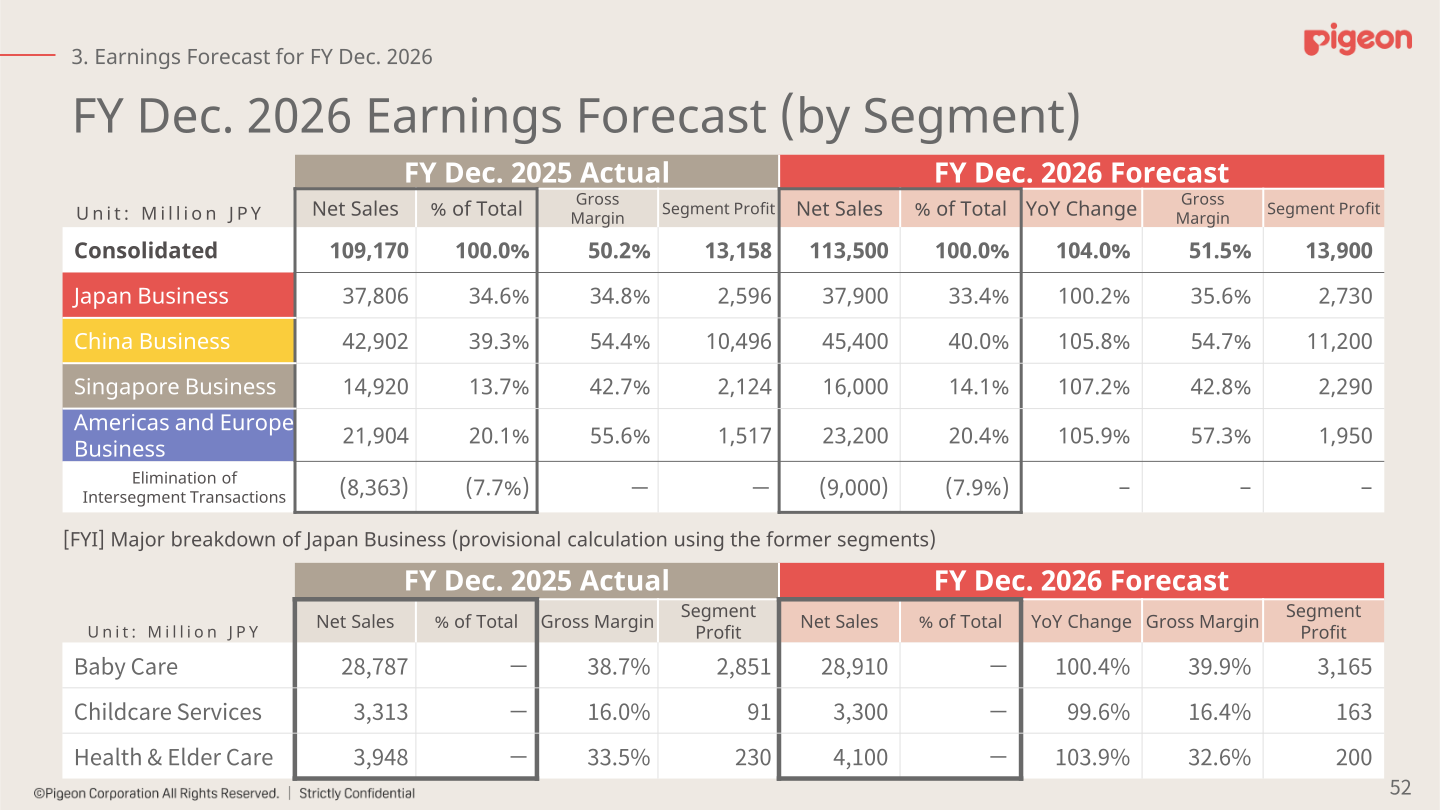
For FY Dec. 2026, Pigeon forecasts net sales of 113,500 million yen (104.0%), operating income of 13,900 million yen (105.6%), ordinary income of 14,150 million yen (103.4%), and net income attributable to owners of parent of 9,140 million yen (106.7%); the operating and ordinary income figures do not include subsidy income and other items. Gross margin is planned to rise to 51.5% while SG&A expenses increase to 44,600 million yen (107.0%), which the company describes as securing profit growth in Year 1 of the new plan despite increased SG&A from strategic front-loaded investment in North America. Assumed rates for the plan are US$1 = JPY150.00 and CNY1 = JPY21.50. From this fiscal year the former Lansinoh Business is renamed the Americas and Europe Business.
| Item (Million JPY) | FY Dec. 2026 Forecast | FY Dec. 2025 Actual | YoY Change |
|---|---|---|---|
| Net Sales | 113,500 | 109,170 | 104.0% |
| Gross Profit | 58,500 | 54,838 | 106.7% |
| SG&A Expenses | 44,600 | 41,680 | 107.0% |
| Operating Income | 13,900 | 13,158 | 105.6% |
| Ordinary Income | 14,150 | 13,681 | 103.4% |
| Net Income Attributable to Owners of Parent | 9,140 | 8,570 | 106.7% |
| Japan Business (Net Sales) | 37,900 | 37,806 | 100.2% |
| China Business (Net Sales) | 45,400 | 42,902 | 105.8% |
| Singapore Business (Net Sales) | 16,000 | 14,920 | 107.2% |
| Americas and Europe Business (Net Sales) | 23,200 | 21,904 | 105.9% |
By segment, forecast segment profit is 2,730 million yen for the Japan Business, 11,200 million yen for the China Business, 2,290 million yen for the Singapore Business, and 1,950 million yen for the Americas and Europe Business, against elimination of intersegment transactions of (9,000) million yen in net sales. Investment-related indicators for FY Dec. 2026 are capital investment of 4,700 million yen, depreciation and amortization of 4,500 million yen, and R&D expenses of 4,600 million yen, versus FY Dec. 2025 actuals of 3,360 million yen, 4,601 million yen and 4,065 million yen respectively.
Shareholder Returns
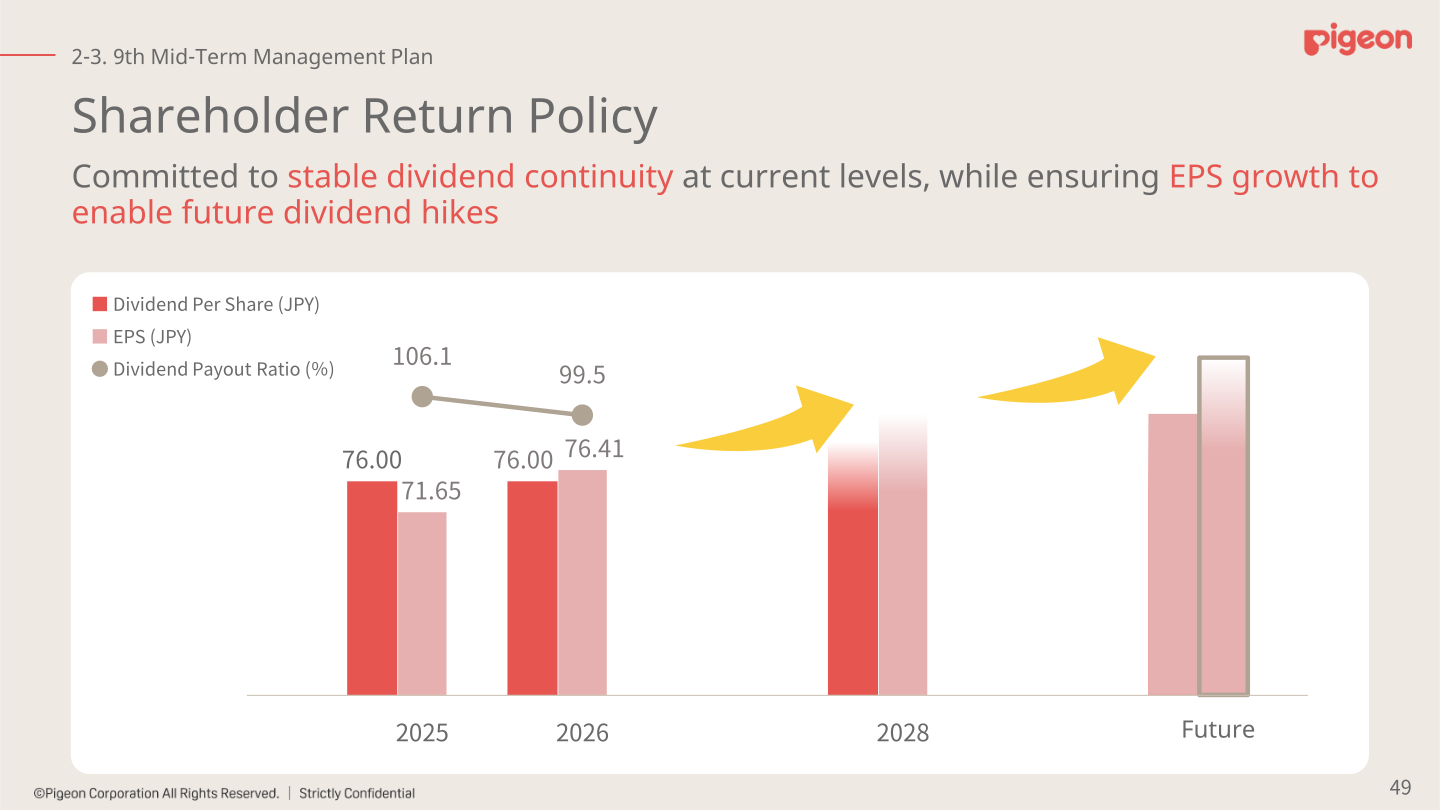
The annual dividend for FY Dec. 2025 was 76.00 yen per share (interim 38 yen, year-end 38 yen), unchanged from FY Dec. 2024, for a dividend payout ratio of 106.1%. For FY Dec. 2026 the company forecasts the same 38 yen interim and 38 yen year-end dividend, a payout ratio of 99.5% on forecast EPS of 76.41 yen (FY Dec. 2025 EPS was 71.65 yen). The stated policy is a commitment to stable dividend continuity at current levels while ensuring EPS growth to enable future dividend hikes. Under the capital allocation strategy for 2026-2028, the sources are sales CF of 34.0 billion yen and cash on hand of 40.0 billion yen, allocated to growth investment (including M&A), maintenance capital expenditure of 14.0 billion yen, and shareholder returns of 27.0 billion yen, with the aim of maintaining stable dividends while seeking further enhancement of shareholder returns.
| Item | FY Dec. 2024 Actual | FY Dec. 2025 Actual | FY Dec. 2026 Forecast |
|---|---|---|---|
| Interim dividend per share (yen) | 38 | 38 | 38 |
| Year-end dividend per share (yen) | 38 | 38 | 38 |
| Dividend payout ratio | 108.7% | 106.1% | 99.5% |
| Capital investment (Million JPY) | 3,760 | 3,360 | 4,700 |
| Depreciation and amortization (Million JPY) | 4,876 | 4,601 | 4,500 |
| R&D expenses (Million JPY) | 4,286 | 4,065 | 4,600 |
9th Mid-Term Management Plan (FY Dec. 2026 – FY Dec. 2028)
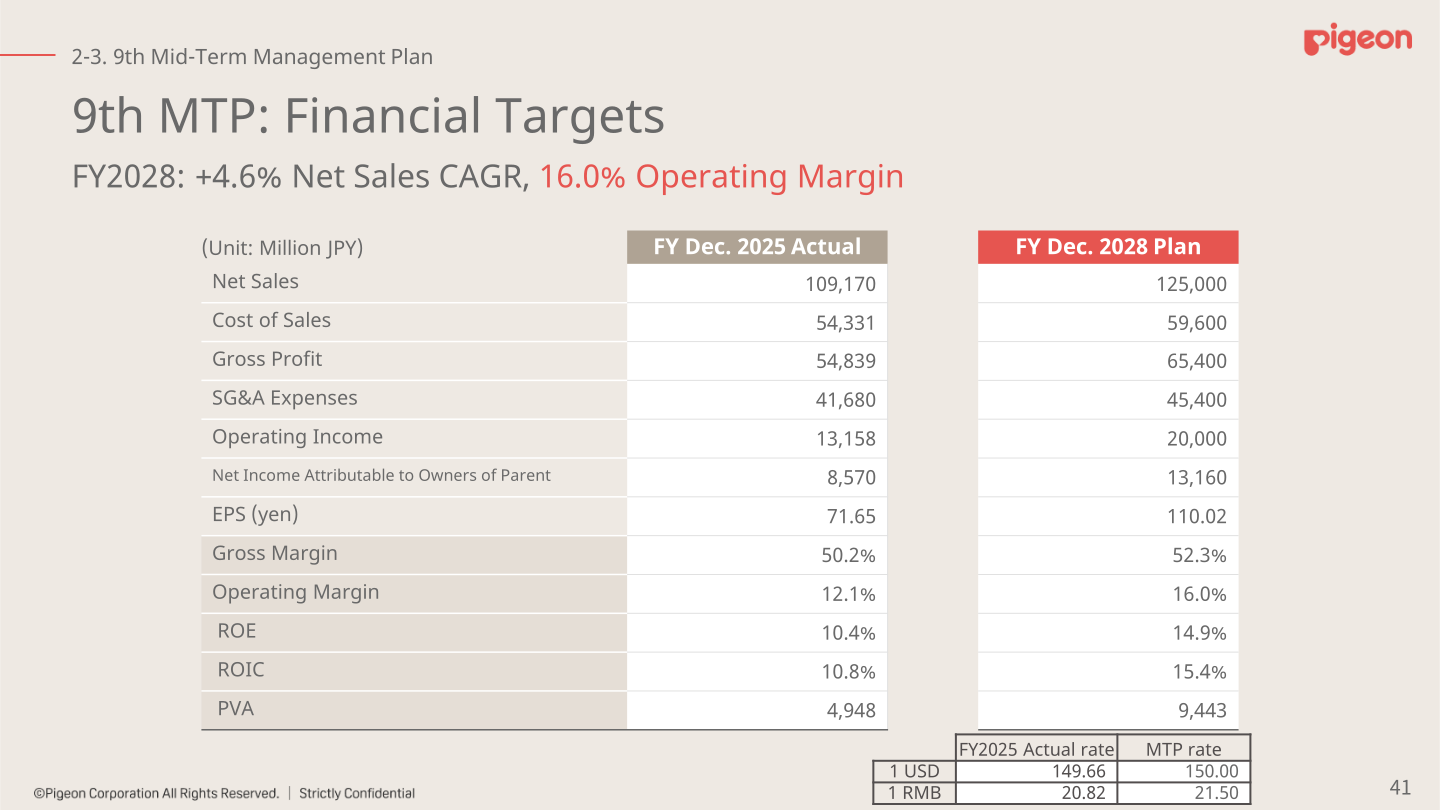
The 9th Mid-Term Management Plan targets net sales of 125,000 million yen and operating income of 20,000 million yen in FY Dec. 2028, equivalent to an operating margin of 16.0% and a net sales CAGR of 4.6% from FY Dec. 2025. Net income attributable to owners of parent is planned at 13,160 million yen and EPS at 110.02 yen, with ROE of 14.9% and ROIC of 15.4% versus 10.4% and 10.8% in FY Dec. 2025, and PVA of 9,443 million yen versus 4,948 million yen. The basic direction is to accelerate growth of core product groups centered on nursing bottles, expand LTV with Age-up products, accelerate growth in the top-priority Americas and Europe region and the high-potential Singapore business, and secure group profitability through stable growth in the Japan and China businesses, supported by reinforced management foundations and ESG initiatives.
Segment targets for FY Dec. 2028 are net sales of 39,660 million yen and segment profit of 3,100 million yen in Japan, 50,100 million yen and 12,520 million yen in China, 18,500 million yen and 3,140 million yen in Singapore, and 26,800 million yen and 4,020 million yen in the Americas and Europe Business. On the preceding 8th Mid-Term Management Plan (2023-2025), the company states that the financial target was not achieved because of the impact of ALPS treated water in the China business and inventory adjustment in the Singapore business in the first fiscal year, although operating income as a percentage of sales bottomed out in 2023.
This article is an analysis based on publicly available information and is not a recommendation to buy or sell any specific securities. Investment decisions are your own responsibility.
![[Obayashi] Investors’ Guide 2026 — The Complete 24-Article Breakdown](https://japan-equity.com/wp-content/uploads/2026/07/hub_cover-1024x1024.png)
![[Obayashi] IR & SR Policy — Feeding Dialogue Back into Management](https://japan-equity.com/wp-content/uploads/2026/07/p32_sq-1024x1024.jpg)
![[Obayashi] Real Estate Development — 18.7% Margin, ¥287.7bn Unrealized Gains](https://japan-equity.com/wp-content/uploads/2026/07/p20_sq-1024x1024.jpg)
![[Obayashi] Domestic Civil Engineering — Resilience Spending Supports 9.6% Margin](https://japan-equity.com/wp-content/uploads/2026/07/p11_sq-1024x1024.jpg)
![[Obayashi] Share Price & External Ratings — vs TOPIX, ESG Index Inclusion](https://japan-equity.com/wp-content/uploads/2026/07/p40_sq-1024x1024.jpg)
![[Construction] ¥75.5tn Investment, Shrinking Workforce — Big-5 Market Share](https://japan-equity.com/wp-content/uploads/2026/07/p12_sq-1024x1024.jpg)



![[Obayashi] Capital Policy & Shareholder Returns — ROE 10%+, DOE ~5%, ¥100bn Buyback](https://japan-equity.com/wp-content/uploads/2026/07/p27_sq-1024x1024.jpg)
![[Obayashi] Reducing Cross-Shareholdings — ¥285.2bn Sold in Five Years](https://japan-equity.com/wp-content/uploads/2026/07/p29_sq-1024x1024.jpg)
![[Obayashi] ¥750bn Investment Plan — ¥300bn to Development, ¥190bn to Tech/DX](https://japan-equity.com/wp-content/uploads/2026/07/p30_sq-1024x1024.jpg)
![[Obayashi] MTP2022 KPIs — Operating Profit ~2x Target, ROE 14.4%](https://japan-equity.com/wp-content/uploads/2026/07/p25_sq-1024x1024.jpg)
![[Obayashi] Cash Allocation — ¥420bn Investment CF Over Five Years](https://japan-equity.com/wp-content/uploads/2026/07/p26_sq-1024x1024.jpg)
![[Obayashi] Green Energy — 44 Plants, 344MW, and the Green Hydrogen Challenge](https://japan-equity.com/wp-content/uploads/2026/07/p21_sq-1024x1024.jpg)
![[Obayashi] Tackling the Labor Shortage — Robotics Construction®](https://japan-equity.com/wp-content/uploads/2026/07/p14_sq-1024x1024.jpg)
