
This article is based on publicly available IR materials and is not a recommendation to buy or sell any specific securities.
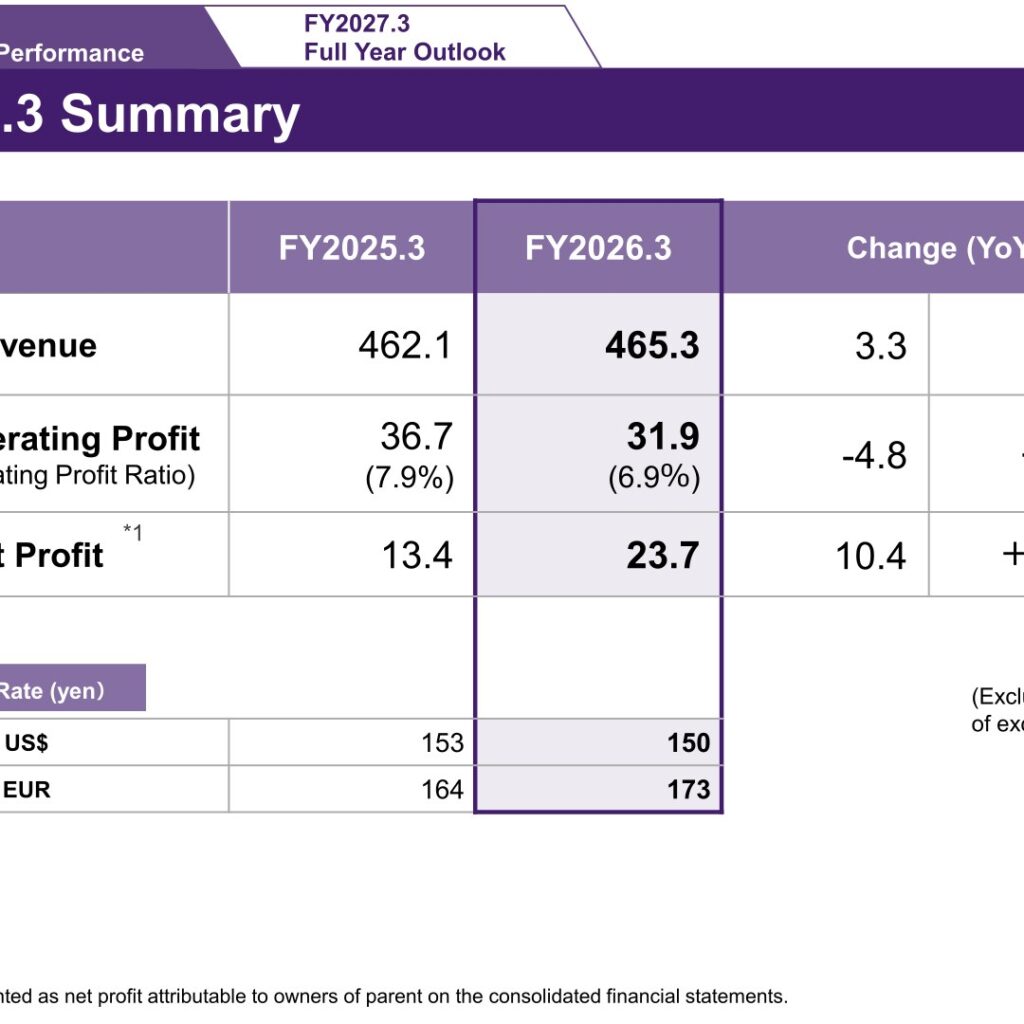
Note: Yamaha Corporation labels the fiscal year ended March 31, 2026 as “FY2026.3,” and this article keeps the company’s labels in all text and tables while classifying the year as FY2025 under this site’s convention. For FY2026.3, Yamaha reported revenue of 465.3 billion yen, an increase of 3.3 billion yen or +0.7% year on year, and core operating profit of 31.9 billion yen, a decrease of 4.8 billion yen or -13.2%, with the core operating profit ratio down to 6.9% from 7.9%. Net profit was 23.7 billion yen, up 10.4 billion yen or +77.7%. For FY2027.3 the company projects revenue of 490.0 billion yen (+5.3%), core operating profit of 38.0 billion yen (+19.2%) and net profit of 28.0 billion yen (+18.0%).
Consolidated Results (FY2026.3 Full-Year Actual)
According to the company, despite sluggish market conditions in China and the decline in high demand for professional audio equipment in Europe and the U.S., revenue remained on par with the previous year due to a recovery in musical instrument sales and the weakening of the yen. Although structural reforms in underperforming businesses and price adjustments were implemented, core operating profit declined due to the impact of additional U.S. tariffs, rising component and raw material costs, and a shift in the product mix resulting from lower sales of digital mixers.
| Item | FY2025.3 | FY2026.3 | Change (YoY) |
|---|---|---|---|
| Revenue (¥ Bil.) | 462.1 | 465.3 | 3.3 / +0.7% |
| Core Operating Profit (¥ Bil.) | 36.7 | 31.9 | -4.8 / -13.2% |
| Core Operating Profit Ratio | 7.9% | 6.9% | – |
| Net Profit* (¥ Bil.) | 13.4 | 23.7 | 10.4 / +77.7% |
| Exchange Rate: US$ (yen) | 153 | 150 | – |
| Exchange Rate: EUR (yen) | 164 | 173 | – |
*Net profit is presented as net profit attributable to owners of parent on the consolidated financial statements. Excluding the impact of exchange rates, the company states that revenue was -0% year on year.
Segment Results
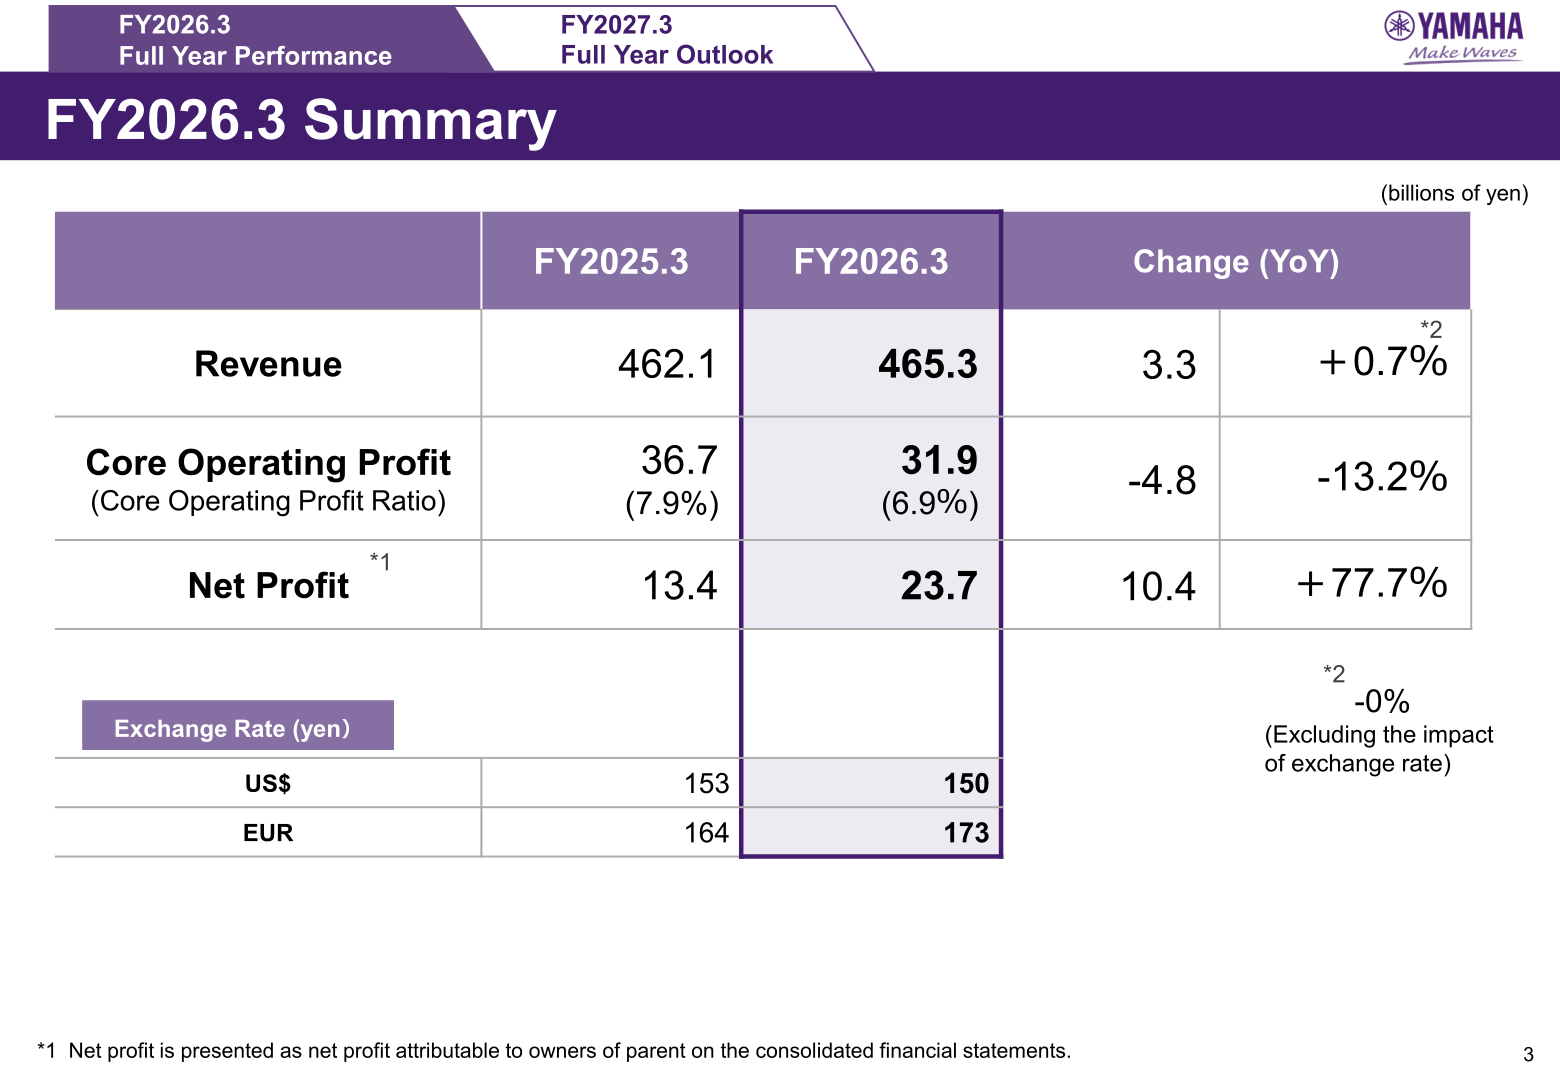
Musical Instruments revenue rose to 304.9 billion yen from 296.1 billion yen, while segment core operating profit fell to 21.2 billion yen from 22.1 billion yen and the core operating profit ratio declined 0.5 points to 7.0%. Audio Equipment revenue fell to 142.4 billion yen from 147.8 billion yen and core operating profit fell to 10.8 billion yen from 14.3 billion yen, with the ratio down 2.2 points to 7.6%. The Others segment recorded revenue of 18.0 billion yen and a core operating loss of 0.1 billion yen.
| Segment | Metric | FY2025.3 | FY2026.3 | Change | Exchange Rate Impact |
|---|---|---|---|---|---|
| Musical Instruments | Revenue (¥ Bil.) | 296.1 | 304.9 | 8.8 | 2.8 |
| Musical Instruments | Core Operating Profit (¥ Bil.) | 22.1 | 21.2 | -0.9 | 2.3 |
| Musical Instruments | Core Operating Profit Ratio | 7.5% | 7.0% | -0.5P | – |
| Audio Equipment | Revenue (¥ Bil.) | 147.8 | 142.4 | -5.3 | 1.5 |
| Audio Equipment | Core Operating Profit (¥ Bil.) | 14.3 | 10.8 | -3.6 | 0.3 |
| Audio Equipment | Core Operating Profit Ratio | 9.7% | 7.6% | -2.2P | – |
| Others | Revenue (¥ Bil.) | 18.2 | 18.0 | -0.3 | -0.1 |
| Others | Core Operating Profit (¥ Bil.) | 0.3 | -0.1 | -0.4 | 0.1 |
| Others | Core Operating Profit Ratio | 1.6% | -0.6% | -2.2P | – |
Revenue by Major Product Category
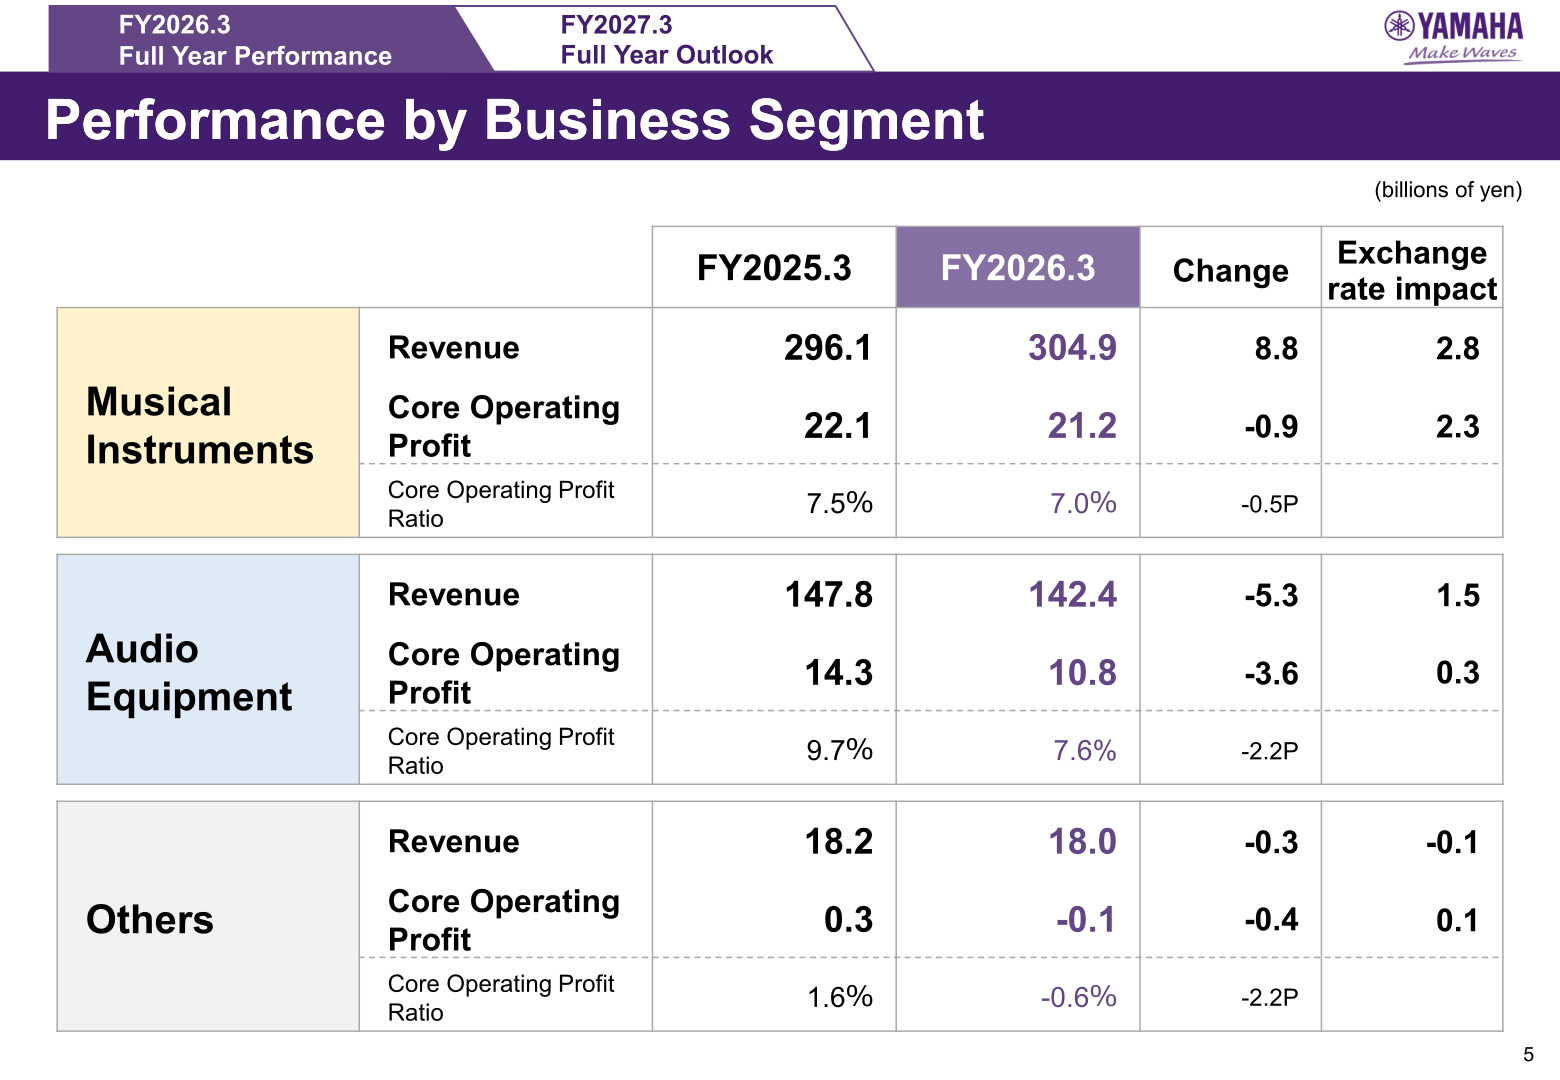
In Musical Instruments, the company states that revenue increased in all categories except for pianos: piano sales declined due to weak demand for high-end products despite a turnaround in revenue growth in China during the second half of the year; digital musical instruments increased thanks to strong reception of various new products; wind, string and percussion instruments increased driven by steady demand; and guitars achieved double-digit growth by steadily expanding market share in North America and emerging markets. In Audio Equipment, structural reforms in home audio are in progress for consumer use, sales for professional use declined as high demand in Europe and the U.S. from the previous year leveled off despite strong sales in emerging markets, and sales for mobility use increased in Japan as planned while sales to China declined.
| Product Category | FY2025.3 | FY2026.3 | FY2027.3 (Projections) |
|---|---|---|---|
| Pianos (¥ Bil.) | 42.6 | 40.0 | 42.2 |
| Digital Musical Instruments (¥ Bil.) | 100.9 | 105.4 | 113.4 |
| Winds, Strings/Percussion (¥ Bil.) | 69.7 | 72.4 | 75.1 |
| Guitars (¥ Bil.) | 44.2 | 49.3 | 52.9 |
| Audio: Consumer Use (¥ Bil.) | 44.9 | 44.0 | 46.9 |
| Audio: Professional Use (¥ Bil.) | 72.1 | 69.7 | 75.7 |
| Audio: Mobility Use (¥ Bil.) | 18.8 | 16.5 | 17.2 |
FY2027.3 Outlook
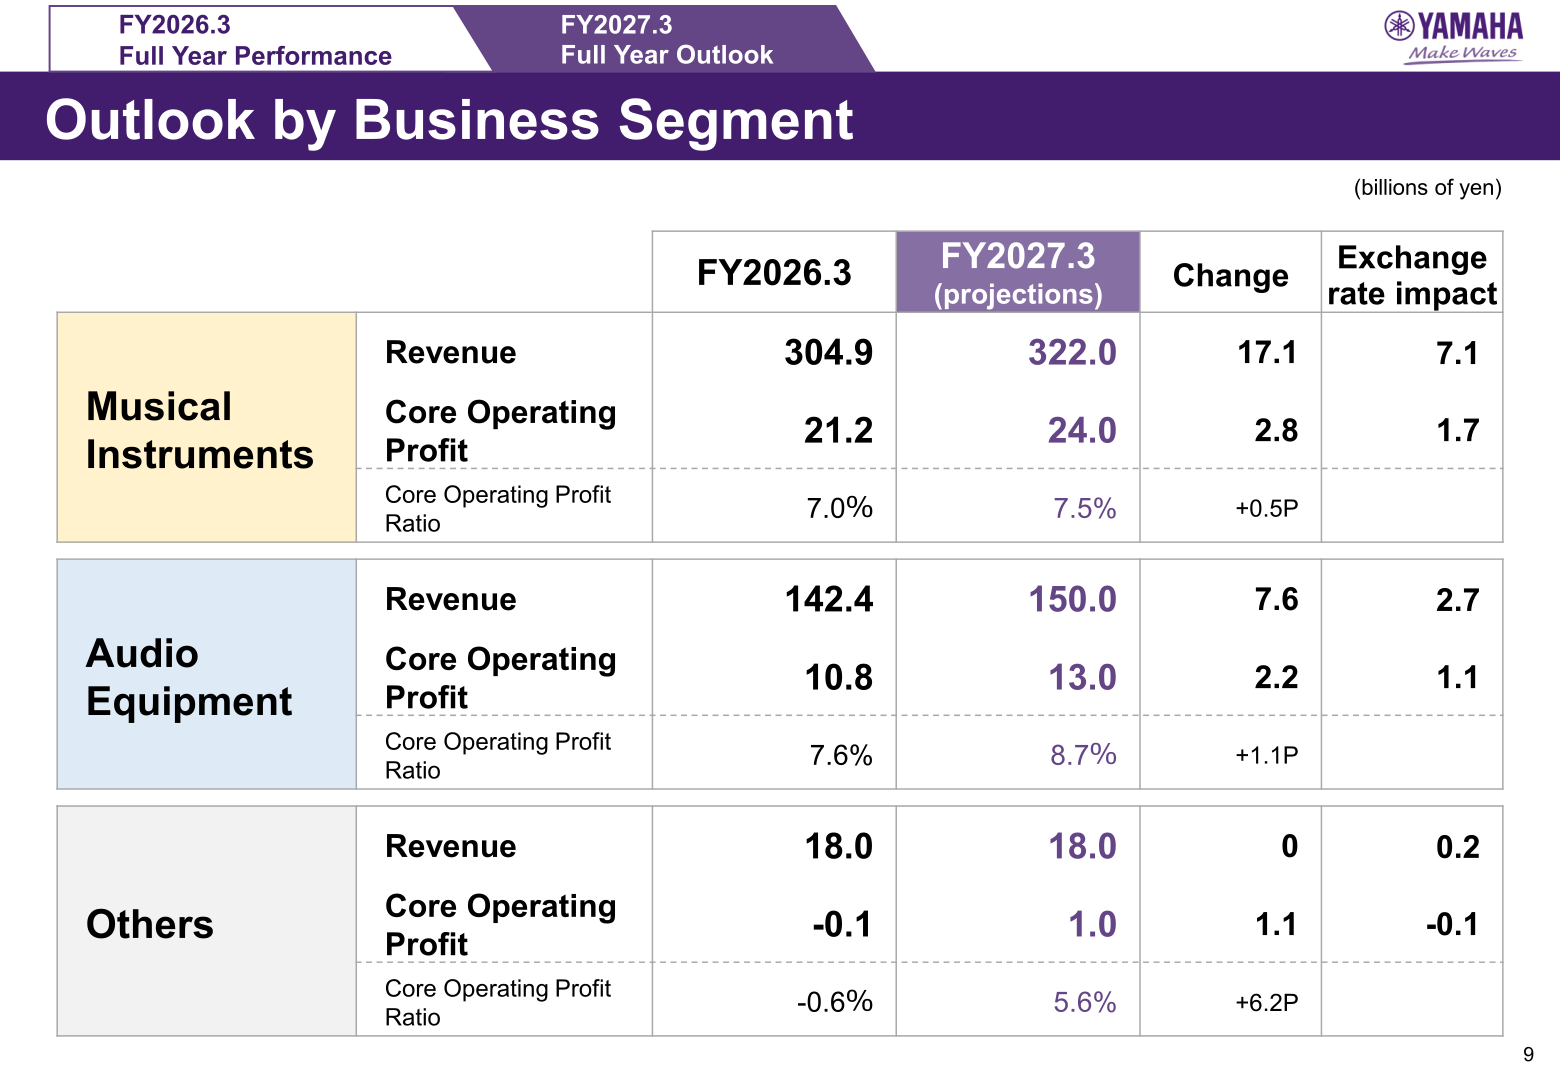
The company states that, despite uncertainty in the external environment, revenue is forecast to return to a growth trajectory across all regions, and core operating profit is expected to increase, with growth investments pursued from a medium-term perspective while leveraging the effects of structural reforms and implementing optimal pricing to offset external impacts including rising procurement costs. Excluding the impact of exchange rates, revenue growth is projected at +3.1%.
| Item | FY2026.3 | FY2027.3 (Projections) | Change (YoY) |
|---|---|---|---|
| Revenue (¥ Bil.) | 465.3 | 490.0 | 24.7 / +5.3% |
| Core Operating Profit (¥ Bil.) | 31.9 | 38.0 | 6.1 / +19.2% |
| Core Operating Profit Ratio | 6.9% | 7.8% | – |
| Net Profit* (¥ Bil.) | 23.7 | 28.0 | 4.3 / +18.0% |
| Exchange Rate: US$ (yen) | 150 | 155 | – |
| Exchange Rate: EUR (yen) | 173 | 180 | – |
*Net profit is presented as net profit attributable to owners of parent on the consolidated financial statements. Alongside the assumed exchange rates, the presentation shows sensitivity figures of JPY 910 million for revenue and JPY 110 million for profit against the U.S. dollar, and JPY 660 million for revenue and JPY 410 million for profit against the euro.
| Segment | Metric | FY2026.3 | FY2027.3 (Projections) | Change | Exchange Rate Impact |
|---|---|---|---|---|---|
| Musical Instruments | Revenue (¥ Bil.) | 304.9 | 322.0 | 17.1 | 7.1 |
| Musical Instruments | Core Operating Profit (¥ Bil.) | 21.2 | 24.0 | 2.8 | 1.7 |
| Musical Instruments | Core Operating Profit Ratio | 7.0% | 7.5% | +0.5P | – |
| Audio Equipment | Revenue (¥ Bil.) | 142.4 | 150.0 | 7.6 | 2.7 |
| Audio Equipment | Core Operating Profit (¥ Bil.) | 10.8 | 13.0 | 2.2 | 1.1 |
| Audio Equipment | Core Operating Profit Ratio | 7.6% | 8.7% | +1.1P | – |
| Others | Revenue (¥ Bil.) | 18.0 | 18.0 | 0 | 0.2 |
| Others | Core Operating Profit (¥ Bil.) | -0.1 | 1.0 | 1.1 | -0.1 |
| Others | Core Operating Profit Ratio | -0.6% | 5.6% | +6.2P | – |
Other Income and Expenses
Below core operating profit, total other income and expenses improved to -2.6 billion yen from -16.0 billion yen, lifting operating profit to 29.3 billion yen from 20.7 billion yen. Financial income and expenses totaled 6.0 billion yen, and profit before income taxes was 35.3 billion yen.
| Item (¥ Bil.) | FY2025.3 | FY2026.3 | FY2027.3 (Projections) |
|---|---|---|---|
| Core Operating Profit | 36.7 | 31.9 | 38.0 |
| Profit from (loss on) disposal of fixed assets | 0.4 | 0.7 | 0 |
| Other income and expenses: Others | -16.4 | -3.3 | 0 |
| Other income and expenses: Total | -16.0 | -2.6 | 0 |
| Operating Profit | 20.7 | 29.3 | 38.0 |
| Dividends income | 2.6 | 1.6 | 1.9 |
| Financial income and expenses: Others | -0.8 | 4.4 | -0.9 |
| Financial income and expenses: Total | 1.8 | 6.0 | 1.0 |
| Profit before Income Taxes | 22.5 | 35.3 | 39.0 |
| Income taxes | -9.0 | -11.5 | -11.0 |
| Net profit attributable to non-controlling interests | -0.1 | -0.1 | 0.1 |
| Net Profit* | 13.4 | 23.7 | 28.0 |
*Net profit is presented as profit attributable to owners of the parent on the consolidated financial statements.
Balance Sheet and Investment
Total assets increased 26.3 billion yen to 617.6 billion yen as of March 31, 2026, with cash and cash equivalents up 9.1 billion yen to 109.0 billion yen and total equity up 29.6 billion yen to 479.7 billion yen. Capital expenditure was 14.4 billion yen against depreciation of 14.1 billion yen, and R&D expenses were 27.7 billion yen.
| Item (¥ Bil.) | As of March 31, 2025 | As of March 31, 2026 | Change | As of March 31, 2027 (Projections) |
|---|---|---|---|---|
| Cash and cash equivalents | 99.8 | 109.0 | 9.1 | 140.1 |
| Trade and other receivables | 87.3 | 87.7 | 0.4 | 89.9 |
| Other financial assets | 5.2 | 4.2 | -1.0 | 4.3 |
| Inventories | 150.5 | 152.3 | 1.8 | 146.0 |
| Other current assets | 9.1 | 11.8 | 2.7 | 3.8 |
| Non-current assets | 239.3 | 252.6 | 13.3 | 258.0 |
| Total Assets | 591.3 | 617.6 | 26.3 | 642.0 |
| Current liabilities | 106.7 | 98.0 | -8.7 | 101.2 |
| Non-current liabilities | 34.5 | 39.8 | 5.3 | 41.2 |
| Total equity | 450.1 | 479.7 | 29.6 | 499.6 |
| Item (¥ Bil.) | FY2025.3 | FY2026.3 | FY2027.3 (Projections) |
|---|---|---|---|
| Capital Expenditure (total) | 20.0 | 14.4 | 16.0 |
| – Musical Instruments | 14.6 | 9.2 | 10.5 |
| – Audio Equipment | 4.1 | 4.2 | 4.5 |
| – Others | 1.3 | 1.0 | 1.0 |
| Depreciation | 14.3 | 14.1 | 15.5 |
| R&D Expenses (total) | 27.0 | 27.7 | 29.0 |
| – Musical Instruments | 11.8 | 12.0 | 12.5 |
| – Audio Equipment | 14.0 | 14.5 | 15.5 |
| – Others | 1.2 | 1.2 | 1.0 |
Shareholder Returns
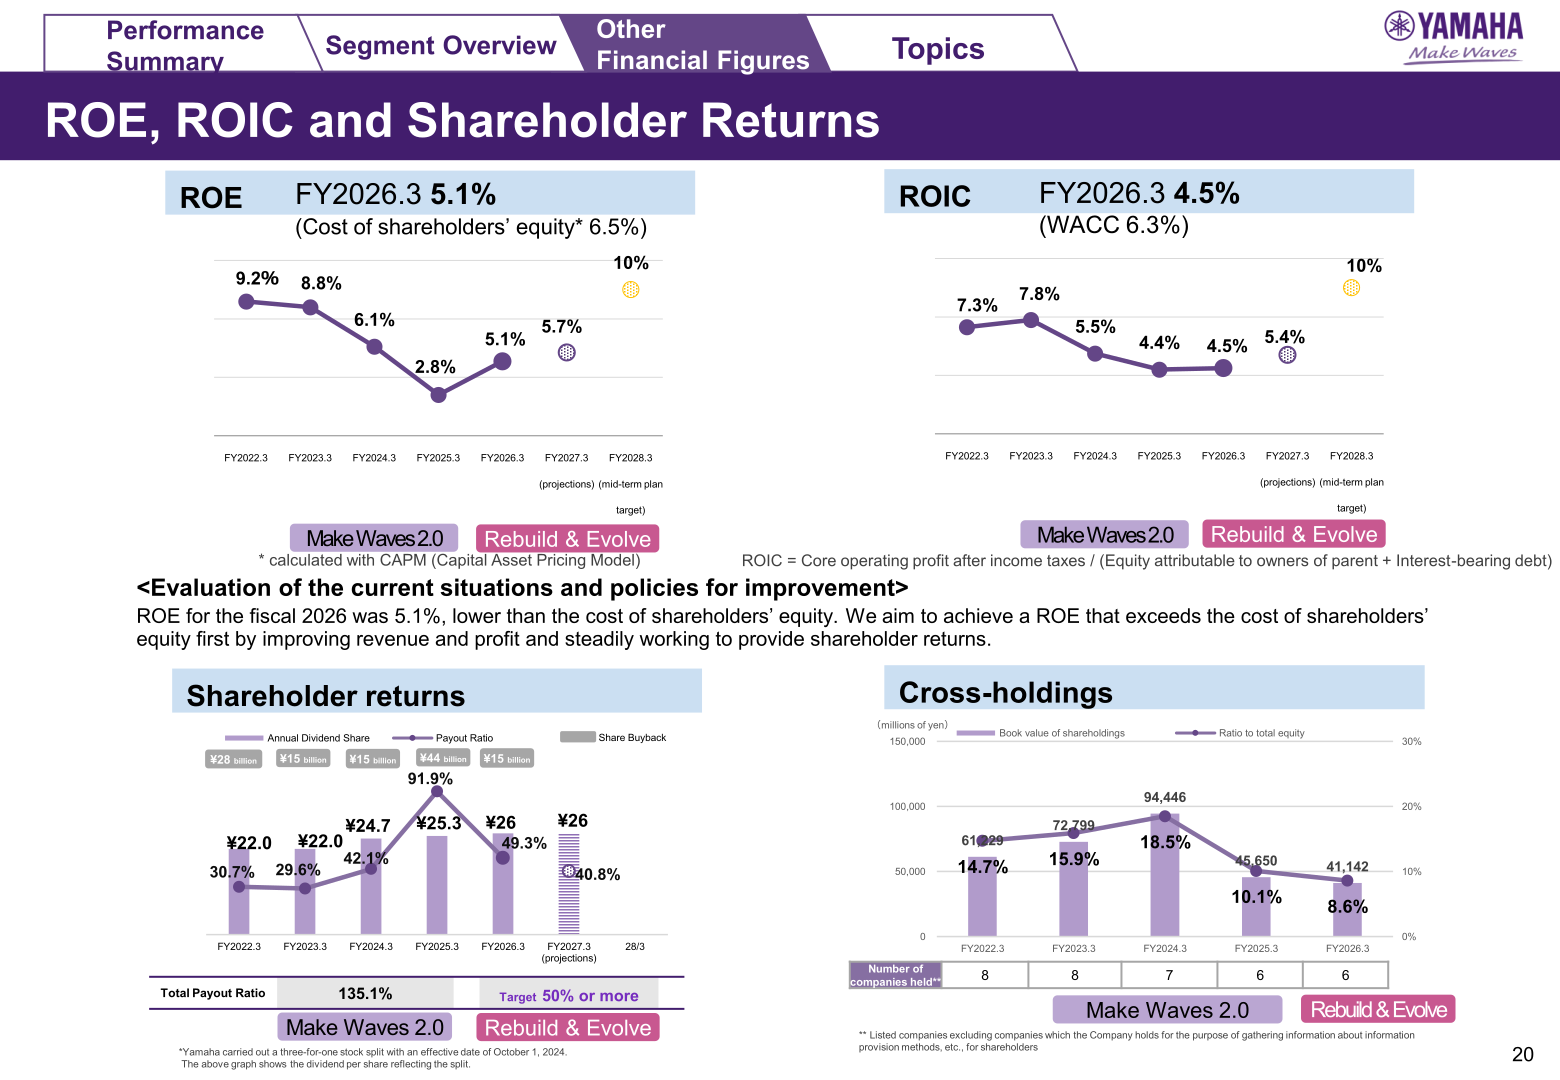
The annual dividend per share for FY2026.3 was 26 yen, with a payout ratio of 49.3%, and the company projects an annual dividend of 26 yen for FY2027.3 with a payout ratio of 40.8%. A share buyback of 15 billion yen is shown for FY2026.3, following 44 billion yen for FY2025.3. Yamaha carried out a three-for-one stock split with an effective date of October 1, 2024, and the dividend per share figures reflect the split. On capital efficiency, the company states that ROE for the fiscal 2026 was 5.1%, lower than the cost of shareholders’ equity of 6.5%, and that it aims to achieve a ROE that exceeds the cost of shareholders’ equity first by improving revenue and profit and steadily working to provide shareholder returns. ROIC was 4.5% against a WACC of 6.3%. The book value of cross-shareholdings fell to 41,142 million yen, or 8.6% of total equity, held in 6 companies.
| Item | FY2022.3 | FY2023.3 | FY2024.3 | FY2025.3 | FY2026.3 | FY2027.3 (Projections) |
|---|---|---|---|---|---|---|
| Annual Dividend per Share (¥) | 22.0 | 22.0 | 24.7 | 25.3 | 26 | 26 |
| Payout Ratio | 30.7% | 29.6% | 42.1% | 91.9% | 49.3% | 40.8% |
| Share Buyback (¥ Bil.) | 28 | 15 | 15 | 44 | 15 | – |
| ROE | 9.2% | 8.8% | 6.1% | 2.8% | 5.1% | 5.7% |
| ROIC | 7.3% | 7.8% | 5.5% | 4.4% | 4.5% | 5.4% |
Medium-Term Management Plan
FY2026.3 was the first year of the medium-term management plan “Rebuild & Evolve,” whose targets are set for FY2028.3. The company states that results fell short of targets due to the slump in the Chinese market and the impact of external factors such as tariffs and rising costs, while structural reforms in underperforming businesses, the business expansion of added-value experiences and services, and the creation of new businesses are progressing as planned. Progress cited includes completing the reorganization of acoustic piano production sites, continued sales growth and improved profitability in guitars, streamlining the home audio business and expanding outsourced production, and establishing a growth foundation for “Evolving to Create the Future.” Remaining issues cited are that financial targets were not met (revenue CAGR, ROE and operating margin) and that measures to counter rising costs were insufficient. For the second year, the company plans to promote price optimization and accelerate measures to address rising costs, increase sales of high-value-added products, expand market share through new product launches, invest proactively in “Evolving to Create the Future,” continue to improve capital efficiency, and strengthen human capital and corporate governance. The company also decided to discontinue the golf products business.
| Management Target | First-Year Result | Mid-Term Target | Assessment |
|---|---|---|---|
| Revenue growth rate (CAGR) | 0.7% | 5% | Fair |
| Core operating profit ratio | 6.9% | 13.5% | Fair |
| ROE | 5.1% | 10% | Fair |
| Total return ratio | 112% | 50% or more | Excellent |
| Revenue CAGR: Musical Instruments | 2.0% | 4% | Fair |
| Revenue CAGR: Audio Equipment | -4.7% | 7% | Fair |
| Core operating profit ratio: Musical Instruments | 7.0% | 14% | Fair |
| Core operating profit ratio: Audio Equipment | 7.6% | 12% | Fair |
| Strategic investments | ¥11.4 billion | ¥60 billion | Fair |
| Yamaha Music IDs | 8 million ID | 10 million ID | Good |
| India and Philippines growth rate (CAGR) | 7% | 18% | Fair |
| Commercializations and service adoptions in new/adjacent areas | 7 | 20 | Good |
| ROIC by segment (% increase): Musical Instruments | -0.4% | +7% | Fair |
| ROIC by segment (% increase): Audio Equipment | -1.3% | +3% | Fair |
| Investment in human capital | 1.14 | 1.5 | Good |
| Percentage of female managers | 19.6% | 24% | Good |
| Sustainably sourced timber | 71.2% | 80% | Good |
| Elimination of plastic packaging | -28.8% | -25% | Excellent |
| CO2 emission reduction rate | -39.0% | -30% | Excellent |
Assessments are as shown in the presentation: Excellent = exceeded plan, Good = proceeded as planned, Fair = measures progressed, but lagged behind plan.
This article is an analysis based on publicly available information and is not a recommendation to buy or sell any specific securities. Investment decisions are your own responsibility.
![[Obayashi] Investors’ Guide 2026 — The Complete 24-Article Breakdown](https://japan-equity.com/wp-content/uploads/2026/07/hub_cover-1024x1024.png)
![[Obayashi] IR & SR Policy — Feeding Dialogue Back into Management](https://japan-equity.com/wp-content/uploads/2026/07/p32_sq-1024x1024.jpg)
![[Obayashi] Real Estate Development — 18.7% Margin, ¥287.7bn Unrealized Gains](https://japan-equity.com/wp-content/uploads/2026/07/p20_sq-1024x1024.jpg)
![[Obayashi] Domestic Civil Engineering — Resilience Spending Supports 9.6% Margin](https://japan-equity.com/wp-content/uploads/2026/07/p11_sq-1024x1024.jpg)
![[Obayashi] Share Price & External Ratings — vs TOPIX, ESG Index Inclusion](https://japan-equity.com/wp-content/uploads/2026/07/p40_sq-1024x1024.jpg)
![[Construction] ¥75.5tn Investment, Shrinking Workforce — Big-5 Market Share](https://japan-equity.com/wp-content/uploads/2026/07/p12_sq-1024x1024.jpg)



![[Obayashi] Capital Policy & Shareholder Returns — ROE 10%+, DOE ~5%, ¥100bn Buyback](https://japan-equity.com/wp-content/uploads/2026/07/p27_sq-1024x1024.jpg)
![[Obayashi] Reducing Cross-Shareholdings — ¥285.2bn Sold in Five Years](https://japan-equity.com/wp-content/uploads/2026/07/p29_sq-1024x1024.jpg)
![[Obayashi] ¥750bn Investment Plan — ¥300bn to Development, ¥190bn to Tech/DX](https://japan-equity.com/wp-content/uploads/2026/07/p30_sq-1024x1024.jpg)
![[Obayashi] MTP2022 KPIs — Operating Profit ~2x Target, ROE 14.4%](https://japan-equity.com/wp-content/uploads/2026/07/p25_sq-1024x1024.jpg)
![[Obayashi] Cash Allocation — ¥420bn Investment CF Over Five Years](https://japan-equity.com/wp-content/uploads/2026/07/p26_sq-1024x1024.jpg)
![[Obayashi] Green Energy — 44 Plants, 344MW, and the Green Hydrogen Challenge](https://japan-equity.com/wp-content/uploads/2026/07/p21_sq-1024x1024.jpg)
![[Obayashi] Tackling the Labor Shortage — Robotics Construction®](https://japan-equity.com/wp-content/uploads/2026/07/p14_sq-1024x1024.jpg)
