
This article is based on publicly available IR materials and is not a recommendation to buy or sell any specific securities.
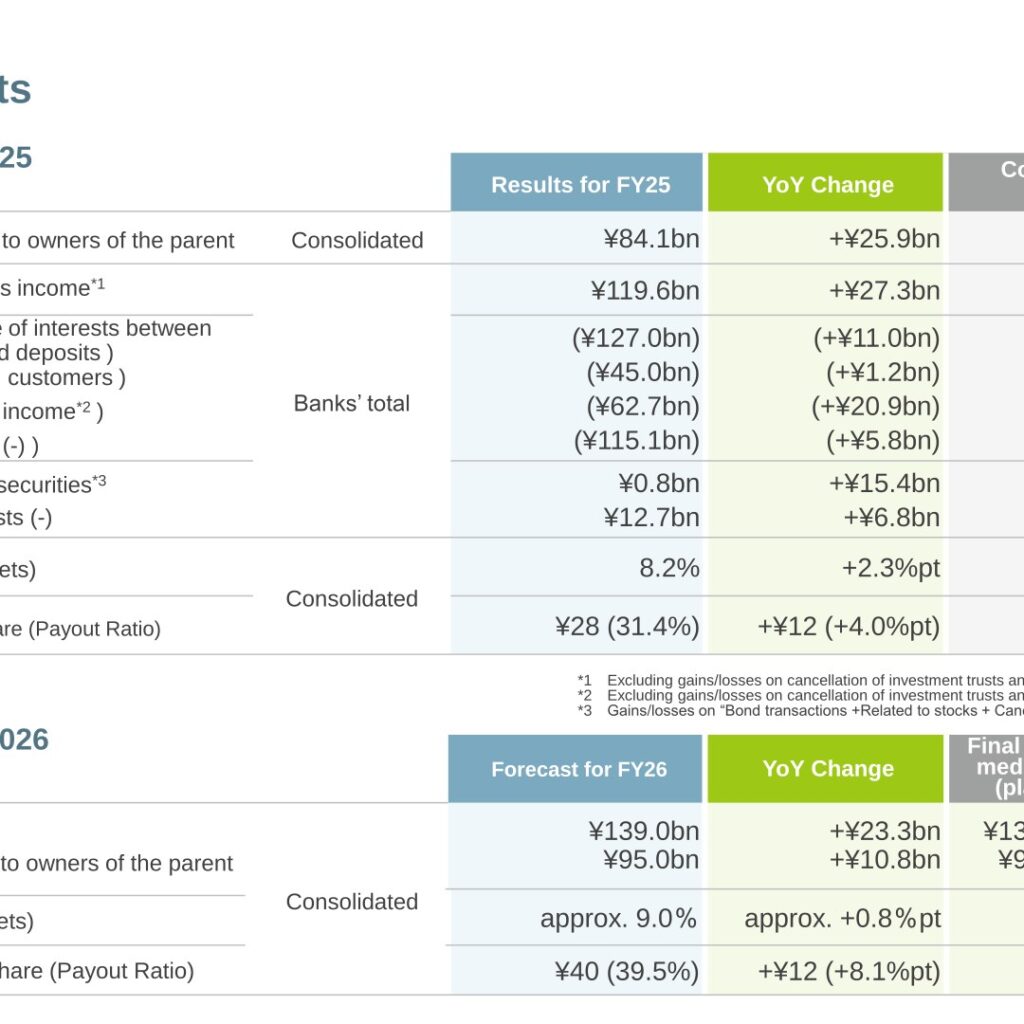
Mebuki Financial Group, the holding company for Joyo Bank and Ashikaga Bank, reported consolidated net income attributable to owners of the parent of ¥84.1bn for FY2025, up ¥25.9bn year on year and a record high for the full year. Core net business income at the two banks rose ¥27.3bn to ¥119.6bn, driven by the expansion of the difference of interests between loans and deposits and higher securities income. Consolidated ordinary profit was ¥115.6bn, an increase of ¥32.8bn, and ROE (based on net assets) improved 2.3%pt to 8.2%. The annual dividend was ¥28 per share, up ¥12, for a payout ratio of 31.4%.
Consolidated Results (Full-Year Actual)
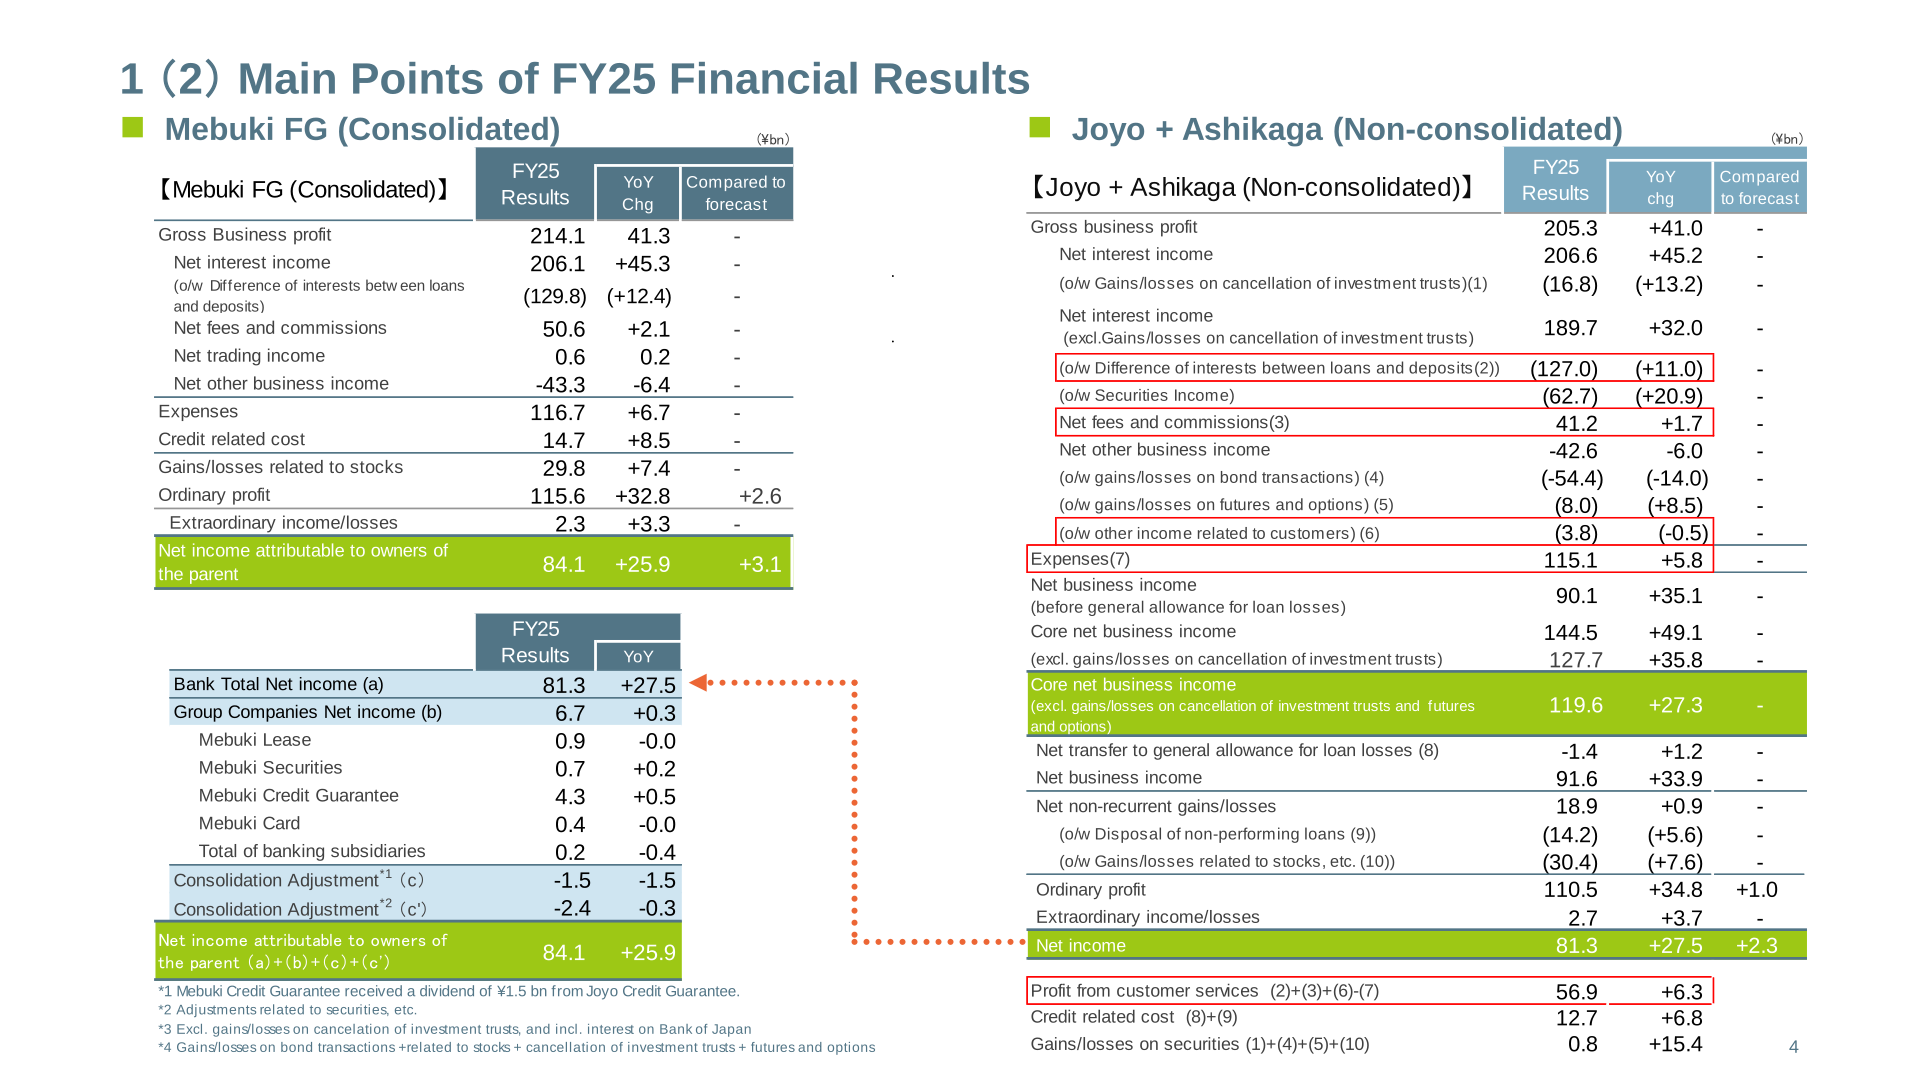
On a consolidated basis, gross business profit was ¥214.1bn and net interest income was ¥206.1bn, up ¥45.3bn, of which the difference of interests between loans and deposits was ¥129.8bn (+¥12.4bn). Net fees and commissions were ¥50.6bn (+¥2.1bn) and expenses were ¥116.7bn (+¥6.7bn). Credit related cost increased ¥8.5bn to ¥14.7bn, while gains/losses related to stocks were ¥29.8bn (+¥7.4bn). Ordinary profit of ¥115.6bn and net income attributable to owners of the parent of ¥84.1bn both exceeded the company’s forecast, by ¥2.6bn and ¥3.1bn respectively.
| Item (¥bn) | FY2025 | YoY Change | Compared to Forecast |
|---|---|---|---|
| Gross business profit | 214.1 | +41.3 | – |
| Net interest income | 206.1 | +45.3 | – |
| o/w Difference of interests between loans and deposits | 129.8 | +12.4 | – |
| Net fees and commissions | 50.6 | +2.1 | – |
| Net other business income | -43.3 | -6.4 | – |
| Expenses | 116.7 | +6.7 | – |
| Credit related cost | 14.7 | +8.5 | – |
| Gains/losses related to stocks | 29.8 | +7.4 | – |
| Ordinary profit | 115.6 | +32.8 | +2.6 |
| Extraordinary income/losses | 2.3 | +3.3 | – |
| Net income attributable to owners of the parent | 84.1 | +25.9 | +3.1 |
By entity, the two banks contributed net income of ¥81.3bn (+¥27.5bn) and group companies contributed ¥6.7bn (+¥0.3bn), comprising Mebuki Lease ¥0.9bn, Mebuki Securities ¥0.7bn, Mebuki Credit Guarantee ¥4.3bn, Mebuki Card ¥0.4bn and total of banking subsidiaries ¥0.2bn. Consolidation adjustments of -¥1.5bn (Mebuki Credit Guarantee received a dividend of ¥1.5bn from Joyo Credit Guarantee) and -¥2.4bn (adjustments related to securities, etc.) bring the total to ¥84.1bn.
Results by Banking Subsidiary
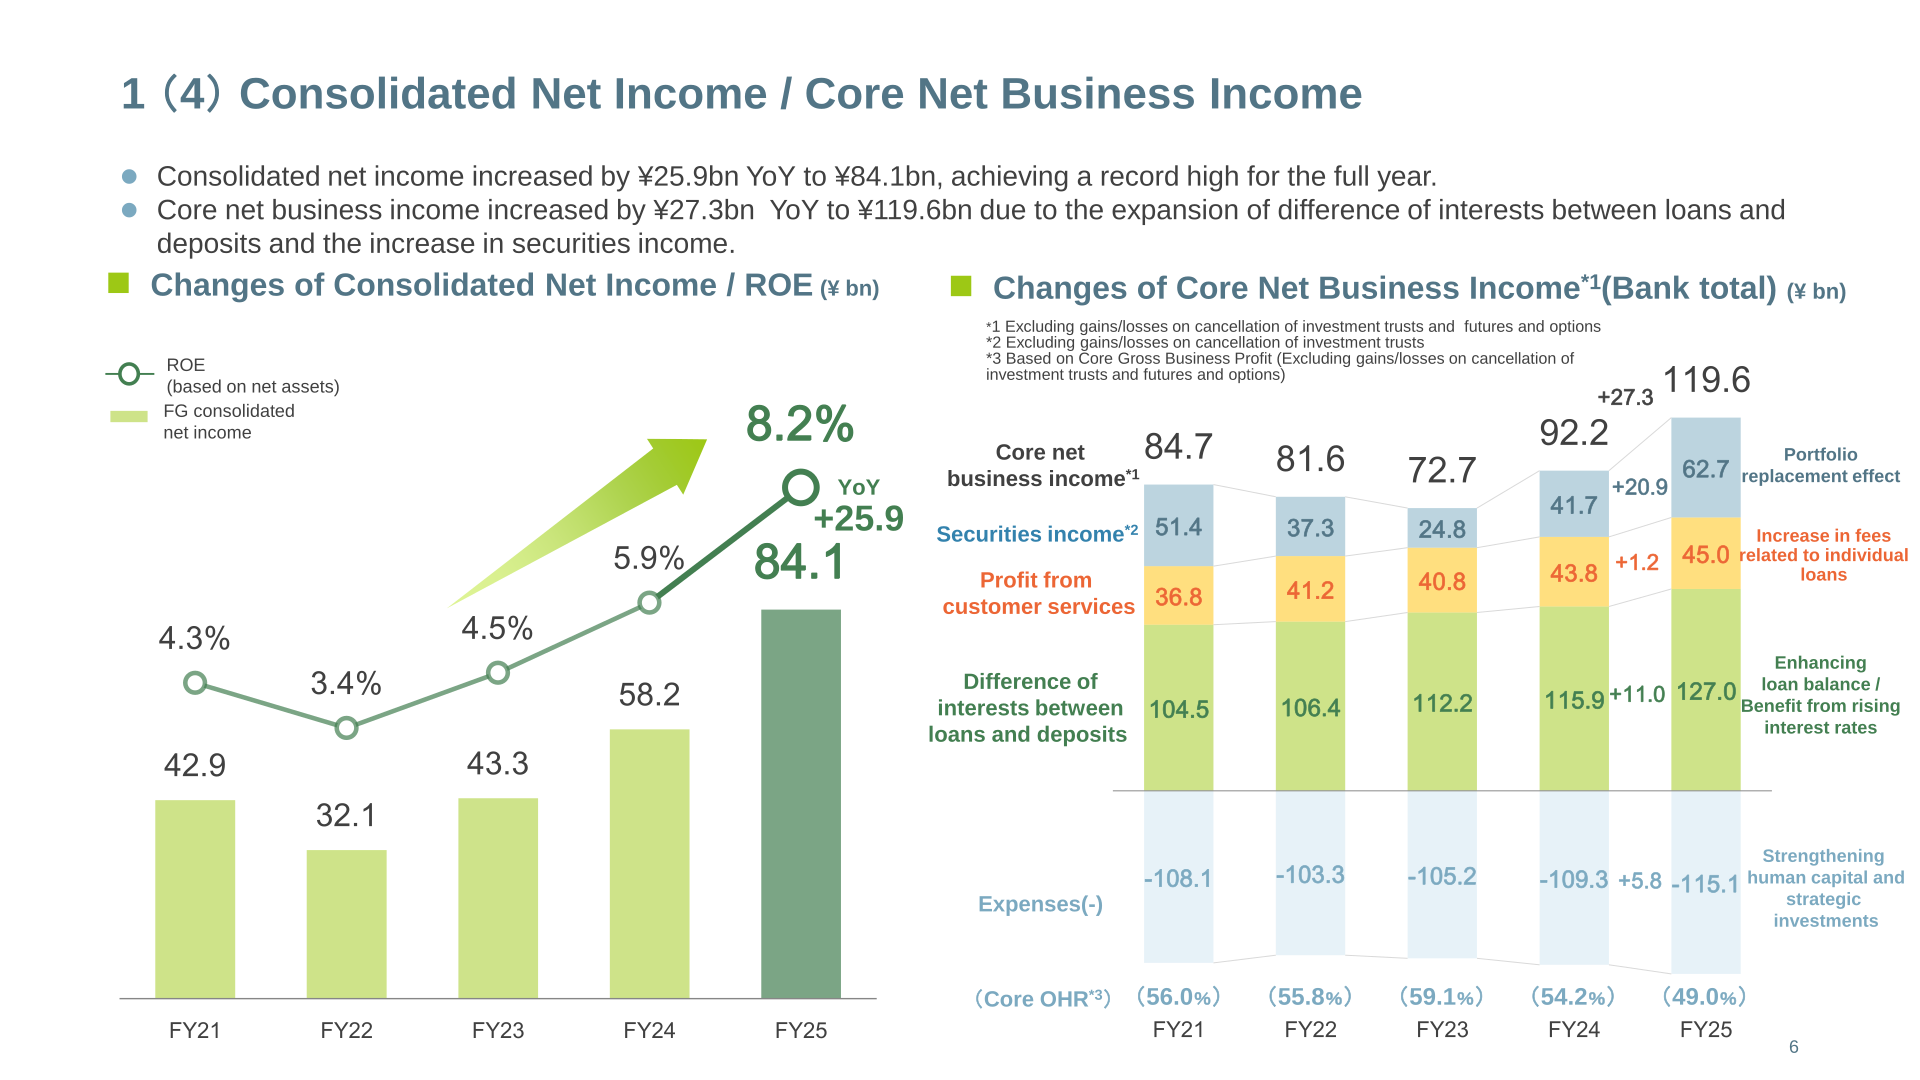
For the two banks combined (Joyo + Ashikaga, non-consolidated), core net business income excluding gains/losses on cancellation of investment trusts, futures and options was ¥119.6bn (+¥27.3bn). Within this, the difference of interests between loans and deposits was ¥127.0bn (+¥11.0bn), fees from customers ¥45.0bn (+¥1.2bn), securities income ¥62.7bn (+¥20.9bn) and expenses ¥115.1bn (+¥5.8bn). Gains/losses on securities were ¥0.8bn (+¥15.4bn) and credit related costs were ¥12.7bn (+¥6.8bn). Joyo Bank posted net income of ¥51.0bn and Ashikaga Bank ¥30.3bn.
| Item (¥bn) | Joyo + Ashikaga | Joyo Bank | Ashikaga Bank |
|---|---|---|---|
| Gross business profit | 205.3 | 111.6 | 93.6 |
| Net interest income | 206.6 | 113.2 | 93.4 |
| Net fees and commissions | 41.2 | 21.9 | 19.2 |
| Expenses | 115.1 | 64.3 | 50.8 |
| Core net business income (excl. gains/losses on cancellation of investment trusts, futures and options) | 119.6 | 71.4 | 48.2 |
| Credit related costs | 12.7 | 6.9 | 5.7 |
| Ordinary profit | 110.5 | 68.3 | 42.2 |
| Net income | 81.3 | 51.0 | 30.3 |
| Profit from customer services | 56.9 | 32.7 | 24.2 |
Loans, Deposits and Credit Costs
Term-end loans at the two banks (not including loans to the special account of MoF) rose ¥588.7bn, or 4.5%, to ¥13,608.1bn, with corporate loans up ¥414.8bn (+6.2%), individual loans up ¥133.3bn (+2.5%) and public-sector loans up ¥40.5bn (+3.7%). The average yield on loans rose to 1.24% from 1.03%, and the domestic loan yield rose 23.2bp to 1.20%. Deposits (including NCD) increased ¥176.7bn, or 0.9%, to ¥18,176.0bn. Expenses totalled ¥115.1bn, up ¥5.8bn, as personnel expenses rose ¥4.3bn to ¥63.0bn on salary increases, while OHR fell to 49.0% from 54.2%.
Credit related costs at the two banks were ¥12.7bn, above the full-year plan of ¥10.0bn, due to company-specific factors such as downgrades of major borrowers. Net transfer to the general allowance for loan losses was -¥1.4bn and disposal of non-performing loans was ¥14.2bn. The ratio of non-performing loans based on the financial revitalization law fell to 1.24% from 1.33% a year earlier, with total disclosed claims of ¥176.5bn. Delinquent loans to businesses stood at ¥1.1bn as of the end of March.
FY2026 Forecast
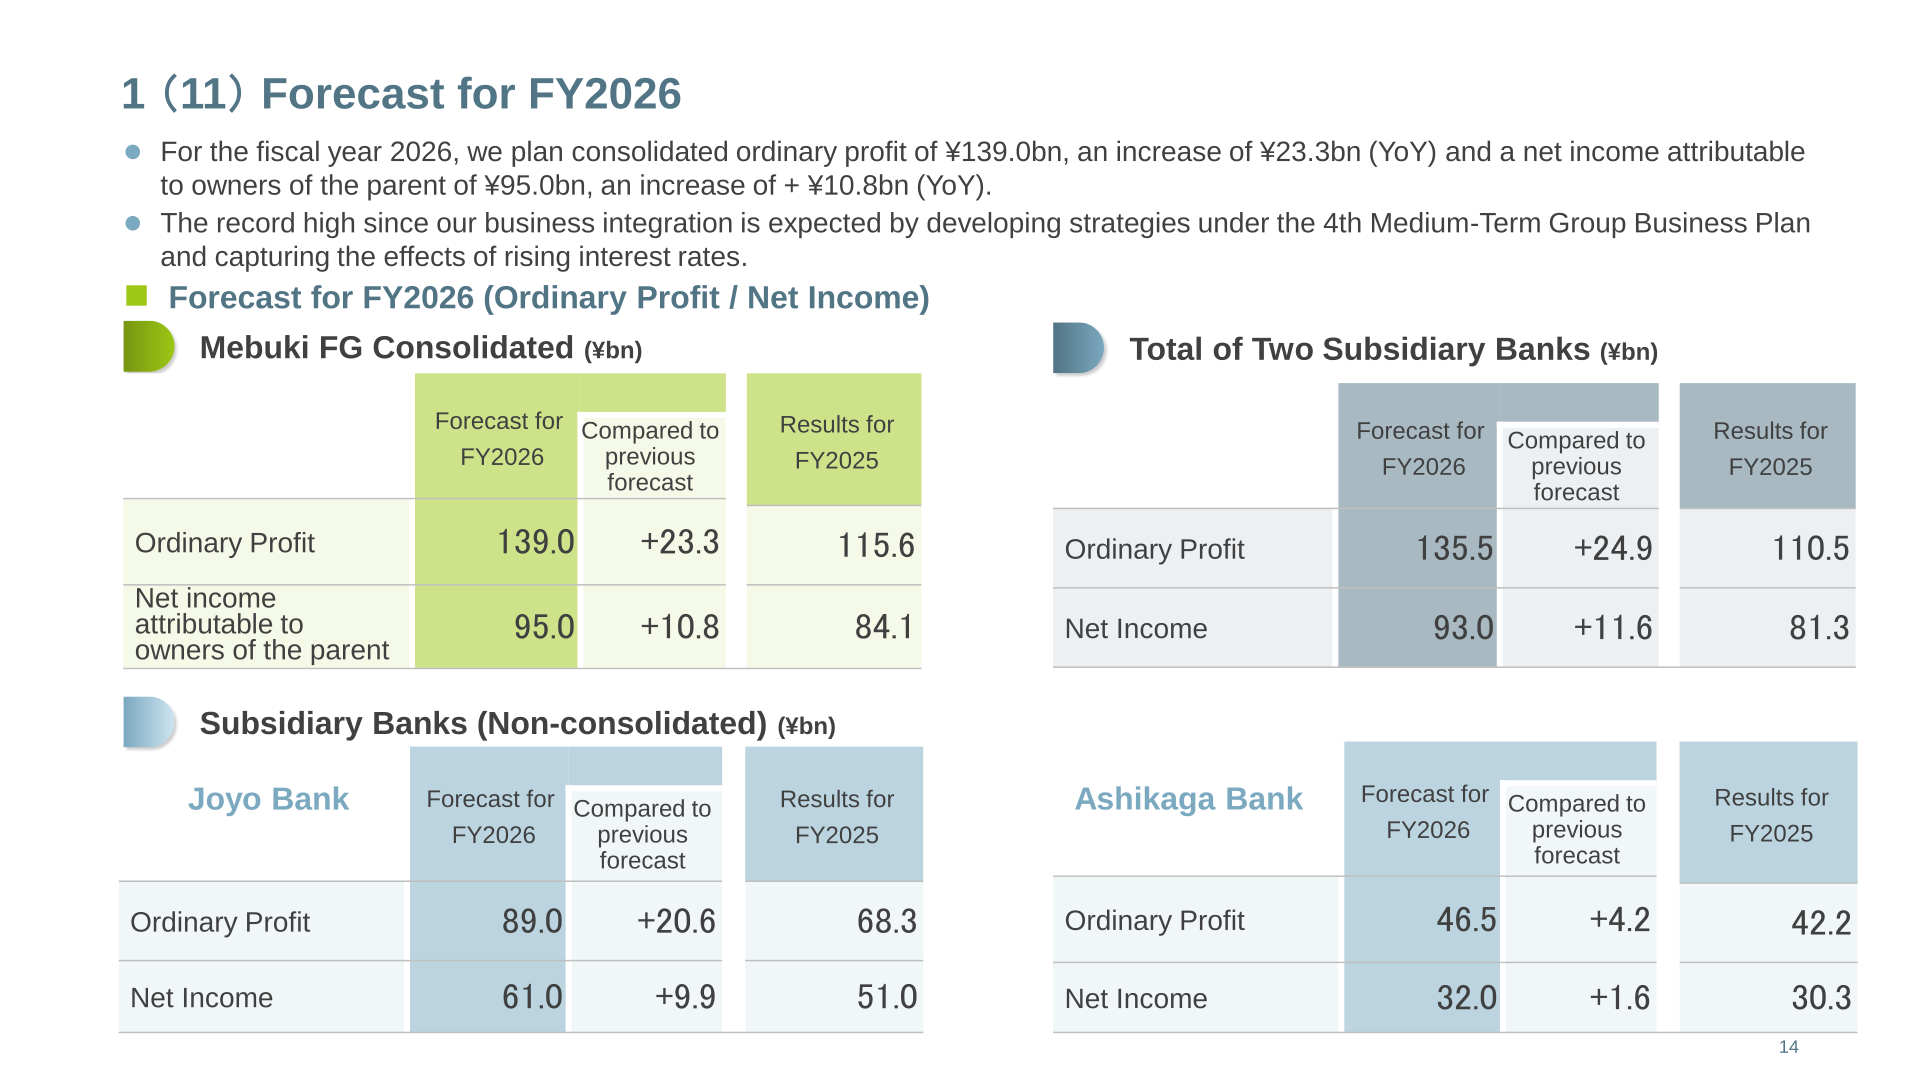
For FY2026 the company plans consolidated ordinary profit of ¥139.0bn, up ¥23.3bn, and net income attributable to owners of the parent of ¥95.0bn, up ¥10.8bn, which would be a record high since the business integration. ROE (based on net assets) is expected to be approximately 9.0%. At the two banks, the difference of interests between loans and deposits is forecast to rise ¥11.4bn to ¥138.5bn and securities income ¥1.7bn to ¥64.5bn, while expenses increase ¥8.3bn to ¥123.5bn on human capital investment and strategic DX investment. The plan assumes a Japanese policy rate of 0.75% at fiscal year end with no change during FY2026, and a U.S. policy rate of 3.50% after one rate cut.
| Item | FY2026 Forecast | YoY Change | FY2025 (Actual) |
|---|---|---|---|
| Ordinary profit — Mebuki FG consolidated (¥bn) | 139.0 | +23.3 | 115.6 |
| Net income attributable to owners of the parent (¥bn) | 95.0 | +10.8 | 84.1 |
| Ordinary profit — Joyo + Ashikaga (¥bn) | 135.5 | +24.9 | 110.5 |
| Net income — Joyo + Ashikaga (¥bn) | 93.0 | +11.6 | 81.3 |
| Ordinary profit — Joyo Bank (¥bn) | 89.0 | +20.6 | 68.3 |
| Ordinary profit — Ashikaga Bank (¥bn) | 46.5 | +4.2 | 42.2 |
| Core net business income — Joyo + Ashikaga (¥bn) | 125.5 | +5.8 | 119.6 |
| Difference of interests between loans and deposits (¥bn) | 138.5 | +11.4 | 127.0 |
| Expenses (¥bn) | 123.5 | +8.3 | 115.1 |
| Credit related cost (¥bn) | 10.0 | -2.7 | 12.7 |
| ROE (based on net assets) | approx. 9.0% | approx. +0.8%pt | 8.2% |
Shareholder Returns
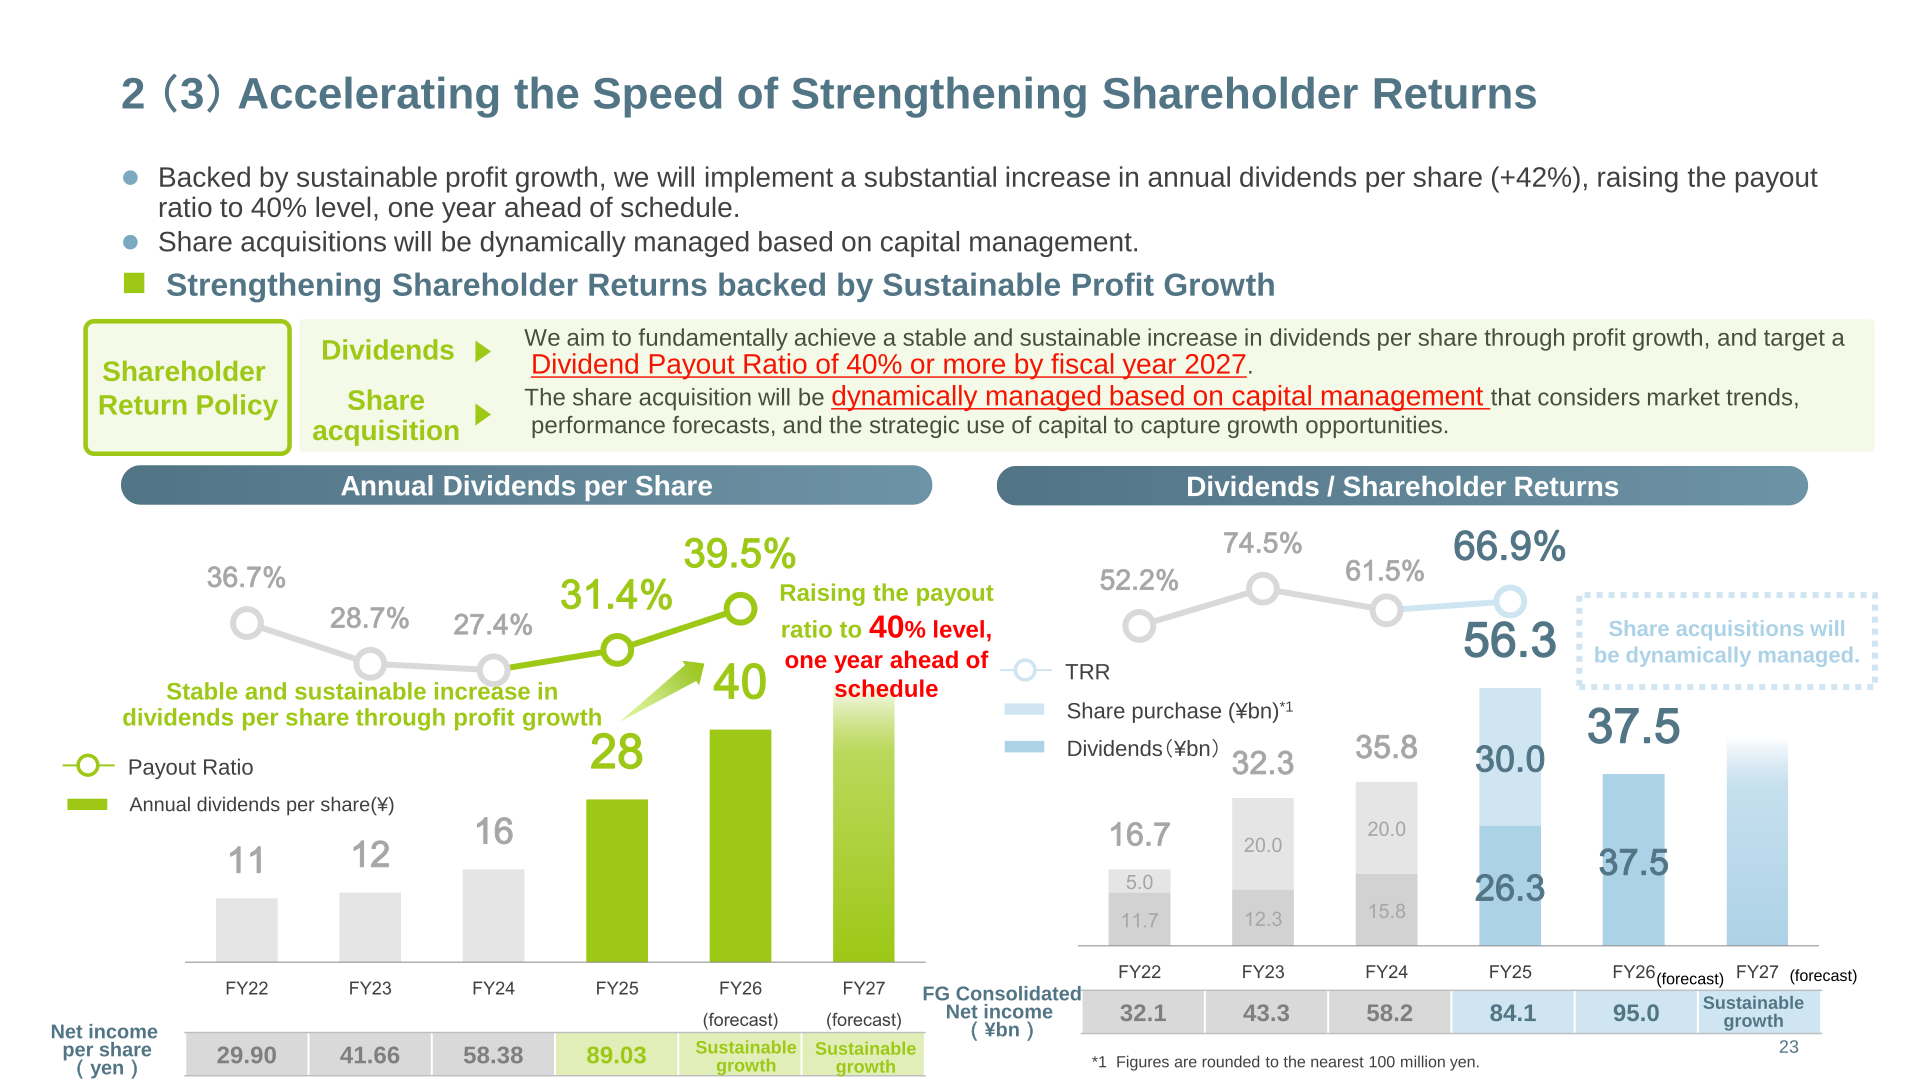
The annual dividend for FY2025 was ¥28 per share, an increase of ¥12, lifting the payout ratio 4.0%pt to 31.4%. For FY2026 the company plans an annual dividend of ¥40 per share, a further increase of ¥12 and a rise of 42% year on year, taking the payout ratio to 39.5% — raising it to the 40% level one year ahead of schedule. Under its shareholder return policy, Mebuki aims to fundamentally achieve a stable and sustainable increase in dividends per share through profit growth, and targets a dividend payout ratio of 40% or more by fiscal year 2027. Share acquisitions will be dynamically managed based on capital management that considers market trends, performance forecasts, and the strategic use of capital to capture growth opportunities.
| Item | FY2024 | FY2025 | FY2026 (Forecast) |
|---|---|---|---|
| Annual dividends per share (¥) | 16 | 28 | 40 |
| Payout ratio | 27.4% | 31.4% | 39.5% |
| Net income per share (¥) | 58.38 | 89.03 | – |
| FG consolidated net income (¥bn) | 58.2 | 84.1 | 95.0 |
Medium-Term Plan and Capital Management
Mebuki is in the first year of its Fourth Medium-Term Group Business Plan (plan period April 1, 2025 to March 31, 2028). The final-year (FY2027) targets are ordinary profit of ¥130.0bn or more, net income attributable to owners of the parent of ¥90.0bn or more and ROE of 9.0% or more; the company expects to reach the net income target one year ahead of plan based on a policy rate scenario of 0.75%. It has reset its cost of capital to 8-9% from the previous 6-8%, and states that ROE and the cost of capital are currently roughly in balance, with the aim of shifting to a value creation phase in which ROE consistently exceeds the cost of capital.
The capital adequacy ratio was 12.30% at the end of March 2026, with capital of ¥872.4bn against risk-weighted assets of ¥7,088.9bn. The company targets a capital adequacy ratio in the mid-11% range at the end of FY2027. On strategic shareholdings, the reduction reached ¥35.6bn on a market value basis against a five-year target of ¥30.0bn set in May 2023, with 49 issues reduced; however, the overall rise in the stock market meant the net market value increased by ¥21.5bn compared with the FYE22 benchmark. Key KPIs for FY2025 included the balance of assets under custody at ¥2.8936 trillion (+¥0.3820 trillion) against an FY2027 plan of ¥3.200 trillion, and cumulative sustainable finance executed of ¥2.2417 trillion against a plan of ¥3.2 trillion.
This article is an analysis based on publicly available information and is not a recommendation to buy or sell any specific securities. Investment decisions are your own responsibility.
![[Obayashi] Investors’ Guide 2026 — The Complete 24-Article Breakdown](https://japan-equity.com/wp-content/uploads/2026/07/hub_cover-1024x1024.png)
![[Obayashi] IR & SR Policy — Feeding Dialogue Back into Management](https://japan-equity.com/wp-content/uploads/2026/07/p32_sq-1024x1024.jpg)
![[Obayashi] Real Estate Development — 18.7% Margin, ¥287.7bn Unrealized Gains](https://japan-equity.com/wp-content/uploads/2026/07/p20_sq-1024x1024.jpg)
![[Obayashi] Domestic Civil Engineering — Resilience Spending Supports 9.6% Margin](https://japan-equity.com/wp-content/uploads/2026/07/p11_sq-1024x1024.jpg)
![[Obayashi] Share Price & External Ratings — vs TOPIX, ESG Index Inclusion](https://japan-equity.com/wp-content/uploads/2026/07/p40_sq-1024x1024.jpg)
![[Construction] ¥75.5tn Investment, Shrinking Workforce — Big-5 Market Share](https://japan-equity.com/wp-content/uploads/2026/07/p12_sq-1024x1024.jpg)



![[Obayashi] Capital Policy & Shareholder Returns — ROE 10%+, DOE ~5%, ¥100bn Buyback](https://japan-equity.com/wp-content/uploads/2026/07/p27_sq-1024x1024.jpg)
![[Obayashi] Reducing Cross-Shareholdings — ¥285.2bn Sold in Five Years](https://japan-equity.com/wp-content/uploads/2026/07/p29_sq-1024x1024.jpg)
![[Obayashi] ¥750bn Investment Plan — ¥300bn to Development, ¥190bn to Tech/DX](https://japan-equity.com/wp-content/uploads/2026/07/p30_sq-1024x1024.jpg)
![[Obayashi] MTP2022 KPIs — Operating Profit ~2x Target, ROE 14.4%](https://japan-equity.com/wp-content/uploads/2026/07/p25_sq-1024x1024.jpg)
![[Obayashi] Cash Allocation — ¥420bn Investment CF Over Five Years](https://japan-equity.com/wp-content/uploads/2026/07/p26_sq-1024x1024.jpg)
![[Obayashi] Green Energy — 44 Plants, 344MW, and the Green Hydrogen Challenge](https://japan-equity.com/wp-content/uploads/2026/07/p21_sq-1024x1024.jpg)
![[Obayashi] Tackling the Labor Shortage — Robotics Construction®](https://japan-equity.com/wp-content/uploads/2026/07/p14_sq-1024x1024.jpg)
