
This article is based on publicly available IR materials and is not a recommendation to buy or sell any specific securities.
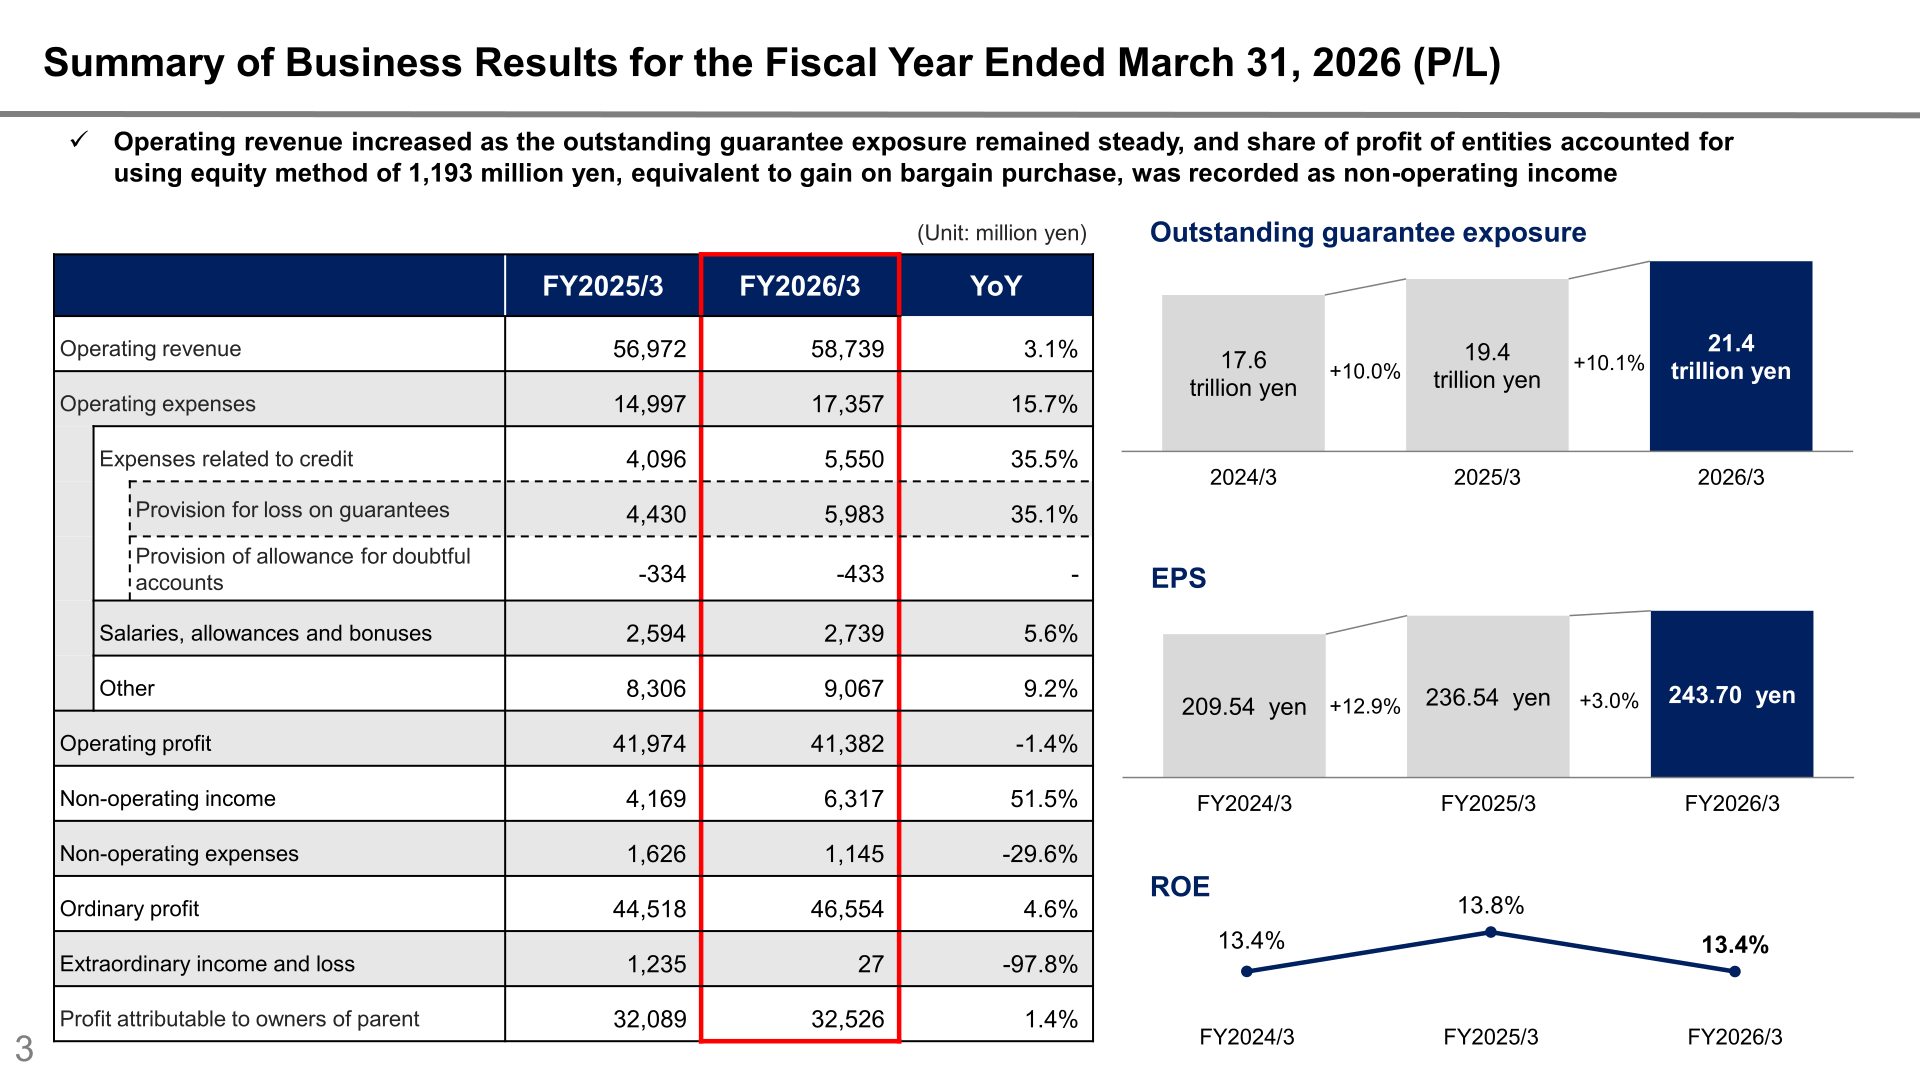
Note: ZENKOKU HOSHO labels the fiscal year ended March 31, 2026 as “FY2026/3” and the fiscal year ending March 31, 2027 as “FY2027/3”; the text and tables below keep the company’s own labels. In FY2026/3, operating revenue rose 3.1% year on year to 58,739 million yen and ordinary profit rose 4.6% to 46,554 million yen, while operating profit declined 1.4% to 41,382 million yen. Profit attributable to owners of parent came to 32,526 million yen, up 1.4%. Outstanding guarantee exposure expanded from 19.4 trillion yen a year earlier to 21.4 trillion yen.
Consolidated Results (Full-Year Actual)
The materials state that operating revenue increased as the outstanding guarantee exposure remained steady, and that share of profit of entities accounted for using equity method of 1,193 million yen, equivalent to gain on bargain purchase, was recorded as non-operating income. Operating expenses rose 15.7% to 17,357 million yen, with expenses related to credit up 35.5% to 5,550 million yen and provision for loss on guarantees up 35.1% to 5,983 million yen, which held operating profit to 41,382 million yen (-1.4%). Non-operating income increased 51.5% to 6,317 million yen and non-operating expenses fell 29.6% to 1,145 million yen, lifting ordinary profit to 46,554 million yen. EPS was 243.70 yen against 236.54 yen in FY2025/3, and ROE was 13.4% against 13.8%.
| Item (million yen) | FY2026/3 | FY2025/3 | YoY |
|---|---|---|---|
| Operating revenue | 58,739 | 56,972 | 3.1% |
| Operating expenses | 17,357 | 14,997 | 15.7% |
| Expenses related to credit | 5,550 | 4,096 | 35.5% |
| Provision for loss on guarantees | 5,983 | 4,430 | 35.1% |
| Provision of allowance for doubtful accounts | -433 | -334 | – |
| Salaries, allowances and bonuses | 2,739 | 2,594 | 5.6% |
| Other | 9,067 | 8,306 | 9.2% |
| Operating profit | 41,382 | 41,974 | -1.4% |
| Non-operating income | 6,317 | 4,169 | 51.5% |
| Non-operating expenses | 1,145 | 1,626 | -29.6% |
| Ordinary profit | 46,554 | 44,518 | 4.6% |
| Extraordinary income and loss | 27 | 1,235 | -97.8% |
| Profit attributable to owners of parent | 32,526 | 32,089 | 1.4% |
| EPS (yen) | 243.70 | 236.54 | – |
| ROE | 13.4% | 13.8% | – |
The company’s profit bridge shows profit attributable to owners of parent increased by 0.43 billion yen year on year, from 32.0 billion yen to 32.5 billion yen. Positive contributors were an increase in operating revenue of +1.7 billion yen, an increase in interest and dividend income of +0.9 billion yen, the share of profit of entities accounted for using equity method equivalent to gain on bargain purchase of +1.1 billion yen, and a decrease in commission expenses associated with subordinated loans of +0.6 billion yen. Offsetting these were an increase in expenses related to credit of -1.4 billion yen, other operating expenses of -0.9 billion yen, the absence of the gain on bargain purchase recognized in FY2025/3 of -1.2 billion yen, and income taxes and other of -0.3 billion yen. Within operating revenue, ZENKOKU HOSHO on a non-consolidated basis contributed 1.0 billion yen of the increase and the three guarantee companies converted into subsidiaries during FY2025/3 contributed 0.6 billion yen.
On the balance sheet, total assets stood at 500,831 million yen, up 1.7%. Cash and deposits fell 47.3% to 72,545 million yen while securities rose 362.6% to 44,094 million yen and investment securities rose 8.4% to 309,145 million yen; the materials attribute the increase in securities and investments and other assets to the purchase of bonds and other instruments. Total liabilities were 255,682 million yen (up 0.8%) and total net assets were 245,148 million yen (up 2.7%).
Guarantee Business: Organic and Inorganic Growth
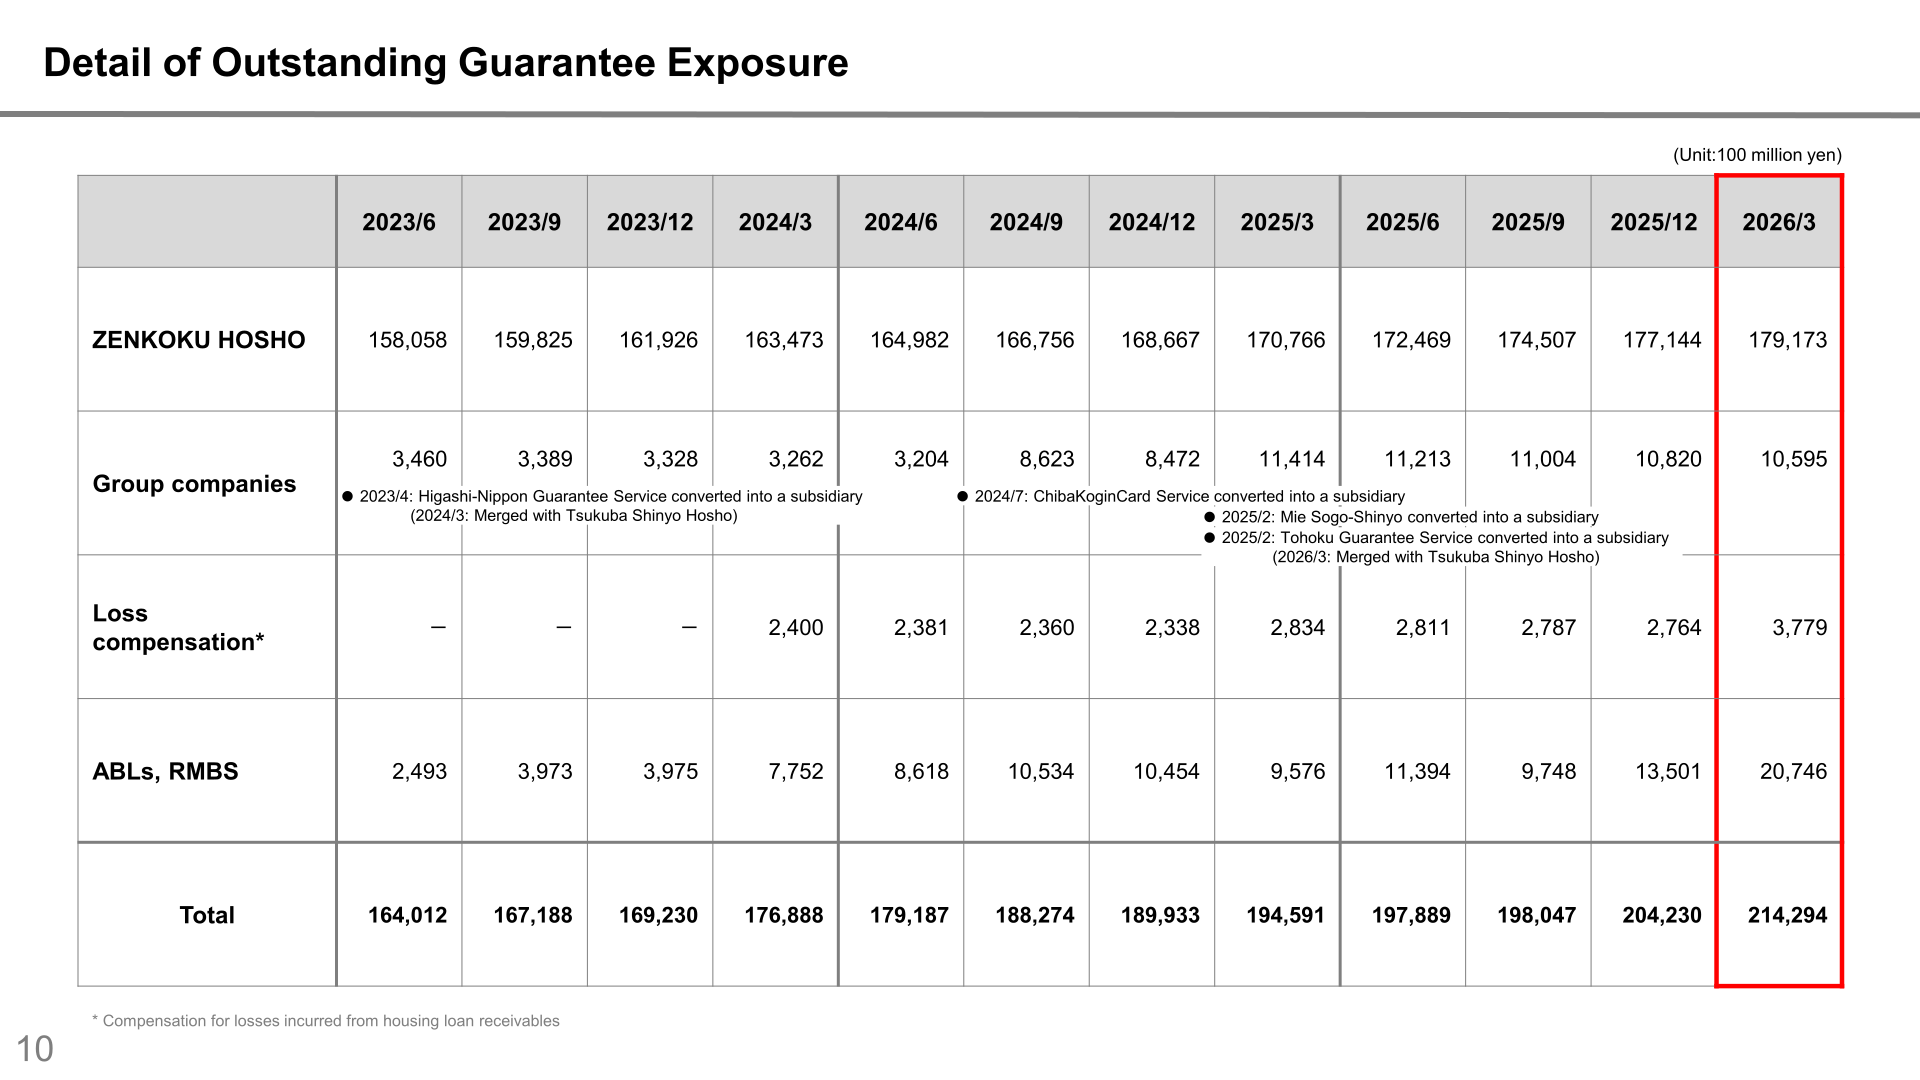
ZENKOKU HOSHO does not report business segments; the materials break the guarantee business down by growth channel and by entity. The amount of new guarantees granted (organic growth) rose 7.3% to 19,194 (100 million yen), with the number of new guarantees granted at 57,370 cases versus 56,751 cases a year earlier; the company notes that while the number of new housing starts remained sluggish, the amount of new guarantees granted increased due to the contribution from an increase in the guarantee fee. Acquisition of outstanding guarantee exposure from the existing housing loan market (inorganic growth) totaled 1,673.6 billion yen, up from 1,217.0 billion yen, comprising 4 cases of ABLs and RMBS totaling 1,579.1 billion yen and 1 case of loss compensation of 94.5 billion yen, with no M&A during the year. Outstanding guarantee exposure therefore rose from 19.4 trillion yen to 21.4 trillion yen, a net increase of 0.8 trillion yen from organic growth and 1.1 trillion yen from inorganic growth.
| Category (100 million yen) | 2026/3 | 2025/3 |
|---|---|---|
| ZENKOKU HOSHO | 179,173 | 170,766 |
| Group companies | 10,595 | 11,414 |
| Loss compensation | 3,779 | 2,834 |
| ABLs, RMBS | 20,746 | 9,576 |
| Total | 214,294 | 194,591 |
On credit quality, the amount repaid in subrogation was 16,537 million yen in FY2026/3 versus 14,496 million yen in FY2025/3, with the subrogation rate at 0.09% in both years; the company states the amount repaid in subrogation remained at roughly the same level as the previous year given continued favorable employment, and that rising mortgage rates have not been observed to affect the subrogation rate. The amount of collected right to reimbursement was 10,545 million yen versus 9,685 million yen, and the collateral disposal recovery rate was 71.2% against 72.8% a year earlier, which the materials describe as remaining at a high level given soaring real estate prices, particularly in urban areas, and an increase in the number of used housing transactions.
FY2027/3 Forecast
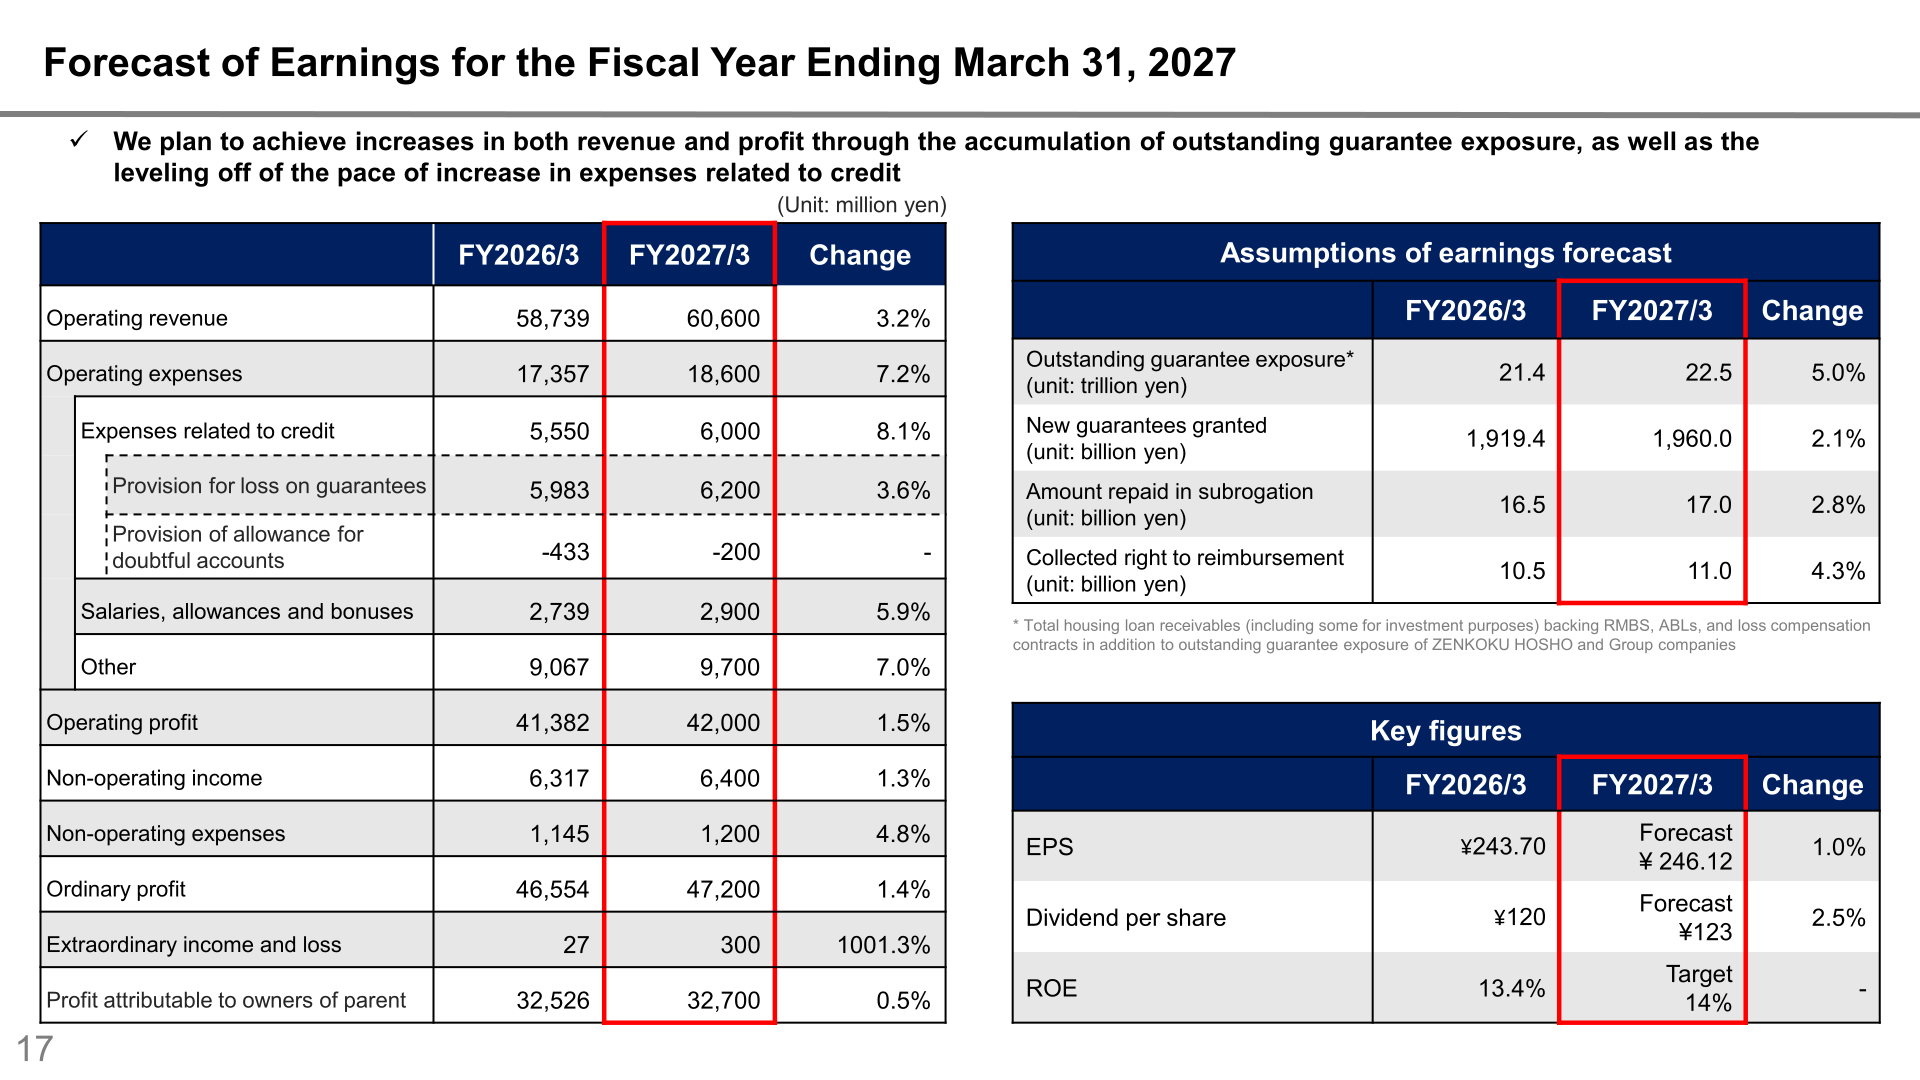
The company plans to achieve increases in both revenue and profit through the accumulation of outstanding guarantee exposure, as well as the leveling off of the pace of increase in expenses related to credit. Operating revenue is forecast at 60,600 million yen (up 3.2%), ordinary profit at 47,200 million yen (up 1.4%) and profit attributable to owners of parent at 32,700 million yen (up 0.5%). The assumptions behind the forecast are outstanding guarantee exposure of 22.5 trillion yen (up 5.0%), new guarantees granted of 1,960.0 billion yen (up 2.1%), amount repaid in subrogation of 17.0 billion yen (up 2.8%) and collected right to reimbursement of 11.0 billion yen (up 4.3%). The plan for outstanding guarantee exposure assumes net increases of 0.7 trillion yen from organic growth and 0.3 trillion yen from inorganic growth. The company also notes that, following the introduction of the Employee Stock Ownership Plan, a provision will be recorded for benefit payments covering a five-year period of approximately 0.9 billion yen.
| Item (million yen) | FY2027/3 Forecast | FY2026/3 (Actual) | Change |
|---|---|---|---|
| Operating revenue | 60,600 | 58,739 | 3.2% |
| Operating expenses | 18,600 | 17,357 | 7.2% |
| Expenses related to credit | 6,000 | 5,550 | 8.1% |
| Provision for loss on guarantees | 6,200 | 5,983 | 3.6% |
| Salaries, allowances and bonuses | 2,900 | 2,739 | 5.9% |
| Other | 9,700 | 9,067 | 7.0% |
| Operating profit | 42,000 | 41,382 | 1.5% |
| Non-operating income | 6,400 | 6,317 | 1.3% |
| Non-operating expenses | 1,200 | 1,145 | 4.8% |
| Ordinary profit | 47,200 | 46,554 | 1.4% |
| Extraordinary income and loss | 300 | 27 | 1001.3% |
| Profit attributable to owners of parent | 32,700 | 32,526 | 0.5% |
| EPS (yen) | 246.12 | 243.70 | 1.0% |
| Dividend per share (yen) | 123 | 120 | 2.5% |
| ROE | 14% (Target) | 13.4% | – |
Shareholder Returns
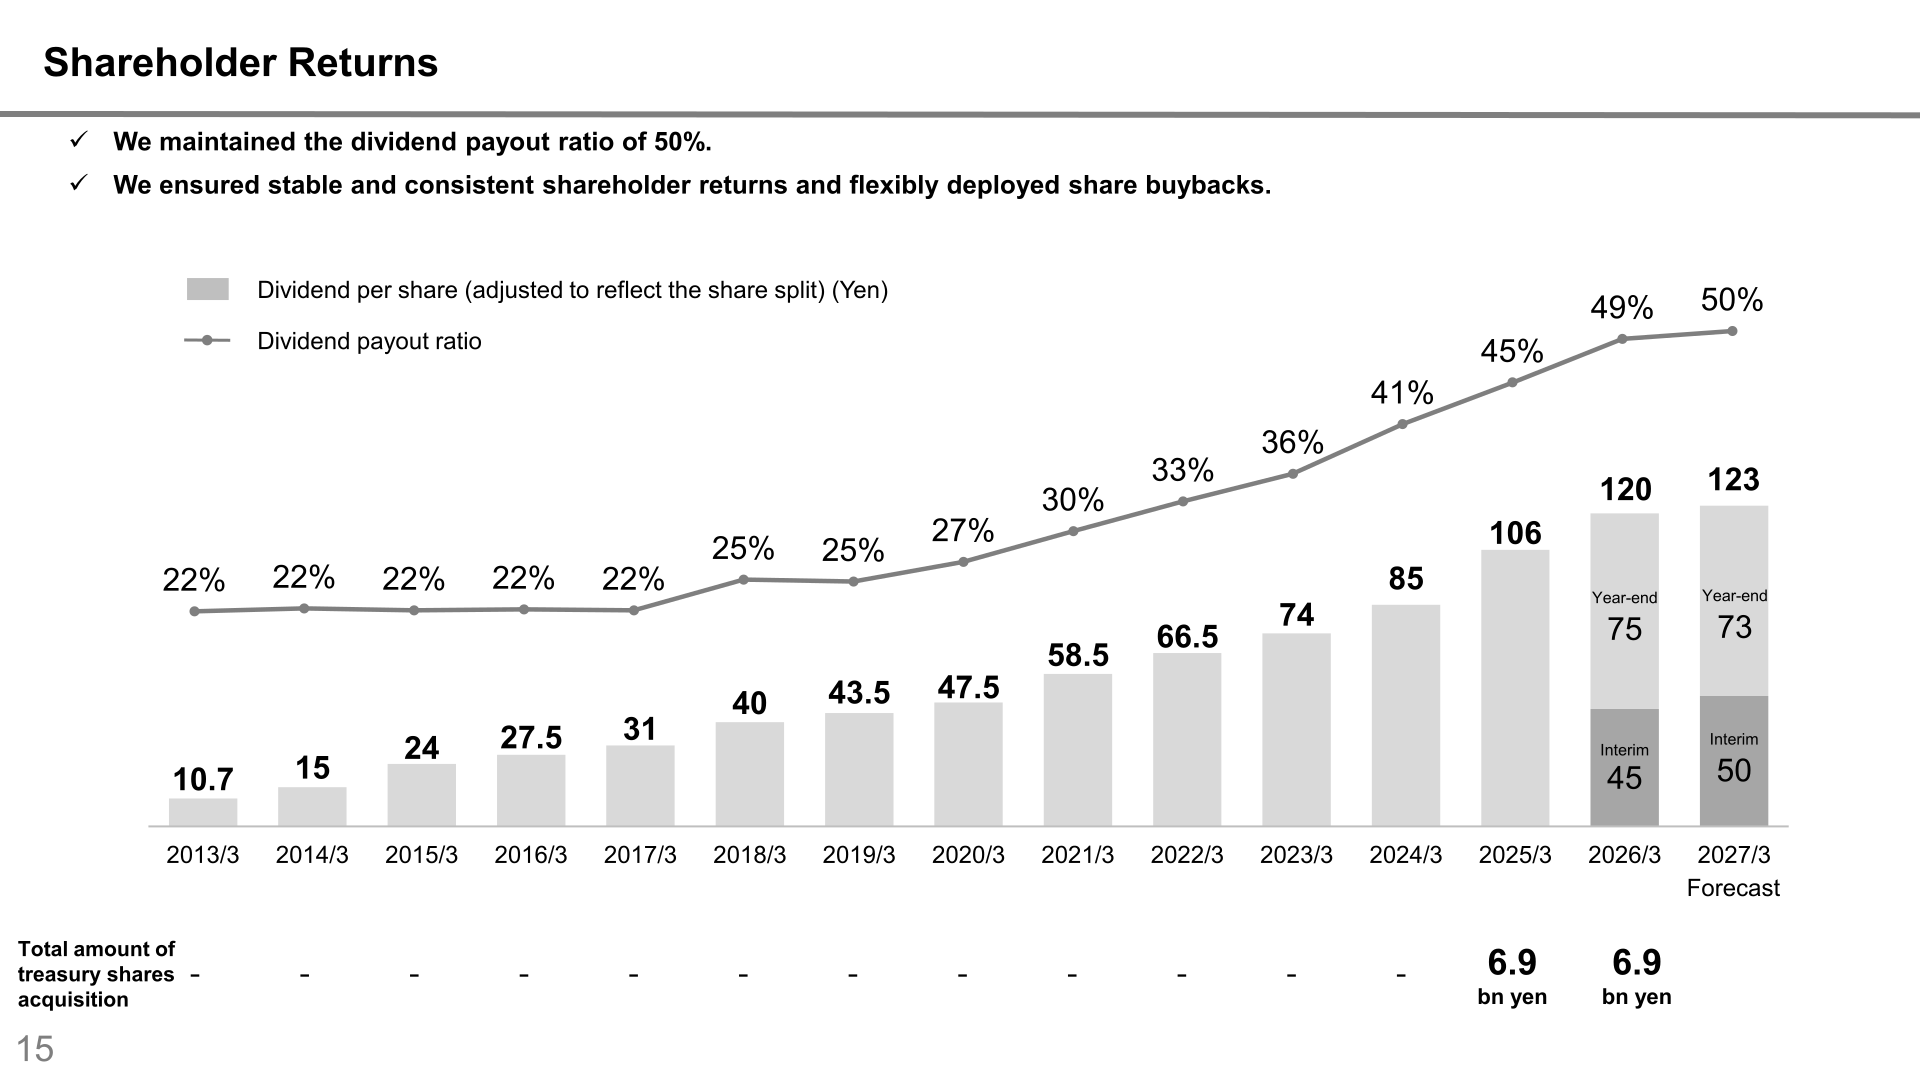
The materials state that the company maintained the dividend payout ratio of 50%, ensured stable and consistent shareholder returns and flexibly deployed share buybacks. For FY2026/3, dividends totaled 15.9 billion yen with a dividend per share of 120 yen and a dividend payout ratio of 49.2%, and share buybacks of 6.9 billion yen were completed between May 2025 and September 2025, bringing total shareholder returns to 22.9 billion yen. The dividend per share for FY2027/3 is forecast at 123 yen.
| Item | FY2026/3 | FY2027/3 Forecast |
|---|---|---|
| Dividend per share | 120 yen | 123 yen |
| Dividend payout ratio | 49.2% | – |
| Total dividends | 15.9 billion yen | – |
| Share buybacks | 6.9 billion yen | – |
| Total shareholder return | 22.9 billion yen | – |
Capital Utilization and Growth Investments
The company states that it secured the capital required as a guarantee company while utilizing capital to improve ROE. Required capital rose from 218.7 billion yen at 2025/3 to 233.1 billion yen at 2026/3, with usable capital of 28.3 billion yen against 14.7 billion yen a year earlier. The increase in required capital comprised 9.8 billion yen from organic growth and 4.6 billion yen from inorganic growth. As of March 31, 2026, required capital consisted of 208.9 billion yen for ZENKOKU HOSHO’s 17.9 trillion yen of exposure, 12.8 billion yen for Group companies’ 1.0 trillion yen, and 11.4 billion yen for ABLs, loss compensation and other with 2.4 trillion yen. Growth investments totaled 4.1 billion yen, made up of capital and business alliances with 2 companies for 2.3 billion yen (MFS, Inc. in November 2025 and INTELLEX HOLDINGS Co., Ltd. in February 2026, an equity-method affiliate since FY2026/3) and investments through the CVC in 9 companies for 1.8 billion yen. The CVC was established in 2023 with a total investment of 5.0 billion yen planned, with completion expected within FY2029/3.
The company describes itself as the only and largest independent housing loan guarantee company in Japan. As of March 31, 2026 its outstanding guarantee exposure was 21,429.4 billion yen; it had 12 locations and 378 consolidated employees (319 non-consolidated), with capital of 10,703 million yen. The materials put the annual new housing loan market at approximately 21 trillion yen, of which the company’s share is 9%, and outstanding private-sector housing loans at over 210 trillion yen, of which its share is 10%.
This article is an analysis based on publicly available information and is not a recommendation to buy or sell any specific securities. Investment decisions are your own responsibility.
![[Obayashi] Investors’ Guide 2026 — The Complete 24-Article Breakdown](https://japan-equity.com/wp-content/uploads/2026/07/hub_cover-1024x1024.png)
![[Obayashi] IR & SR Policy — Feeding Dialogue Back into Management](https://japan-equity.com/wp-content/uploads/2026/07/p32_sq-1024x1024.jpg)
![[Obayashi] Real Estate Development — 18.7% Margin, ¥287.7bn Unrealized Gains](https://japan-equity.com/wp-content/uploads/2026/07/p20_sq-1024x1024.jpg)
![[Obayashi] Domestic Civil Engineering — Resilience Spending Supports 9.6% Margin](https://japan-equity.com/wp-content/uploads/2026/07/p11_sq-1024x1024.jpg)
![[Obayashi] Share Price & External Ratings — vs TOPIX, ESG Index Inclusion](https://japan-equity.com/wp-content/uploads/2026/07/p40_sq-1024x1024.jpg)
![[Construction] ¥75.5tn Investment, Shrinking Workforce — Big-5 Market Share](https://japan-equity.com/wp-content/uploads/2026/07/p12_sq-1024x1024.jpg)



![[Obayashi] Capital Policy & Shareholder Returns — ROE 10%+, DOE ~5%, ¥100bn Buyback](https://japan-equity.com/wp-content/uploads/2026/07/p27_sq-1024x1024.jpg)
![[Obayashi] Reducing Cross-Shareholdings — ¥285.2bn Sold in Five Years](https://japan-equity.com/wp-content/uploads/2026/07/p29_sq-1024x1024.jpg)
![[Obayashi] ¥750bn Investment Plan — ¥300bn to Development, ¥190bn to Tech/DX](https://japan-equity.com/wp-content/uploads/2026/07/p30_sq-1024x1024.jpg)
![[Obayashi] MTP2022 KPIs — Operating Profit ~2x Target, ROE 14.4%](https://japan-equity.com/wp-content/uploads/2026/07/p25_sq-1024x1024.jpg)
![[Obayashi] Cash Allocation — ¥420bn Investment CF Over Five Years](https://japan-equity.com/wp-content/uploads/2026/07/p26_sq-1024x1024.jpg)
![[Obayashi] Green Energy — 44 Plants, 344MW, and the Green Hydrogen Challenge](https://japan-equity.com/wp-content/uploads/2026/07/p21_sq-1024x1024.jpg)
![[Obayashi] Tackling the Labor Shortage — Robotics Construction®](https://japan-equity.com/wp-content/uploads/2026/07/p14_sq-1024x1024.jpg)
