
This article is based on publicly available IR materials and is not a recommendation to buy or sell any specific securities.
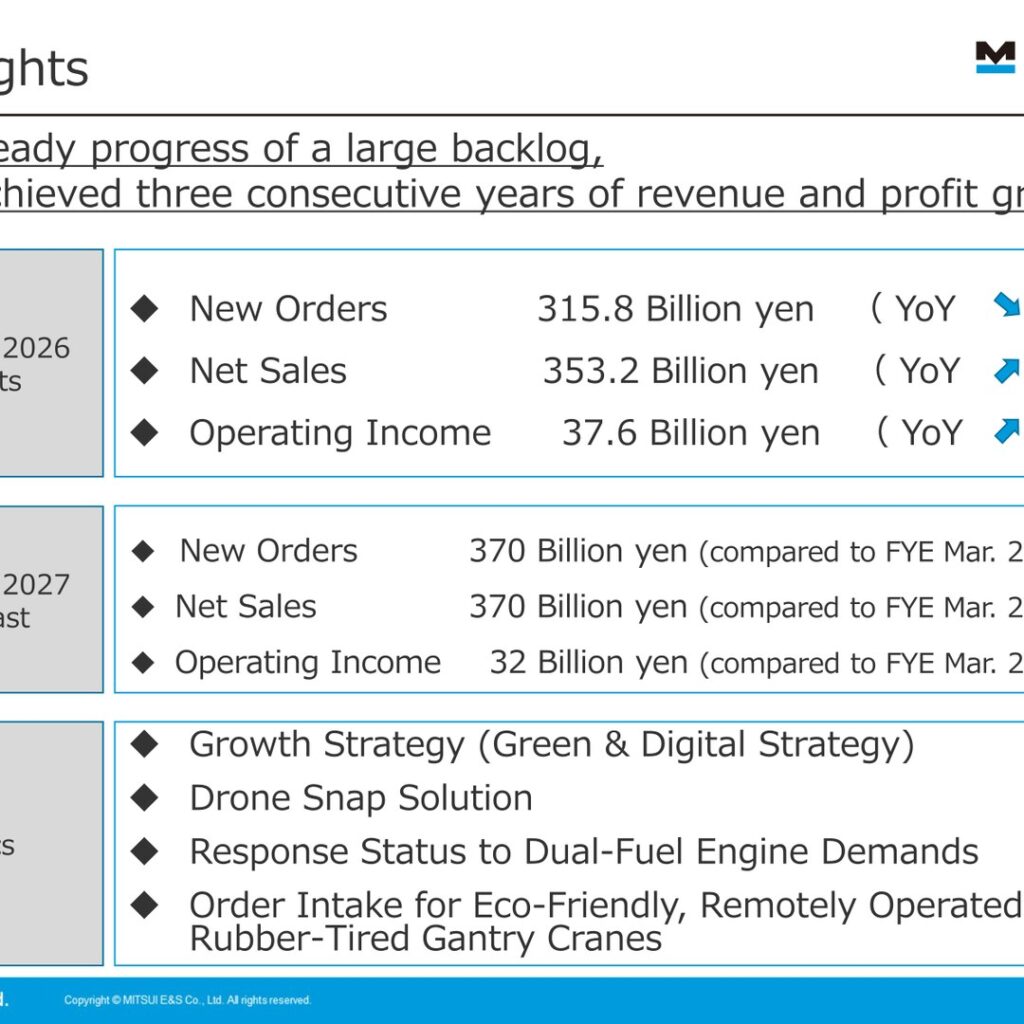
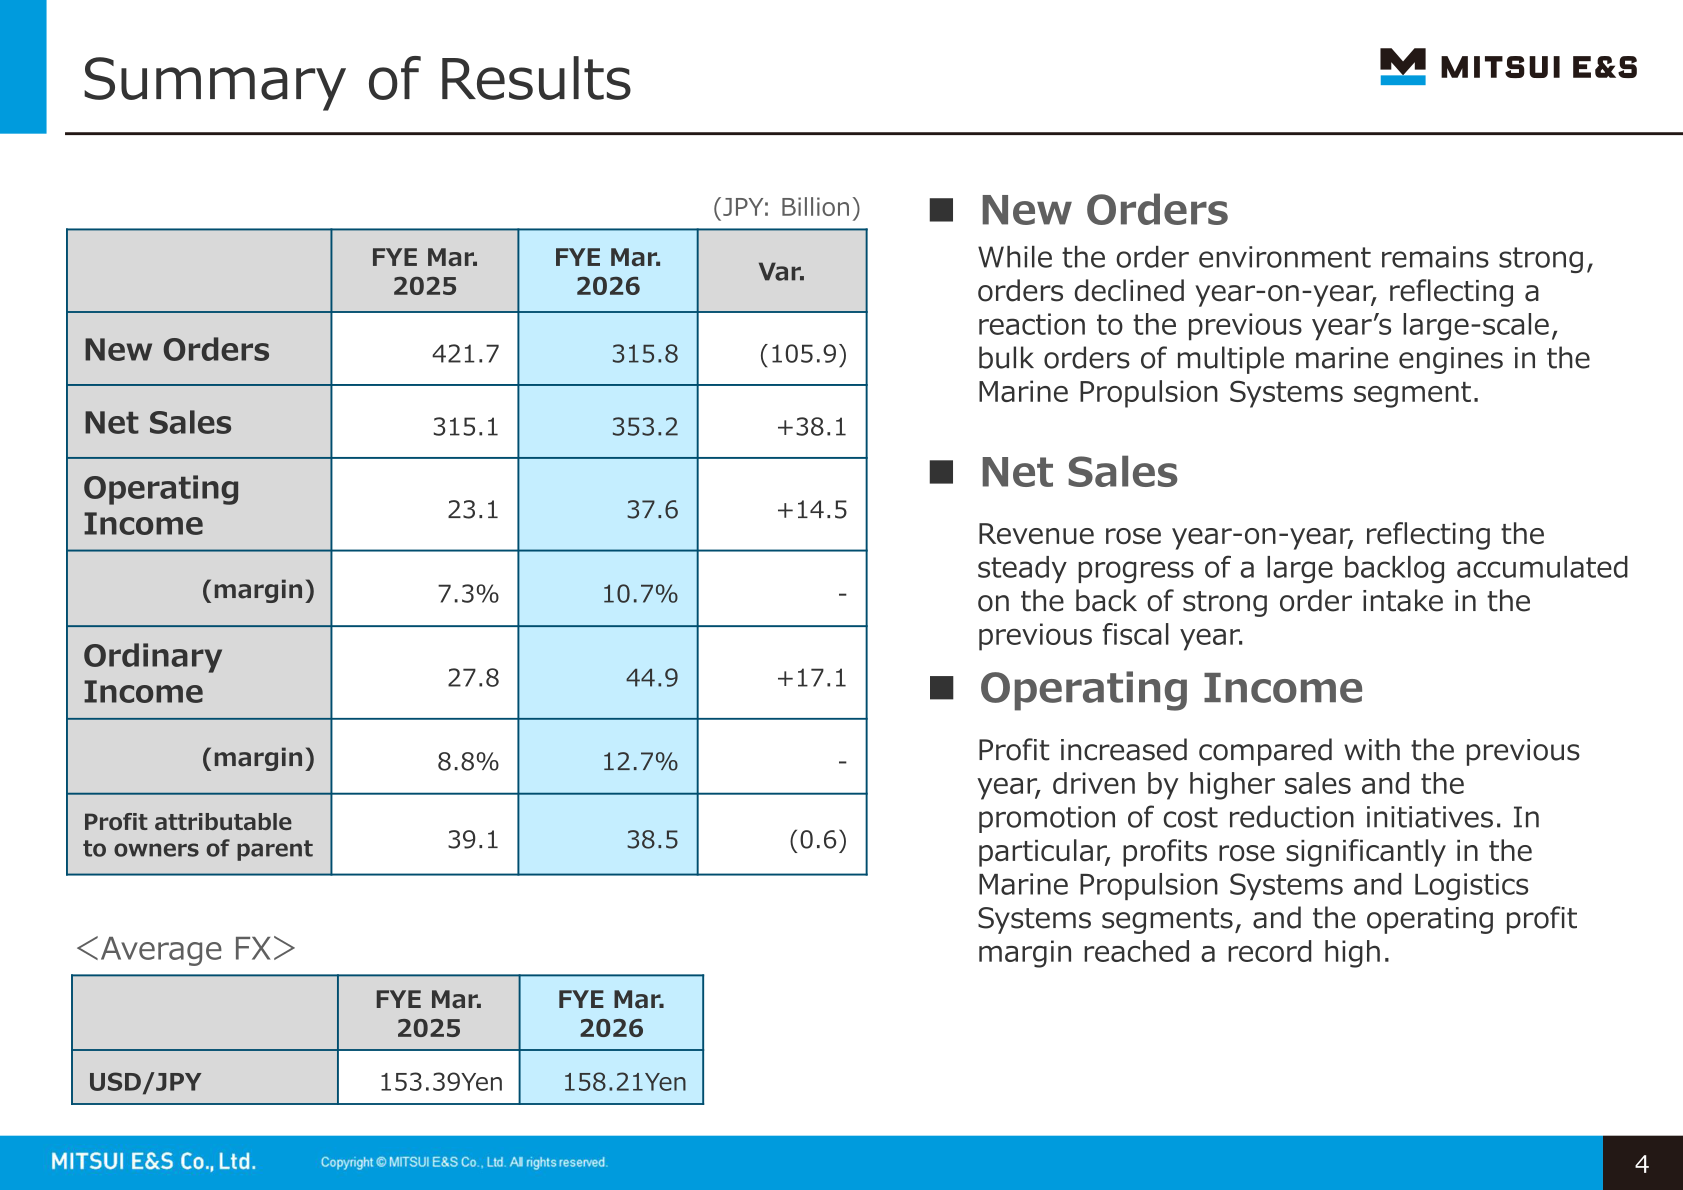
Note: MITSUI E&S labels this fiscal year “FYE Mar. 2026” (the fiscal year ended March 31, 2026); our site classifies the most recently completed full year as FY2025, and the labels used in the body text, tables and segment data below follow the company’s materials. For the fiscal year ended March 31, 2026, MITSUI E&S reported net sales of 353.2 billion yen, up 38.1 billion yen year on year, and operating income of 37.6 billion yen, up 14.5 billion yen. The company states that the steady progress of a large backlog delivered three consecutive years of revenue and profit growth, and that the operating profit margin reached a record high at 10.7%. New orders were 315.8 billion yen, down 105.9 billion yen, reflecting a reaction to the previous year’s large-scale, bulk orders of multiple marine engines in the Marine Propulsion Systems segment.
Consolidated Results (Full-Year Actual)
Ordinary income rose 17.1 billion yen to 44.9 billion yen, with the ordinary income margin at 12.7% versus 8.8% a year earlier. Profit attributable to owners of parent was 38.5 billion yen, down 0.6 billion yen. The company attributes the profit increase to higher sales and the promotion of cost reduction initiatives, noting that profits rose significantly in the Marine Propulsion Systems and Logistics Systems segments. The average USD/JPY rate was 158.21 yen, versus 153.39 yen in the prior year.
| Item (JPY: Billion) | FYE Mar. 2026 | FYE Mar. 2025 | Var. |
|---|---|---|---|
| New Orders | 315.8 | 421.7 | (105.9) |
| Net Sales | 353.2 | 315.1 | +38.1 |
| Operating Income | 37.6 | 23.1 | +14.5 |
| (margin) | 10.7% | 7.3% | – |
| Ordinary Income | 44.9 | 27.8 | +17.1 |
| (margin) | 12.7% | 8.8% | – |
| Profit attributable to owners of parent | 38.5 | 39.1 | (0.6) |
| USD/JPY (average FX) | 158.21Yen | 153.39Yen | – |
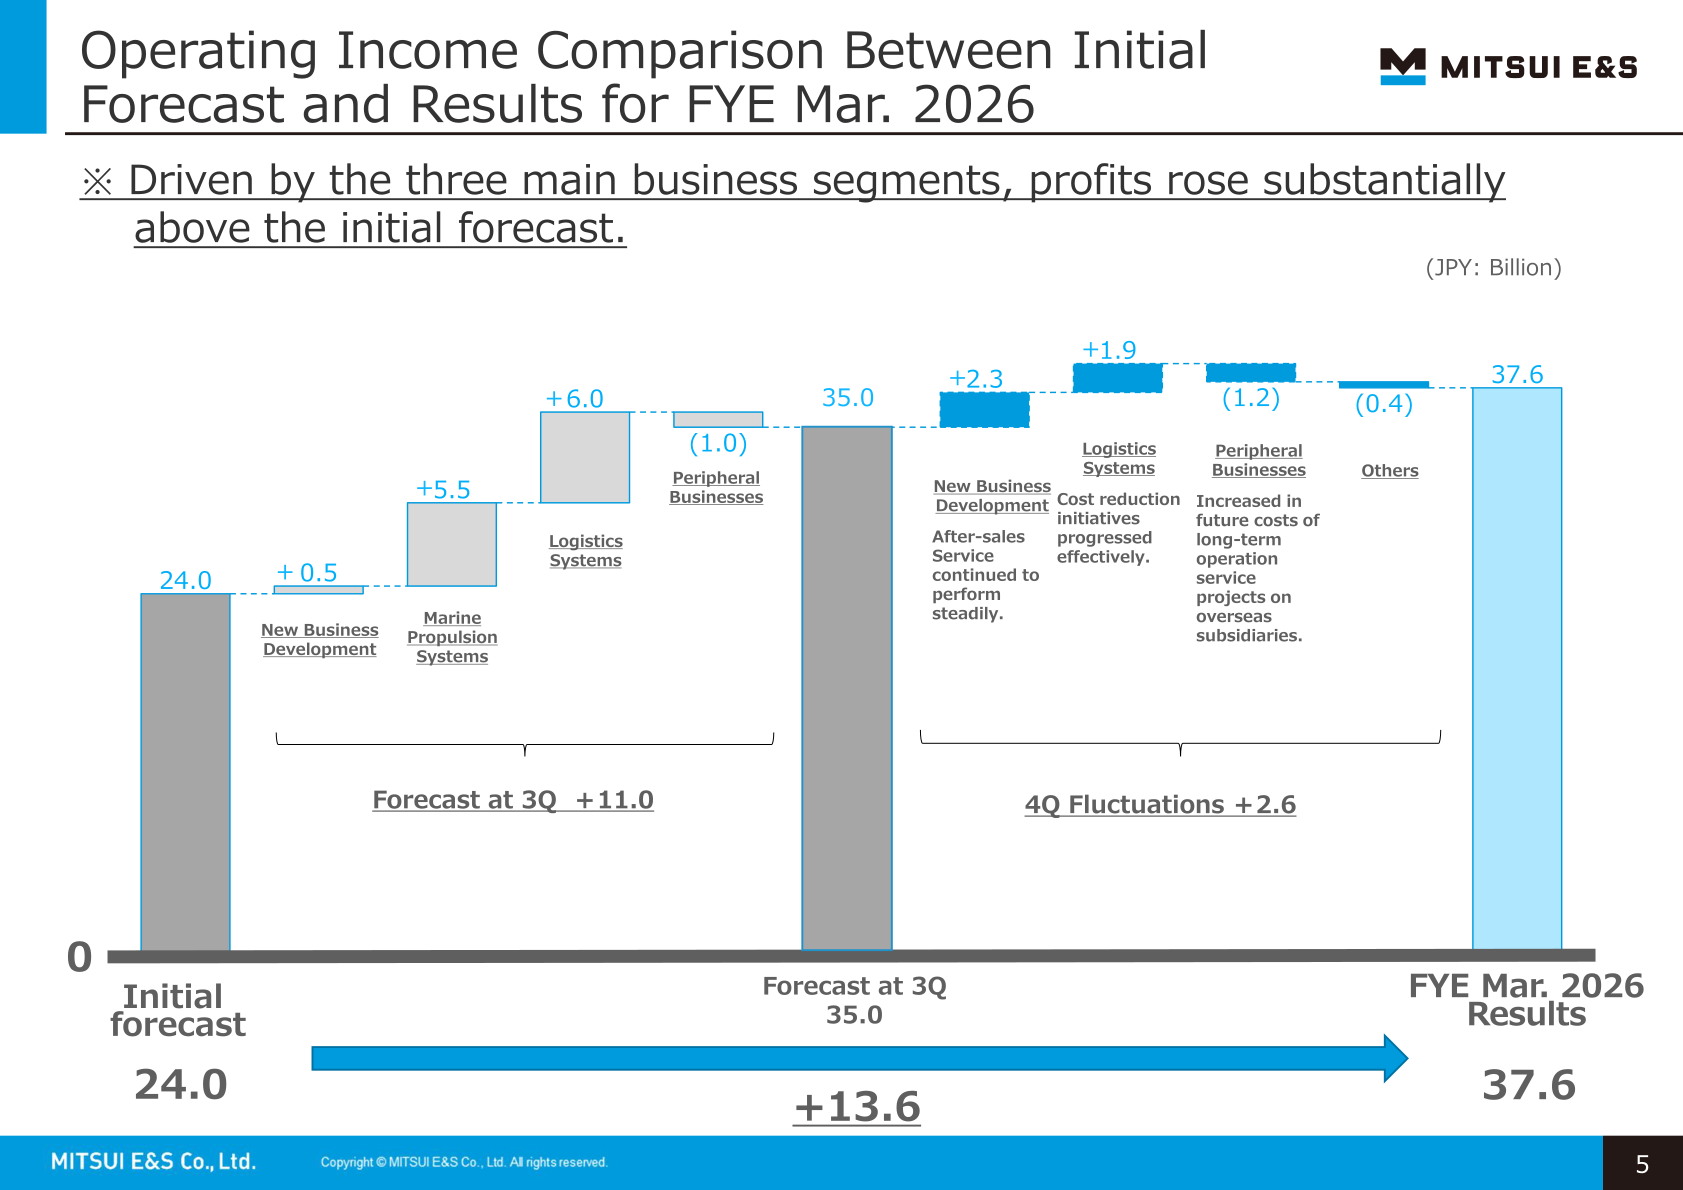
Operating Income Versus the Initial Forecast
Operating income of 37.6 billion yen came in 13.6 billion yen above the initial forecast of 24.0 billion yen. The materials break the gap into a 11.0 billion yen increase in the forecast as of the third quarter, taking the figure to 35.0 billion yen, and a further 2.6 billion yen of fourth-quarter fluctuations. Within the third-quarter revision, the company shows New Business Development at +0.5, Marine Propulsion Systems at +5.5, Logistics Systems at +6.0 and Peripheral Businesses at (1.0). Within the fourth-quarter fluctuations, New Business Development contributed +2.3 as after-sales service continued to perform steadily, Logistics Systems +1.9 as cost reduction initiatives progressed effectively, Peripheral Businesses (1.2) on increased future costs of long-term operation service projects at overseas subsidiaries, and Others (0.4).
Segment Results
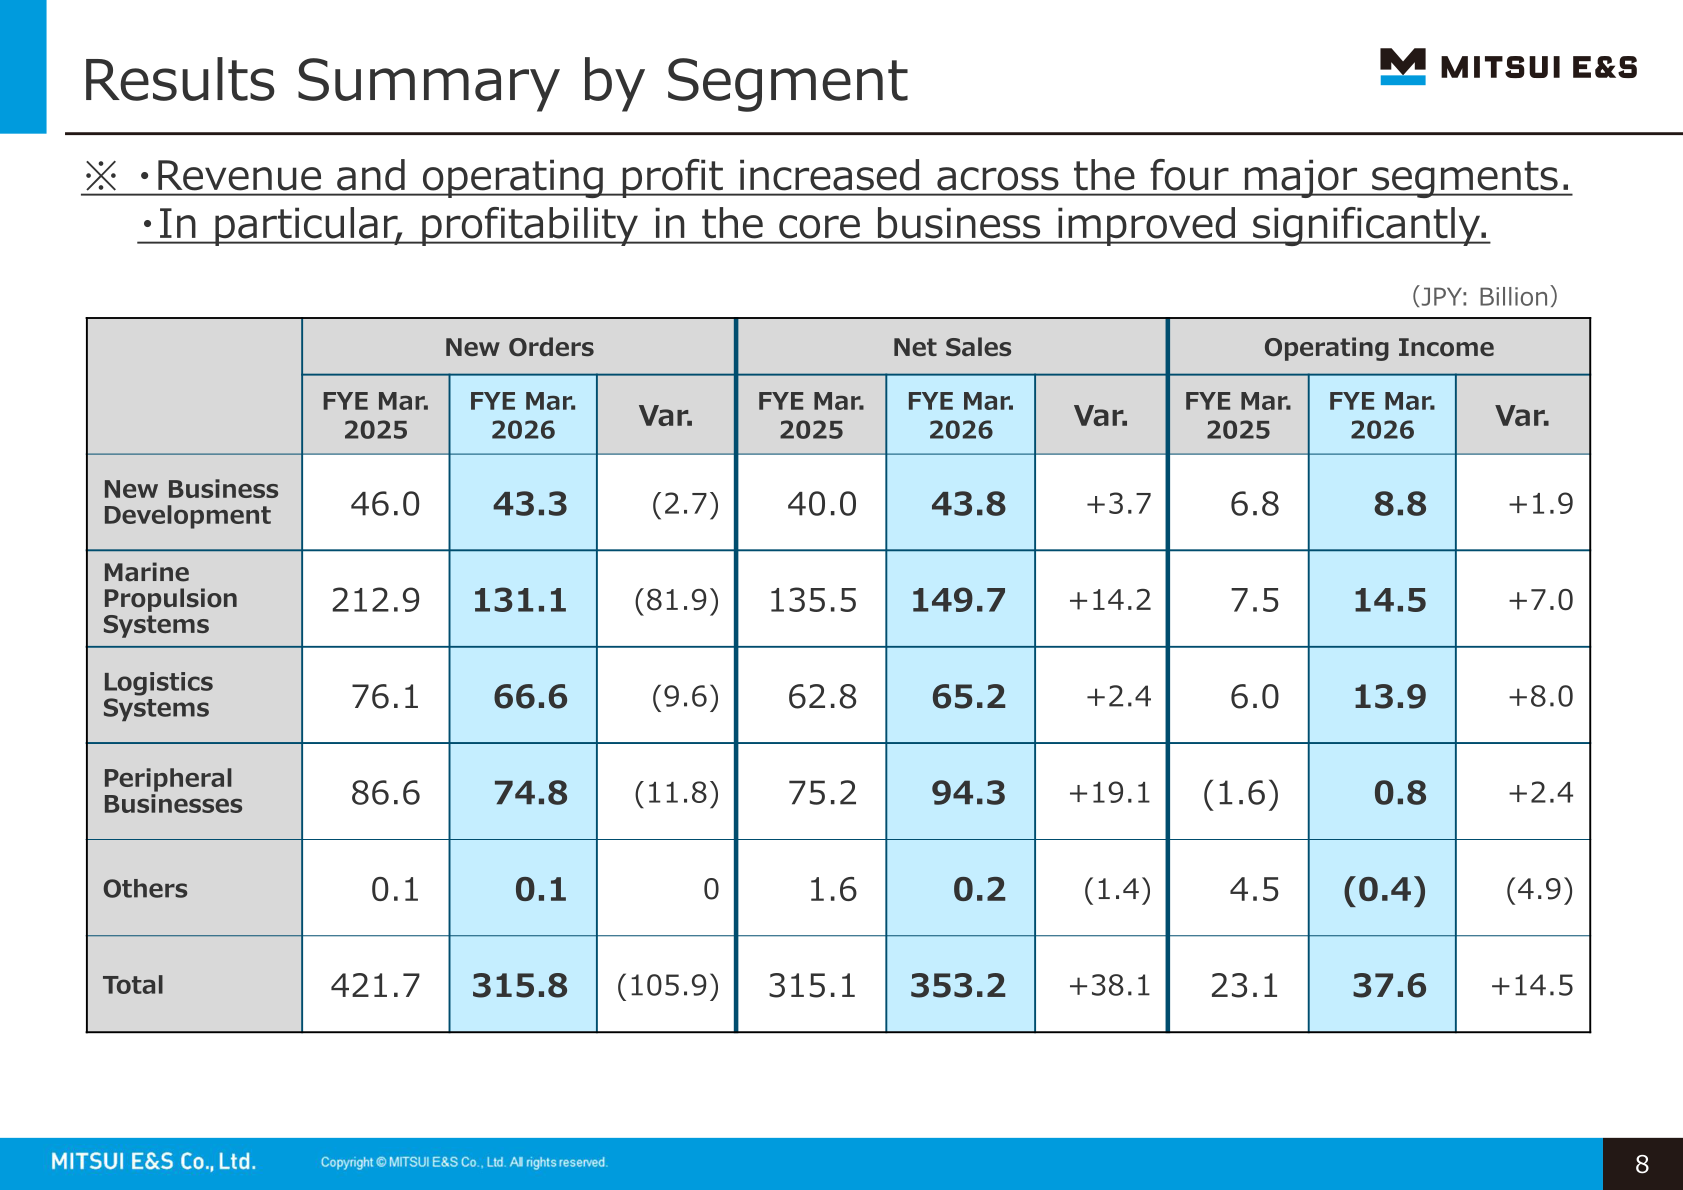
The company states that revenue and operating profit increased across the four major segments and that profitability in the core business improved significantly. Marine Propulsion Systems posted net sales of 149.7 billion yen (+14.2) and operating income of 14.5 billion yen (+7.0), with orders down 81.9 billion yen to 131.1 billion yen against the prior-year bulk order of multiple large marine engines, although the company notes orders exceeded the plan of 120.0 billion yen. Logistics Systems recorded net sales of 65.2 billion yen (+2.4) and operating income of 13.9 billion yen (+8.0), helped by improved profitability of large-scale overseas projects through enhanced production efficiency and cost reductions at the Oita Works, with orders of 66.6 billion yen exceeding the plan of 60.0 billion yen. New Business Development delivered net sales of 43.8 billion yen (+3.7) and operating income of 8.8 billion yen (+1.9), while Peripheral Businesses turned an operating loss of (1.6) into operating income of 0.8 billion yen on net sales of 94.3 billion yen (+19.1).
| Segment (JPY: Billion) | Metric | FYE Mar. 2026 | FYE Mar. 2025 | Var. |
|---|---|---|---|---|
| New Business Development | New Orders | 43.3 | 46.0 | (2.7) |
| New Business Development | Net Sales | 43.8 | 40.0 | +3.7 |
| New Business Development | Operating Income | 8.8 | 6.8 | +1.9 |
| Marine Propulsion Systems | New Orders | 131.1 | 212.9 | (81.9) |
| Marine Propulsion Systems | Net Sales | 149.7 | 135.5 | +14.2 |
| Marine Propulsion Systems | Operating Income | 14.5 | 7.5 | +7.0 |
| Logistics Systems | New Orders | 66.6 | 76.1 | (9.6) |
| Logistics Systems | Net Sales | 65.2 | 62.8 | +2.4 |
| Logistics Systems | Operating Income | 13.9 | 6.0 | +8.0 |
| Peripheral Businesses | New Orders | 74.8 | 86.6 | (11.8) |
| Peripheral Businesses | Net Sales | 94.3 | 75.2 | +19.1 |
| Peripheral Businesses | Operating Income | 0.8 | (1.6) | +2.4 |
| Others | New Orders | 0.1 | 0.1 | 0 |
| Others | Net Sales | 0.2 | 1.6 | (1.4) |
| Others | Operating Income | (0.4) | 4.5 | (4.9) |
| Total | New Orders | 315.8 | 421.7 | (105.9) |
| Total | Net Sales | 353.2 | 315.1 | +38.1 |
| Total | Operating Income | 37.6 | 23.1 | +14.5 |
Balance Sheet and Cash Flow
Total assets rose 45.3 billion yen to 494.6 billion yen, while total liabilities fell 14.3 billion yen to 260.7 billion yen and total net assets rose 59.7 billion yen to 233.8 billion yen. Shareholders’ equity increased 38.6 billion yen to 150.1 billion yen on net profit for the period, and the equity capital ratio improved to 46.3% from 37.8%. Debt with interest declined 5.1 billion yen to 92.7 billion yen, mainly on repayments of long-term debt, and the D/E ratio was 0.4 versus 0.6. Operating cash flow increased 13.6 billion yen to 28.4 billion yen on solid performance across the main business segments, while investing cash flow was 2.6 billion yen against 60.9 billion yen a year earlier, which the company attributes mainly to a cash-in from the sale of shares in affiliated companies in the prior year. Free cash flow was 31.0 billion yen, down 44.8 billion yen, and financial cash flow was (10.4) billion yen.
FYE Mar. 2027 Forecast
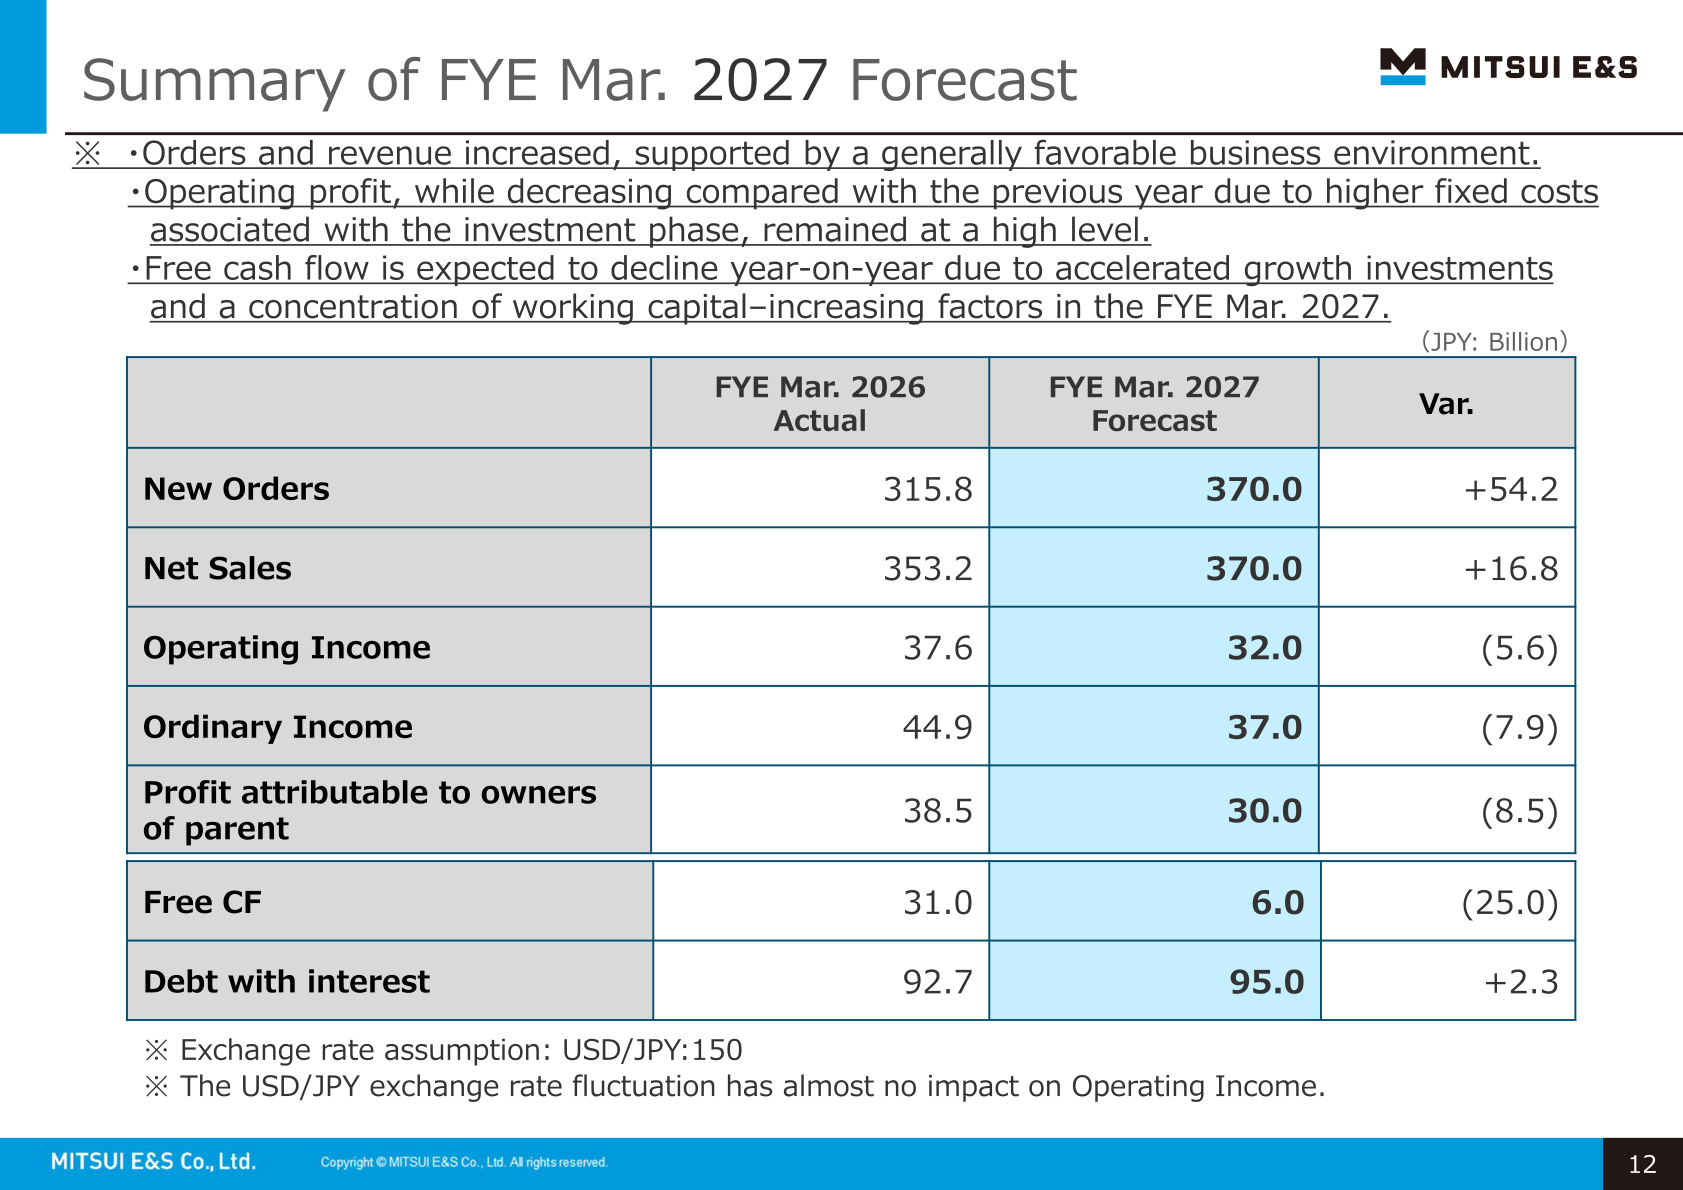
For the fiscal year ending March 31, 2027, the company forecasts new orders of 370.0 billion yen (+54.2) and net sales of 370.0 billion yen (+16.8), with operating income of 32.0 billion yen (down 5.6), ordinary income of 37.0 billion yen (down 7.9) and profit attributable to owners of parent of 30.0 billion yen (down 8.5). The materials state that orders and revenue increase on a generally favorable business environment, while operating profit decreases due to higher fixed costs associated with the investment phase yet remains at a high level. Free cash flow is expected at 6.0 billion yen, down 25.0 billion yen, due to accelerated growth investments and a concentration of working capital-increasing factors in the year. The exchange rate assumption is USD/JPY 150, and the company notes that USD/JPY fluctuation has almost no impact on operating income. By segment, growth in order intake and revenue is to be driven by Marine Propulsion Systems, whose orders are forecast at 170.0 billion yen (+38.9) and net sales at 160.0 billion yen (+10.3). CAPEX is planned at 13.6 billion yen against 9.1 billion yen in FYE Mar. 2026, and R&D at 1.8 billion yen against 1.7 billion yen.
| Item (JPY: Billion) | FYE Mar. 2027 Forecast | FYE Mar. 2026 Actual | Var. |
|---|---|---|---|
| New Orders | 370.0 | 315.8 | +54.2 |
| Net Sales | 370.0 | 353.2 | +16.8 |
| Operating Income | 32.0 | 37.6 | (5.6) |
| Ordinary Income | 37.0 | 44.9 | (7.9) |
| Profit attributable to owners of parent | 30.0 | 38.5 | (8.5) |
| Free CF | 6.0 | 31.0 | (25.0) |
| Debt with interest | 95.0 | 92.7 | +2.3 |
| Segment (JPY: Billion) | Metric | FYE Mar. 2027 Forecast | [Var.] | FYE Mar. 2026 Actual |
|---|---|---|---|---|
| New Business Development | New Orders | 45.0 | [+1.7] | 43.3 |
| New Business Development | Net Sales | 45.0 | [+1.2] | 43.8 |
| New Business Development | Operating Income | 8.0 | [(0.8)] | 8.8 |
| Marine Propulsion Systems | New Orders | 170.0 | [+38.9] | 131.1 |
| Marine Propulsion Systems | Net Sales | 160.0 | [+10.3] | 149.7 |
| Marine Propulsion Systems | Operating Income | 12.0 | [(2.5)] | 14.5 |
| Logistics Systems | New Orders | 65.0 | [(1.6)] | 66.6 |
| Logistics Systems | Net Sales | 70.0 | [+4.8] | 65.2 |
| Logistics Systems | Operating Income | 8.0 | [(5.9)] | 13.9 |
| Peripheral Businesses | New Orders | 90.0 | [+15.2] | 74.8 |
| Peripheral Businesses | Net Sales | 95.0 | [+0.7] | 94.3 |
| Peripheral Businesses | Operating Income | 4.0 | [+3.2] | 0.8 |
| Others | New Orders | 0 | [(0.1)] | 0.1 |
| Others | Net Sales | 0 | [(0.2)] | 0.2 |
| Others | Operating Income | 0 | [+0.4] | (0.4) |
| Total | New Orders | 370.0 | [+54.2] | 315.8 |
| Total | Net Sales | 370.0 | [+16.8] | 353.2 |
| Total | Operating Income | 32.0 | [(5.6)] | 37.6 |
Shareholder Returns
This cannot be confirmed from the materials. The presentation does not contain a dividend or share buyback section.
Topics
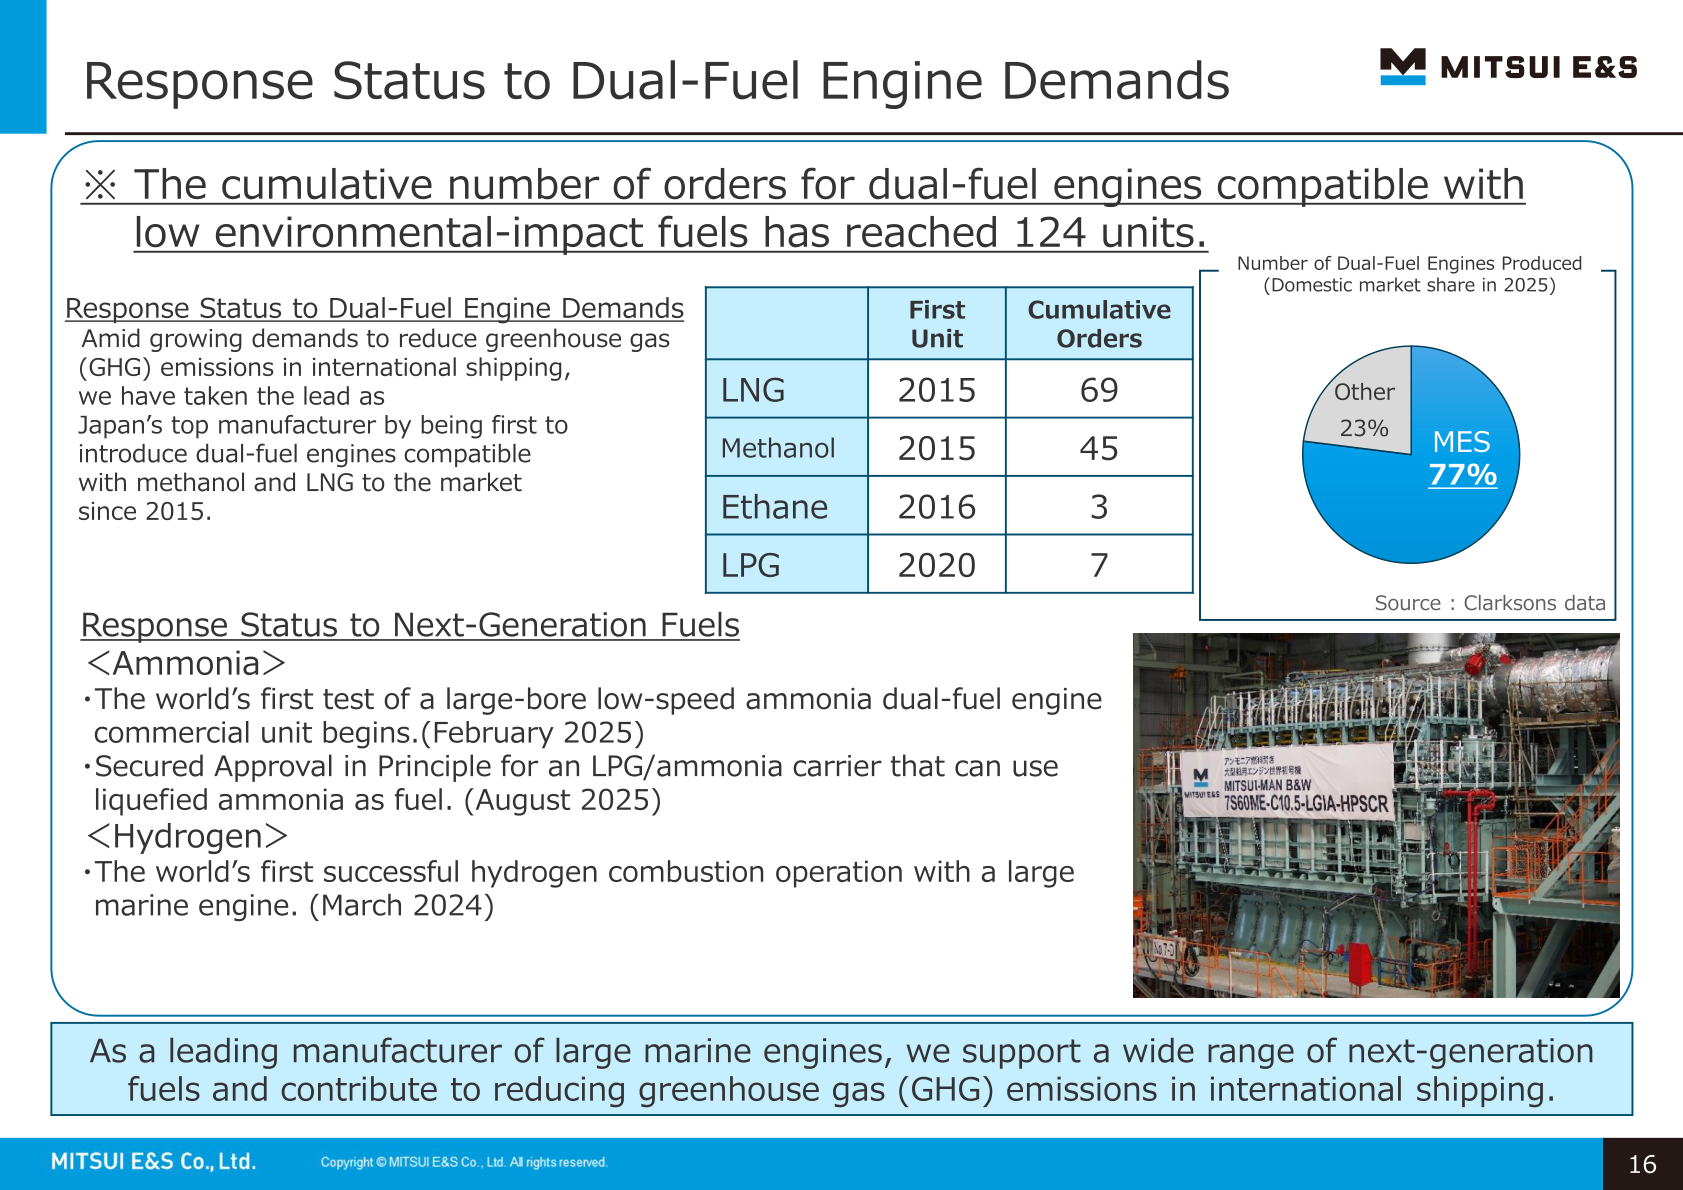
The company presents a Green & Digital Strategy under which it will enhance product development with green and digital technologies to help solve customers’ challenges, and introduces the Drone Snap Solution, a cloud-based application for managing drone-captured images with AI-powered inspection and analysis, applied to automated patrol inspection of plant equipment and large-scale petrochemical plants. On dual-fuel engines, cumulative orders for engines compatible with low environmental-impact fuels have reached 124 units, comprising LNG 69 units (first unit 2015), methanol 45 units (2015), ethane 3 units (2016) and LPG 7 units (2020), with a 77% domestic share of dual-fuel engines produced in 2025 based on Clarksons data. On next-generation fuels, the company cites the world’s first test of a large-bore low-speed ammonia dual-fuel engine commercial unit beginning in February 2025, an Approval in Principle for an LPG/ammonia carrier that can use liquefied ammonia as fuel in August 2025, and the world’s first successful hydrogen combustion operation with a large marine engine in March 2024. In Logistics Systems, the company secured an order for 17 rubber-tired gantry cranes from Y3 Berth at the Port of Tokyo; these are eco-friendly models powered by electricity supplied from an electrical bus-bar installed along the container lane and can be operated from a remote operation console in the administration building.
This article is an analysis based on publicly available information and is not a recommendation to buy or sell any specific securities. Investment decisions are your own responsibility.
![[Obayashi] Investors’ Guide 2026 — The Complete 24-Article Breakdown](https://japan-equity.com/wp-content/uploads/2026/07/hub_cover-1024x1024.png)
![[Obayashi] IR & SR Policy — Feeding Dialogue Back into Management](https://japan-equity.com/wp-content/uploads/2026/07/p32_sq-1024x1024.jpg)
![[Obayashi] Real Estate Development — 18.7% Margin, ¥287.7bn Unrealized Gains](https://japan-equity.com/wp-content/uploads/2026/07/p20_sq-1024x1024.jpg)
![[Obayashi] Domestic Civil Engineering — Resilience Spending Supports 9.6% Margin](https://japan-equity.com/wp-content/uploads/2026/07/p11_sq-1024x1024.jpg)
![[Obayashi] Share Price & External Ratings — vs TOPIX, ESG Index Inclusion](https://japan-equity.com/wp-content/uploads/2026/07/p40_sq-1024x1024.jpg)
![[Construction] ¥75.5tn Investment, Shrinking Workforce — Big-5 Market Share](https://japan-equity.com/wp-content/uploads/2026/07/p12_sq-1024x1024.jpg)



![[Obayashi] Capital Policy & Shareholder Returns — ROE 10%+, DOE ~5%, ¥100bn Buyback](https://japan-equity.com/wp-content/uploads/2026/07/p27_sq-1024x1024.jpg)
![[Obayashi] Reducing Cross-Shareholdings — ¥285.2bn Sold in Five Years](https://japan-equity.com/wp-content/uploads/2026/07/p29_sq-1024x1024.jpg)
![[Obayashi] ¥750bn Investment Plan — ¥300bn to Development, ¥190bn to Tech/DX](https://japan-equity.com/wp-content/uploads/2026/07/p30_sq-1024x1024.jpg)
![[Obayashi] MTP2022 KPIs — Operating Profit ~2x Target, ROE 14.4%](https://japan-equity.com/wp-content/uploads/2026/07/p25_sq-1024x1024.jpg)
![[Obayashi] Cash Allocation — ¥420bn Investment CF Over Five Years](https://japan-equity.com/wp-content/uploads/2026/07/p26_sq-1024x1024.jpg)
![[Obayashi] Green Energy — 44 Plants, 344MW, and the Green Hydrogen Challenge](https://japan-equity.com/wp-content/uploads/2026/07/p21_sq-1024x1024.jpg)
![[Obayashi] Tackling the Labor Shortage — Robotics Construction®](https://japan-equity.com/wp-content/uploads/2026/07/p14_sq-1024x1024.jpg)
