
This article is based on publicly available IR materials and is not a recommendation to buy or sell any specific securities.
Note: Hamamatsu Photonics has a September fiscal year-end; “FY25” in this article follows the company’s own labeling and refers to the fiscal year ended September 30, 2025.
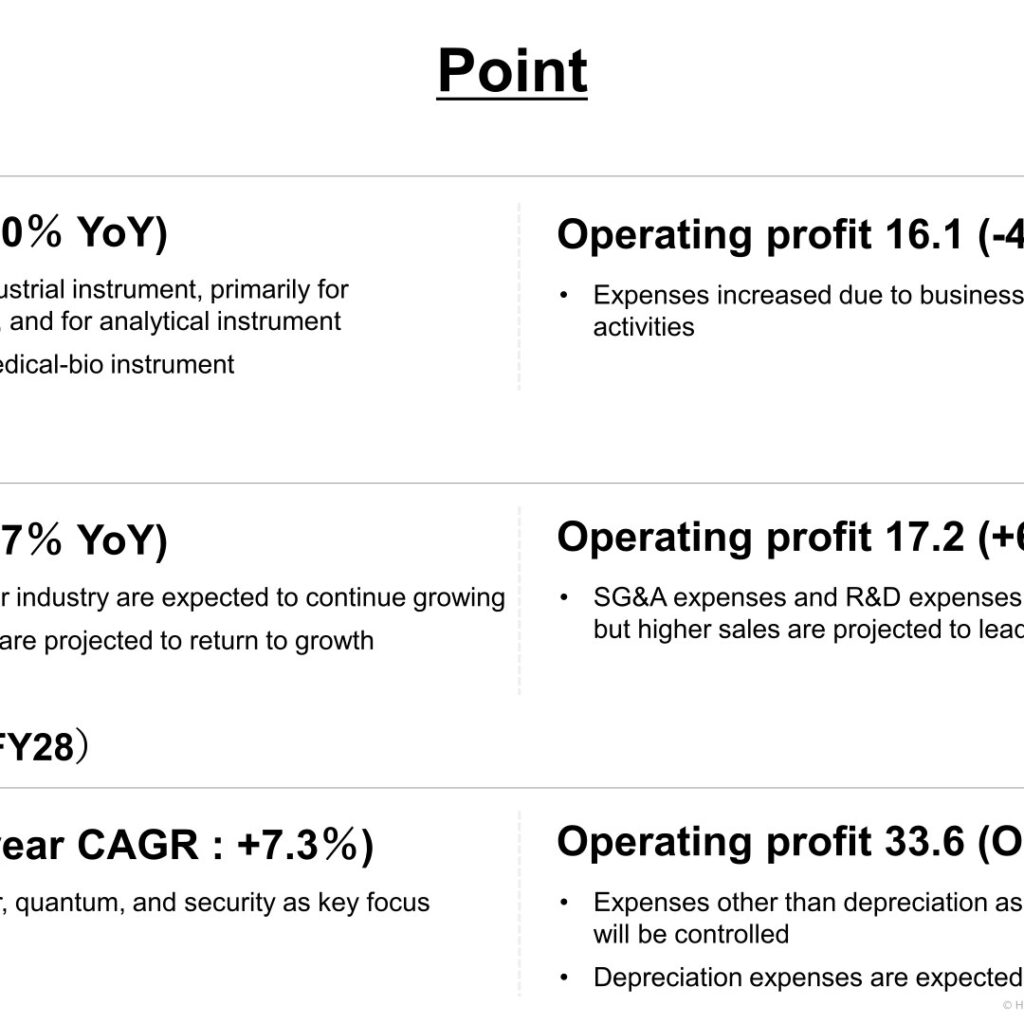
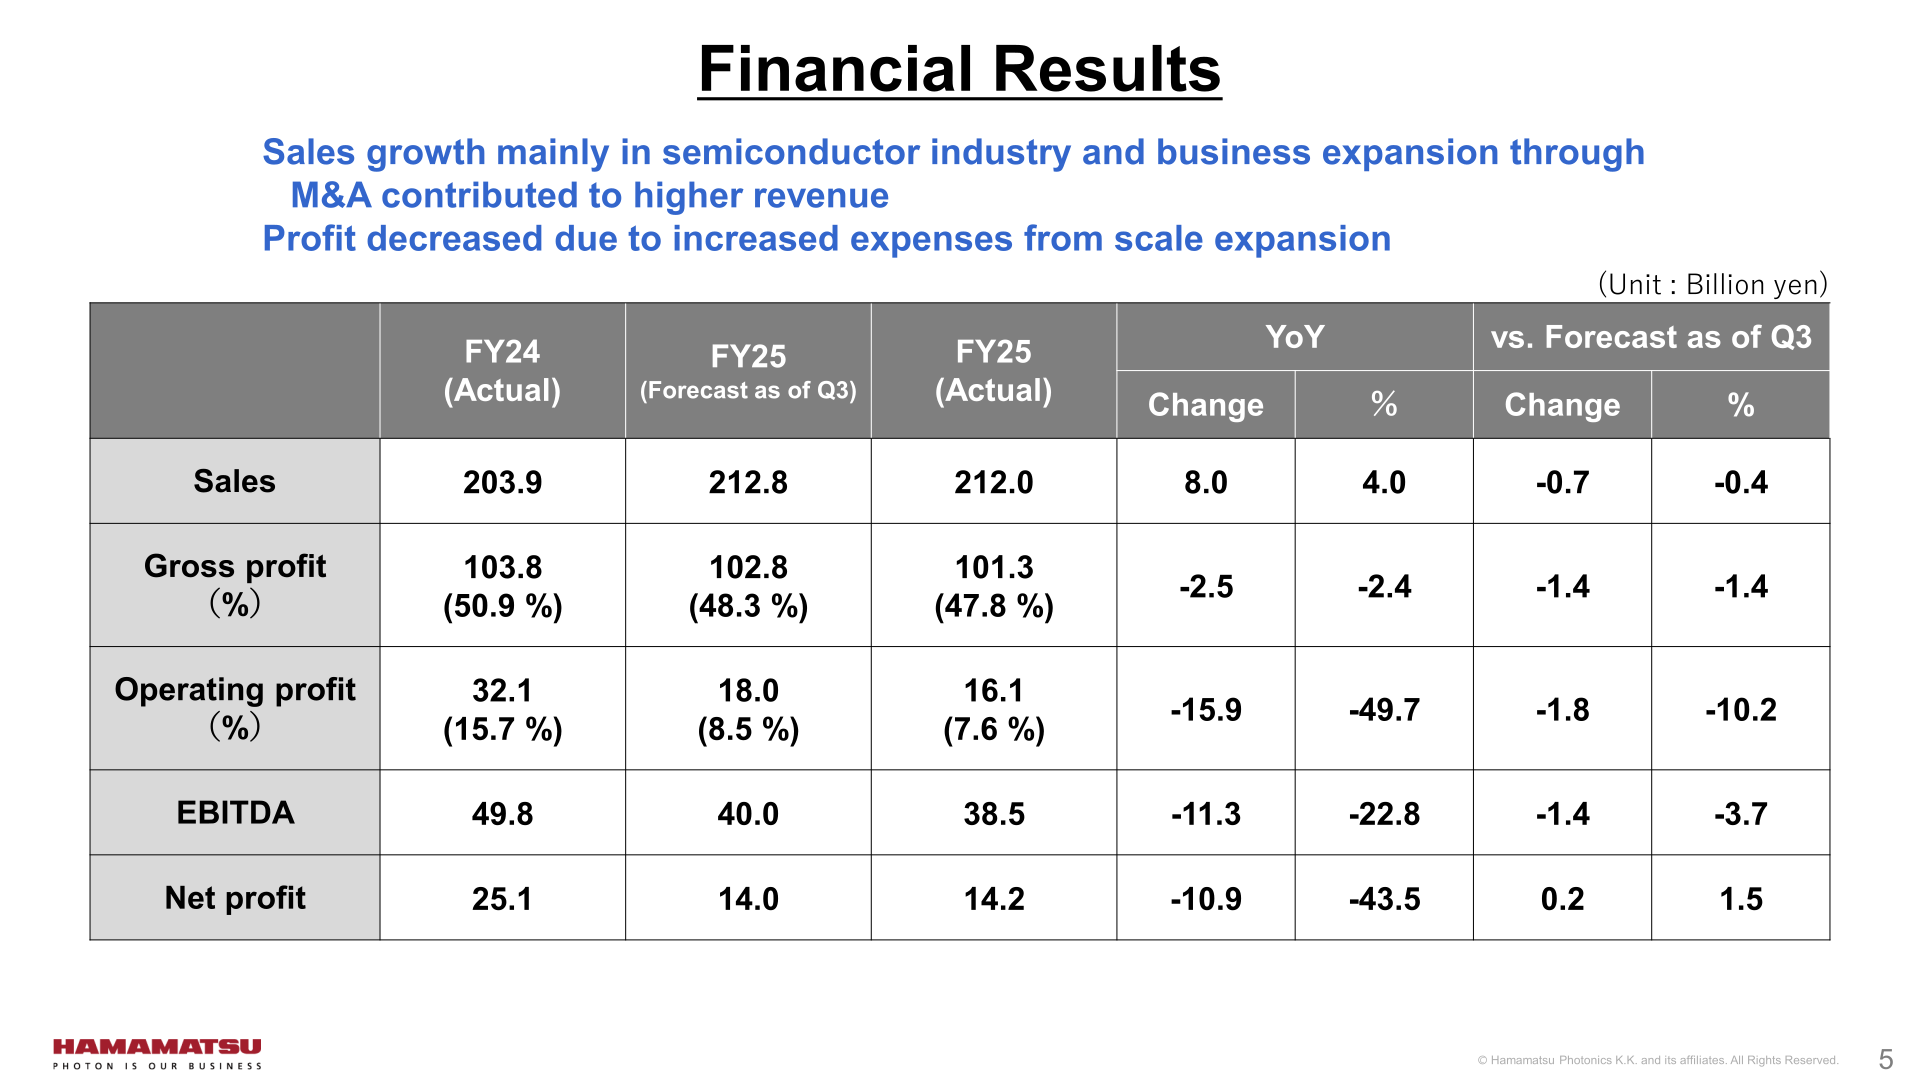
Hamamatsu Photonics K.K. (Tokyo Stock Exchange: 6965) announced results for the fiscal year ended September 30, 2025 in its Financial Presentation dated November 2025. Sales rose 4.0% year on year to 212.0 billion yen, driven by growth for the semiconductor industry and business expansion through M&A, while operating profit fell 49.7% to 16.1 billion yen as expenses increased with the expansion of business scale. Net profit declined 43.5% to 14.2 billion yen. For FY26, the company plans sales of 222.0 billion yen (+4.7%) and operating profit of 17.2 billion yen (+6.4%), and it announced an additional 20 billion yen in shareholder returns through share buybacks.
Consolidated Results (Full-Year Actual)
Sales increased for industrial instrument, primarily for the semiconductor industry, and for analytical instrument, while sales decreased for medical-bio instrument. Gross profit margin declined from 50.9% to 47.8%. Operating profit fell 15.9 billion yen year on year: an increase in gross profit from higher sales (+4.0 billion yen) was outweighed by a decrease due to a lower gross profit margin (-6.7 billion yen) and an increase in SG&A and R&D expenses (-13.2 billion yen). Of the increase in SG&A and R&D expenses, +10.1 billion yen came from the impact of M&A (NKT Photonics and Fairchild Imaging, including goodwill amortization of +2.4 billion yen) and +3.3 billion yen from factors excluding M&A. All figures in the table below are in billion yen.
| Item | FY24 (Actual) | FY25 (Actual) | YoY Change | YoY % |
|---|---|---|---|---|
| Sales | 203.9 | 212.0 | 8.0 | +4.0% |
| Gross profit (margin) | 103.8 (50.9%) | 101.3 (47.8%) | -2.5 | -2.4% |
| Operating profit (margin) | 32.1 (15.7%) | 16.1 (7.6%) | -15.9 | -49.7% |
| EBITDA | 49.8 | 38.5 | -11.3 | -22.8% |
| Net profit | 25.1 | 14.2 | -10.9 | -43.5% |
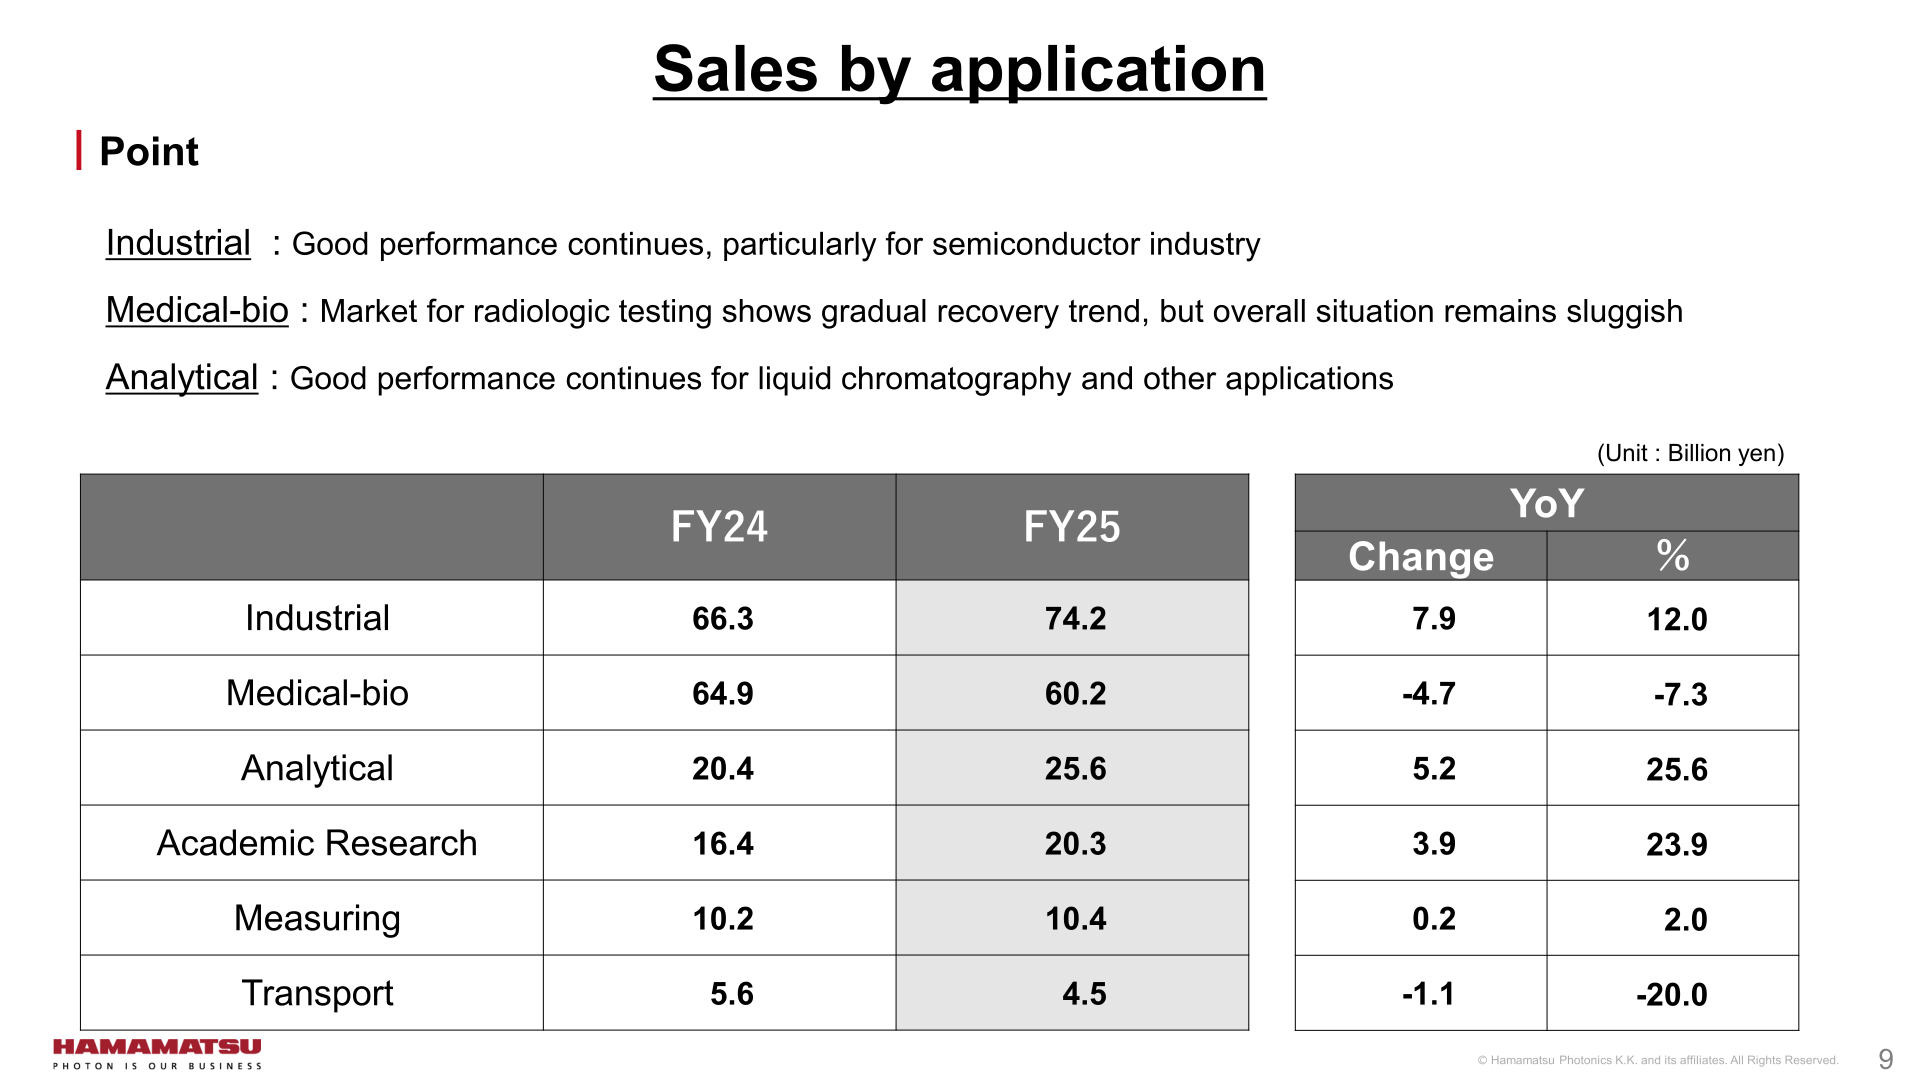
By application (billion yen), Industrial grew on continued good performance particularly for the semiconductor industry, and Analytical continued to perform well for liquid chromatography and other applications. In Medical-bio, the market for radiologic testing showed a gradual recovery trend, but the overall situation remained sluggish.
| Application | FY24 | FY25 | Change | % |
|---|---|---|---|---|
| Industrial | 66.3 | 74.2 | 7.9 | +12.0% |
| Medical-bio | 64.9 | 60.2 | -4.7 | -7.3% |
| Analytical | 20.4 | 25.6 | 5.2 | +25.6% |
| Academic Research | 16.4 | 20.3 | 3.9 | +23.9% |
| Measuring | 10.2 | 10.4 | 0.2 | +2.0% |
| Transport | 5.6 | 4.5 | -1.1 | -20.0% |
Segment Results
By reportable segment (million yen; sales include intersegment sales; figures rounded down to the nearest million yen), Electron tube posted sales of 72,467 million yen with a segment profit of 18,953 million yen (26.2% margin), and Opto-semiconductor posted sales of 80,472 million yen with a segment profit of 12,583 million yen (15.6% margin). The Laser segment recorded a segment loss of 4,365 million yen (-19.4% margin); the company targets NKT Photonics turning profitable in FY2028, including goodwill amortization.
| Segment | FY25 Sales (million yen) | FY25 Segment profit (million yen) | Segment profit margin |
|---|---|---|---|
| Electron tube | 72,467 | 18,953 | 26.2% |
| Opto-semiconductor | 80,472 | 12,583 | 15.6% |
| Imaging and measurement instruments | 32,781 | 9,698 | 29.6% |
| Laser | 22,455 | -4,365 | -19.4% |
| Others | 3,874 | – | – |
| Total | 212,051 | – | – |
FY26 Plan
For FY26, the company plans revenue and profit growth driven by increased demand in key sectors, particularly industrial instruments for the semiconductor industry. Sales for the semiconductor industry are expected to continue growing, and medical-bio instrument is projected to return to growth. SG&A expenses and R&D expenses are expected to increase, but higher sales are projected to lead to profit growth. All figures in the table below are in billion yen.
| Item | FY25 (Actual) | FY26 (Plan) | YoY Change | YoY % |
|---|---|---|---|---|
| Sales | 212.0 | 222.0 | 9.9 | +4.7% |
| Gross profit (margin) | 101.3 (47.8%) | 106.2 (47.8%) | 4.8 | +4.8% |
| Operating profit (margin) | 16.1 (7.6%) | 17.2 (7.7%) | 1.0 | +6.4% |
| EBITDA | 38.5 | 39.9 | 1.4 | +3.8% |
| Net profit | 14.2 | 14.3 | 0 | +0.7% |
By application (billion yen), the FY26 plan calls for Industrial sales of 78.9 (+6.3%) on continued strength for the semiconductor industry, Medical-bio sales of 64.4 (+7.0%) with increases expected in major applications such as X-ray CT, and Analytical sales of 26.3 (+2.6%). Academic Research sales are expected to decline to 18.5 (-8.7%) due to the completion of a large-scale project.
Mid-term Plan
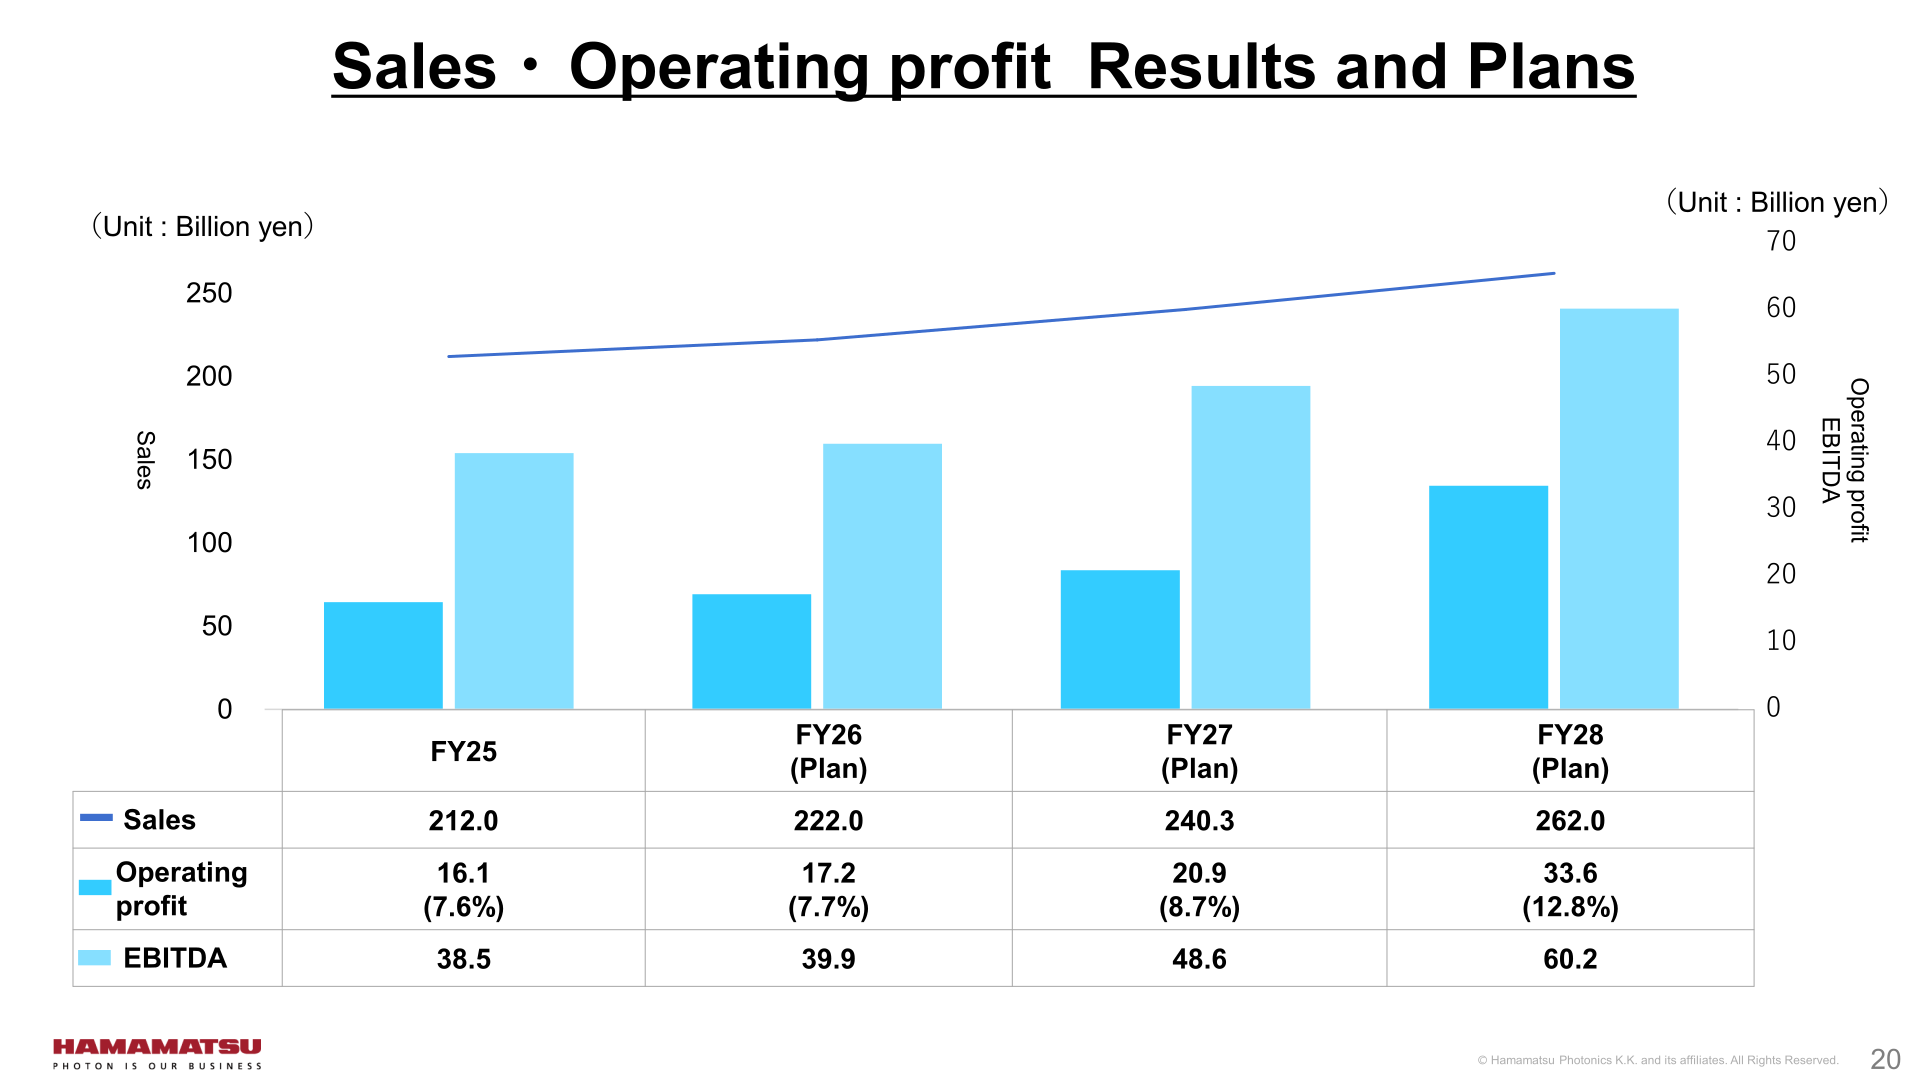
Under the mid-term plan, the company targets FY28 sales of 262.0 billion yen (3-year CAGR of +7.3%), operating profit of 33.6 billion yen (operating margin of 12.8%), and EBITDA of 60.2 billion yen, with FY27 plans of 240.3 billion yen in sales and 20.9 billion yen in operating profit (8.7%). Semiconductor, quantum, and security are addressed as key focus markets. Expenses other than depreciation associated with investments will be controlled, and depreciation expenses are expected to peak in FY27. The company also targets a cash conversion cycle of 240 days by FY28, from 327 days in FY24 and 290 days in FY25. In the semiconductor market, the company sets a sales target of 68 billion yen for FY30 (CAGR of 8.1% from FY25 to FY30).
Shareholder Returns
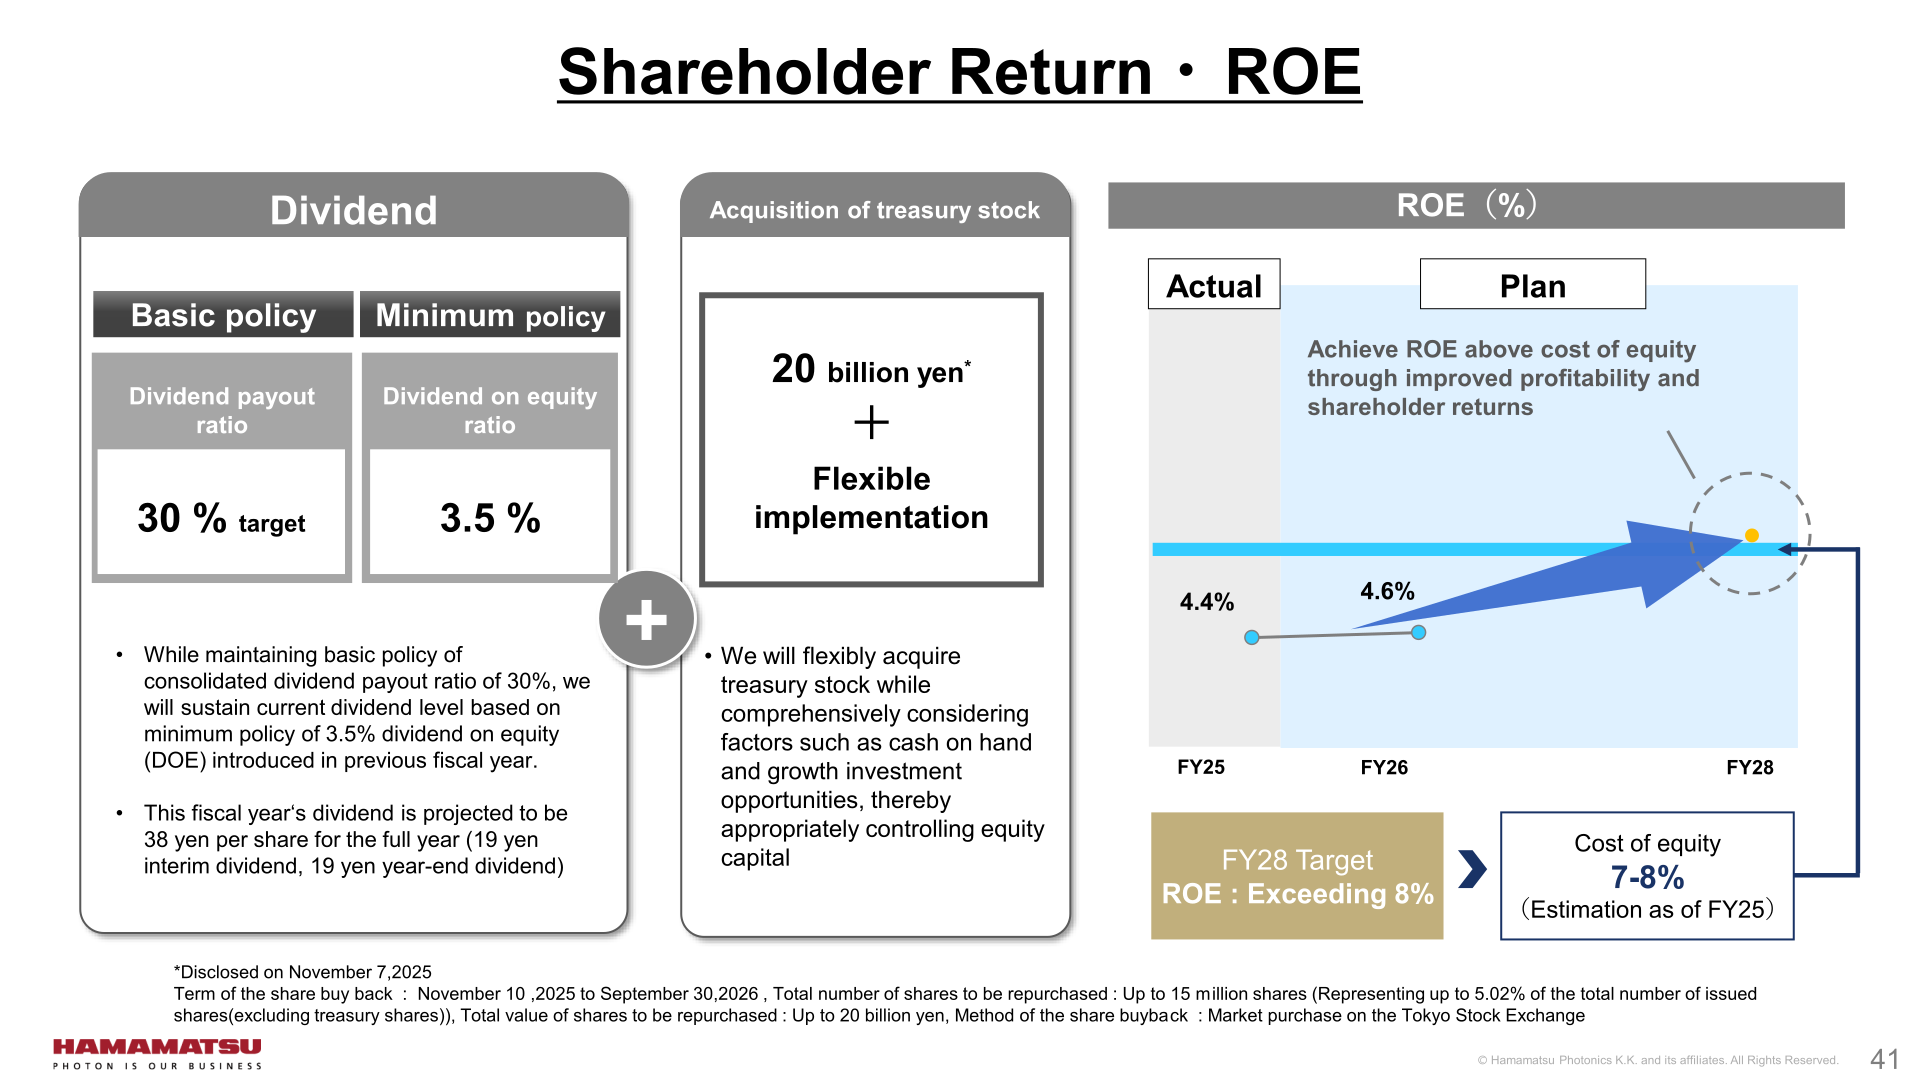
The company maintains a basic policy of a consolidated dividend payout ratio of 30% and will sustain the current dividend level based on the minimum policy of a 3.5% dividend on equity (DOE) introduced in the previous fiscal year. The dividend for the current fiscal year is projected to be 38 yen per share for the full year (19 yen interim dividend, 19 yen year-end dividend). In addition, the company will implement an additional 20 billion yen in shareholder returns through share buybacks, disclosed on November 7, 2025: the buyback term runs from November 10, 2025 to September 30, 2026, for up to 15 million shares (representing up to 5.02% of the total number of issued shares, excluding treasury shares) and up to 20 billion yen in total value, by market purchase on the Tokyo Stock Exchange. Under its three-year capital allocation plan, out of total sources of 289.0 billion yen, the company allocates 52.0 billion yen to shareholder returns alongside 59.0 billion yen for R&D expenses and 63.0 billion yen for capital investment. For FY28, the company targets ROE exceeding 8%, aiming to achieve ROE above its cost of equity (estimated at 7-8% as of FY25) through improved profitability and shareholder returns.
This article is an analysis based on publicly available information and is not a recommendation to buy or sell any specific securities. Investment decisions are your own responsibility.
![[Obayashi] Investors’ Guide 2026 — The Complete 24-Article Breakdown](https://japan-equity.com/wp-content/uploads/2026/07/hub_cover-1024x1024.png)
![[Obayashi] IR & SR Policy — Feeding Dialogue Back into Management](https://japan-equity.com/wp-content/uploads/2026/07/p32_sq-1024x1024.jpg)
![[Obayashi] Real Estate Development — 18.7% Margin, ¥287.7bn Unrealized Gains](https://japan-equity.com/wp-content/uploads/2026/07/p20_sq-1024x1024.jpg)
![[Obayashi] Domestic Civil Engineering — Resilience Spending Supports 9.6% Margin](https://japan-equity.com/wp-content/uploads/2026/07/p11_sq-1024x1024.jpg)
![[Obayashi] Share Price & External Ratings — vs TOPIX, ESG Index Inclusion](https://japan-equity.com/wp-content/uploads/2026/07/p40_sq-1024x1024.jpg)
![[Construction] ¥75.5tn Investment, Shrinking Workforce — Big-5 Market Share](https://japan-equity.com/wp-content/uploads/2026/07/p12_sq-1024x1024.jpg)



![[Obayashi] Capital Policy & Shareholder Returns — ROE 10%+, DOE ~5%, ¥100bn Buyback](https://japan-equity.com/wp-content/uploads/2026/07/p27_sq-1024x1024.jpg)
![[Obayashi] Reducing Cross-Shareholdings — ¥285.2bn Sold in Five Years](https://japan-equity.com/wp-content/uploads/2026/07/p29_sq-1024x1024.jpg)
![[Obayashi] ¥750bn Investment Plan — ¥300bn to Development, ¥190bn to Tech/DX](https://japan-equity.com/wp-content/uploads/2026/07/p30_sq-1024x1024.jpg)
![[Obayashi] MTP2022 KPIs — Operating Profit ~2x Target, ROE 14.4%](https://japan-equity.com/wp-content/uploads/2026/07/p25_sq-1024x1024.jpg)
![[Obayashi] Cash Allocation — ¥420bn Investment CF Over Five Years](https://japan-equity.com/wp-content/uploads/2026/07/p26_sq-1024x1024.jpg)
![[Obayashi] Green Energy — 44 Plants, 344MW, and the Green Hydrogen Challenge](https://japan-equity.com/wp-content/uploads/2026/07/p21_sq-1024x1024.jpg)
![[Obayashi] Tackling the Labor Shortage — Robotics Construction®](https://japan-equity.com/wp-content/uploads/2026/07/p14_sq-1024x1024.jpg)
