
This article is based on publicly available IR materials and is not a recommendation to buy or sell any specific securities.
Note: This article covers the fiscal year ended March 31, 2026, which Stanley Electric labels “FY2026/3”; japan-equity.com classifies each company’s most recent completed fiscal year as FY2025, and the labels used in the text and tables below follow the company’s own materials.
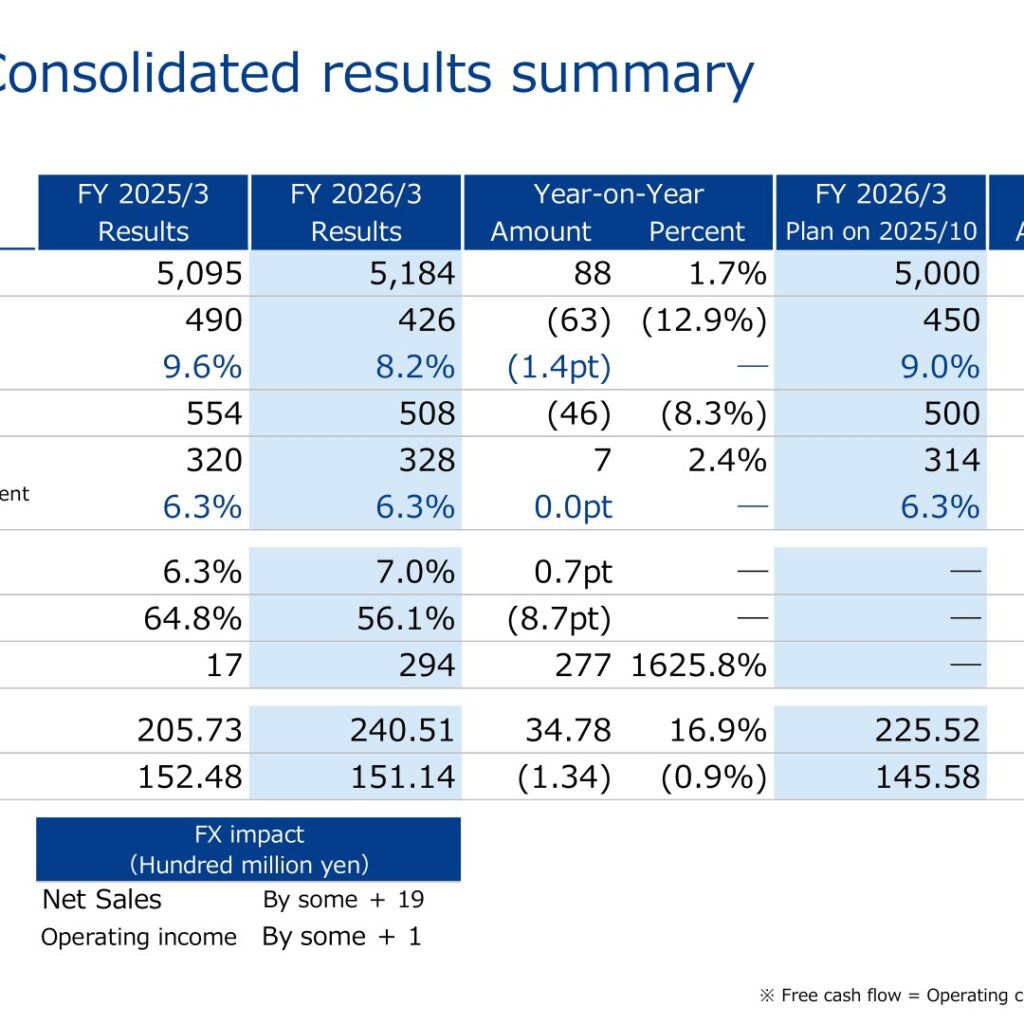
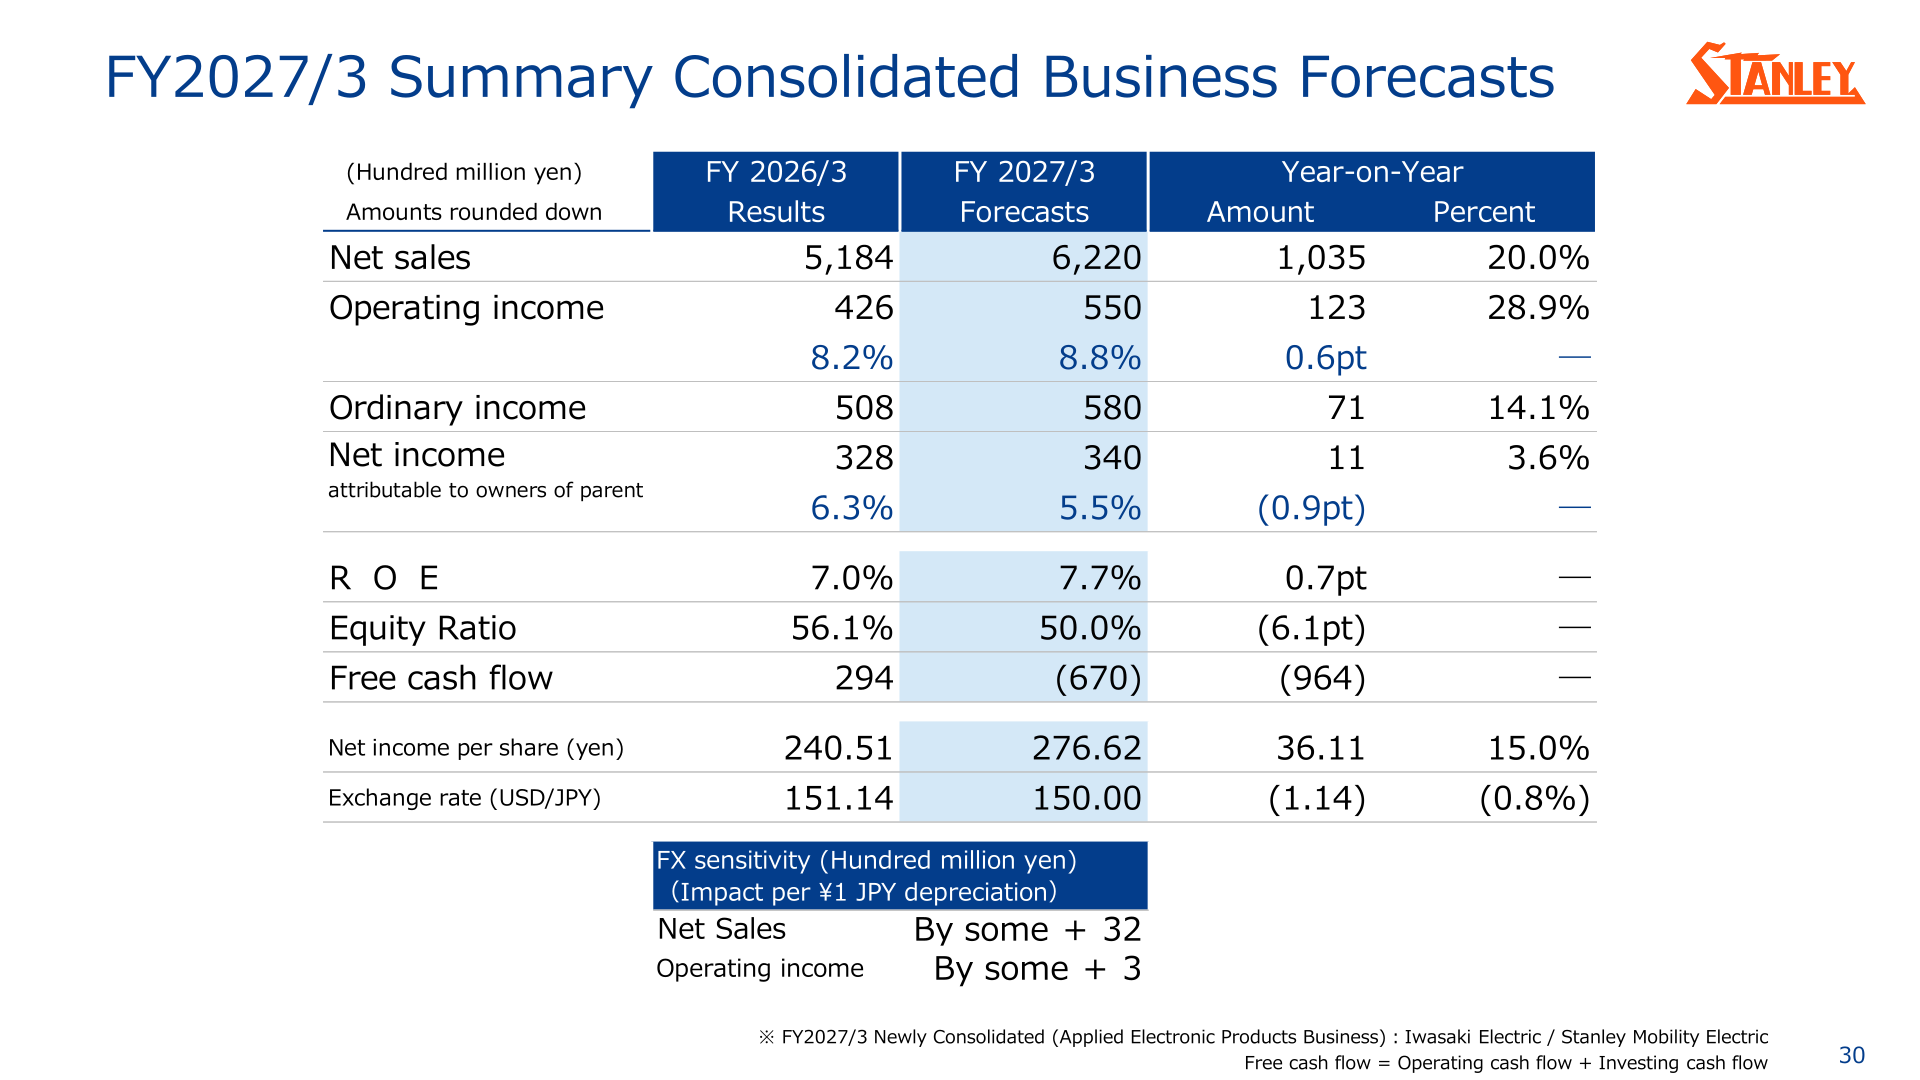
Stanley Electric announced results for FY2026/3 together with its new Medium-term Management Plan on May 22, 2026. Net sales came to 518.4 billion yen, up 1.7% year on year, while operating income declined 12.9% to 42.6 billion yen. The company states that revenue increased supported by solid performance in the Americas and Asia-Pacific (motorcycle business), along with favorable foreign exchange effects, and that profit declined due to the impact of semiconductor shortages and the occurrence of one-off costs. Net income attributable to owners of parent nonetheless rose 2.4% to 328 hundred million yen, and ROE improved to 7.0%.
Consolidated Results (Full-Year Actual)
Sales reached a new high for the company’s disclosed ten-year trend while operating income fell for the year. On the operating income bridge, the company shows total operating income growth effects of +108 hundred million yen against decrease effects of -172 hundred million yen, for a net decline of 63 hundred million yen. Against the plan announced in October 2025, net sales exceeded the plan by 184 hundred million yen (+3.7%) and operating income fell short by 23 hundred million yen ((5.2%)), while ordinary income came in 8 hundred million yen above plan (+1.7%) and net income attributable to owners of parent 14 hundred million yen above plan (+4.5%).
| Item | FY2026/3 (Results) | FY2025/3 (Results) | Year-on-Year |
|---|---|---|---|
| Net sales (Hundred million yen) | 5,184 | 5,095 | 88 / 1.7% |
| Operating income (Hundred million yen) | 426 | 490 | (63) / (12.9%) |
| Operating income to net sales ratio | 8.2% | 9.6% | (1.4pt) |
| Ordinary income (Hundred million yen) | 508 | 554 | (46) / (8.3%) |
| Net income attributable to owners of parent (Hundred million yen) | 328 | 320 | 7 / 2.4% |
| ROE | 7.0% | 6.3% | 0.7pt |
| Equity ratio | 56.1% | 64.8% | (8.7pt) |
| Free cash flow (Hundred million yen) | 294 | 17 | 277 / 1625.8% |
| Net income per share (yen) | 240.51 | 205.73 | 34.78 / 16.9% |
| Exchange rate (USD/JPY) | 151.14 | 152.48 | (1.34) / (0.9%) |
On the balance sheet, total assets grew to 8,092 hundred million yen from 7,496 hundred million yen, while liabilities rose to 2,373 hundred million yen from 1,506 hundred million yen and equity declined to 4,542 hundred million yen from 4,855 hundred million yen. The equity ratio therefore fell to 56% from 64% on the company’s conceptual diagram.
Segment Results
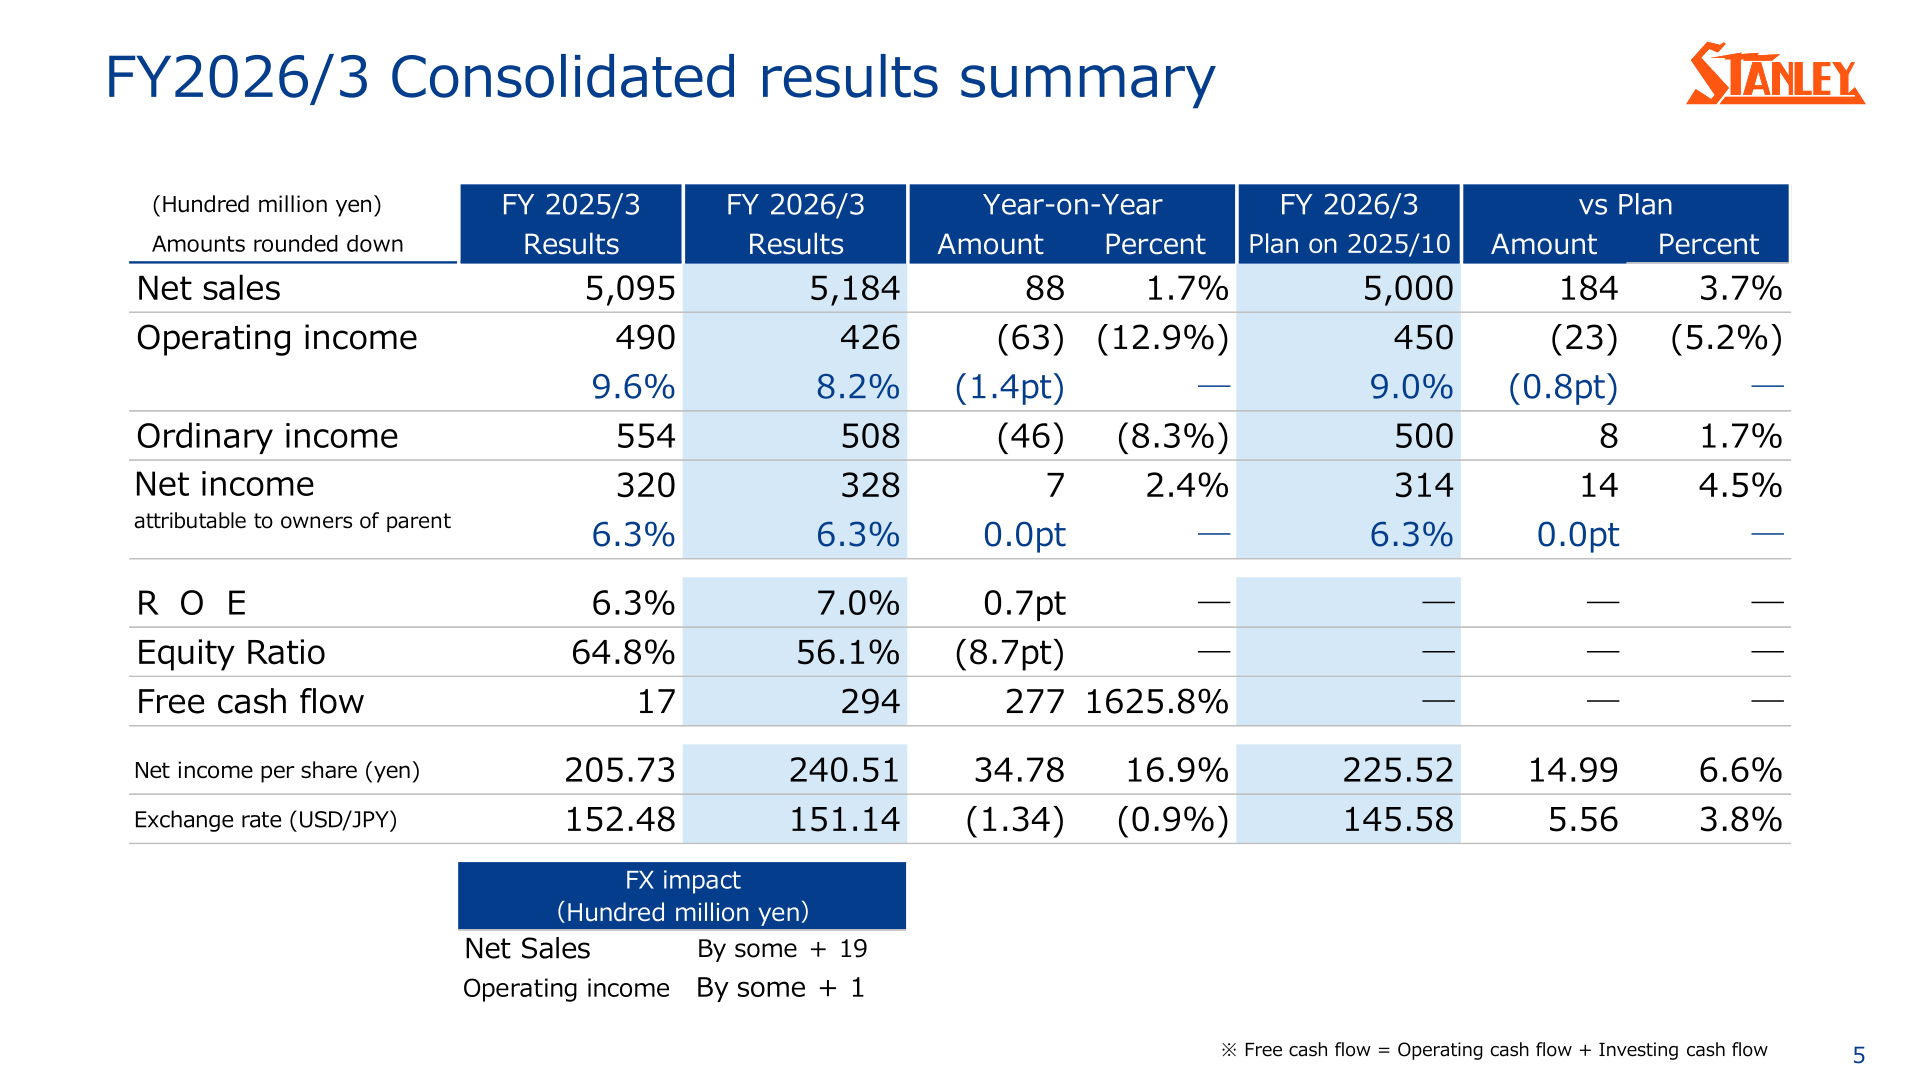
The Automotive Equipment Business and the Electronic Components Business both grew sales, while the Applied Electronic Products Business declined. Operating income fell in the Automotive Equipment Business and in the adjustment line, more than offsetting increases at the two smaller segments.
| Segment | Metric | FY2026/3 | FY2025/3 | Year-on-Year |
|---|---|---|---|---|
| Automotive Equipment Business | Net sales | 4,471 | 4,401 | 70 / 1.6% |
| Automotive Equipment Business | Operating income | 449 | 469 | (20) / (4.3%) |
| Automotive Equipment Business | Operating margin | 10.0% | 10.7% | (0.6pt) |
| Electronic Components Business | Net sales | 393 | 370 | 22 / 6.1% |
| Electronic Components Business | Operating income | 28 | 24 | 3 / 15.6% |
| Electronic Components Business | Operating margin | 7.3% | 6.7% | 0.6pt |
| Applied Electronic Products Business | Net sales | 1,125 | 1,163 | (37) / (3.2%) |
| Applied Electronic Products Business | Operating income | 93 | 88 | 4 / 5.6% |
| Applied Electronic Products Business | Operating margin | 8.3% | 7.6% | 0.7pt |
| Others | Net sales | 32 | 31 | 0 |
| Adjustment | Net sales | (837) | (871) | 33 |
| Total | Net sales | 5,184 | 5,095 | 88 / 1.7% |
| Total | Operating income | 426 | 490 | (63) / (12.9%) |
By geographical location, net sales were 1,277 hundred million yen in Japan (1,242 hundred million yen in FY2025/3), 1,507 hundred million yen in The Americas (1,422), 1,654 hundred million yen in Asia-Pacific (1,594), 650 hundred million yen in China (762) and 94 hundred million yen in Europe (74). Operating income was 13 hundred million yen in Japan (45), 65 hundred million yen in The Americas (97), 310 hundred million yen in Asia-Pacific (300), 54 hundred million yen in China (72) and a loss of 4 hundred million yen in Europe (a loss of 1). Asia-Pacific held an operating margin of 18.8%, while Japan’s margin fell to 1.1% from 3.7%.
FY2027/3 Forecast
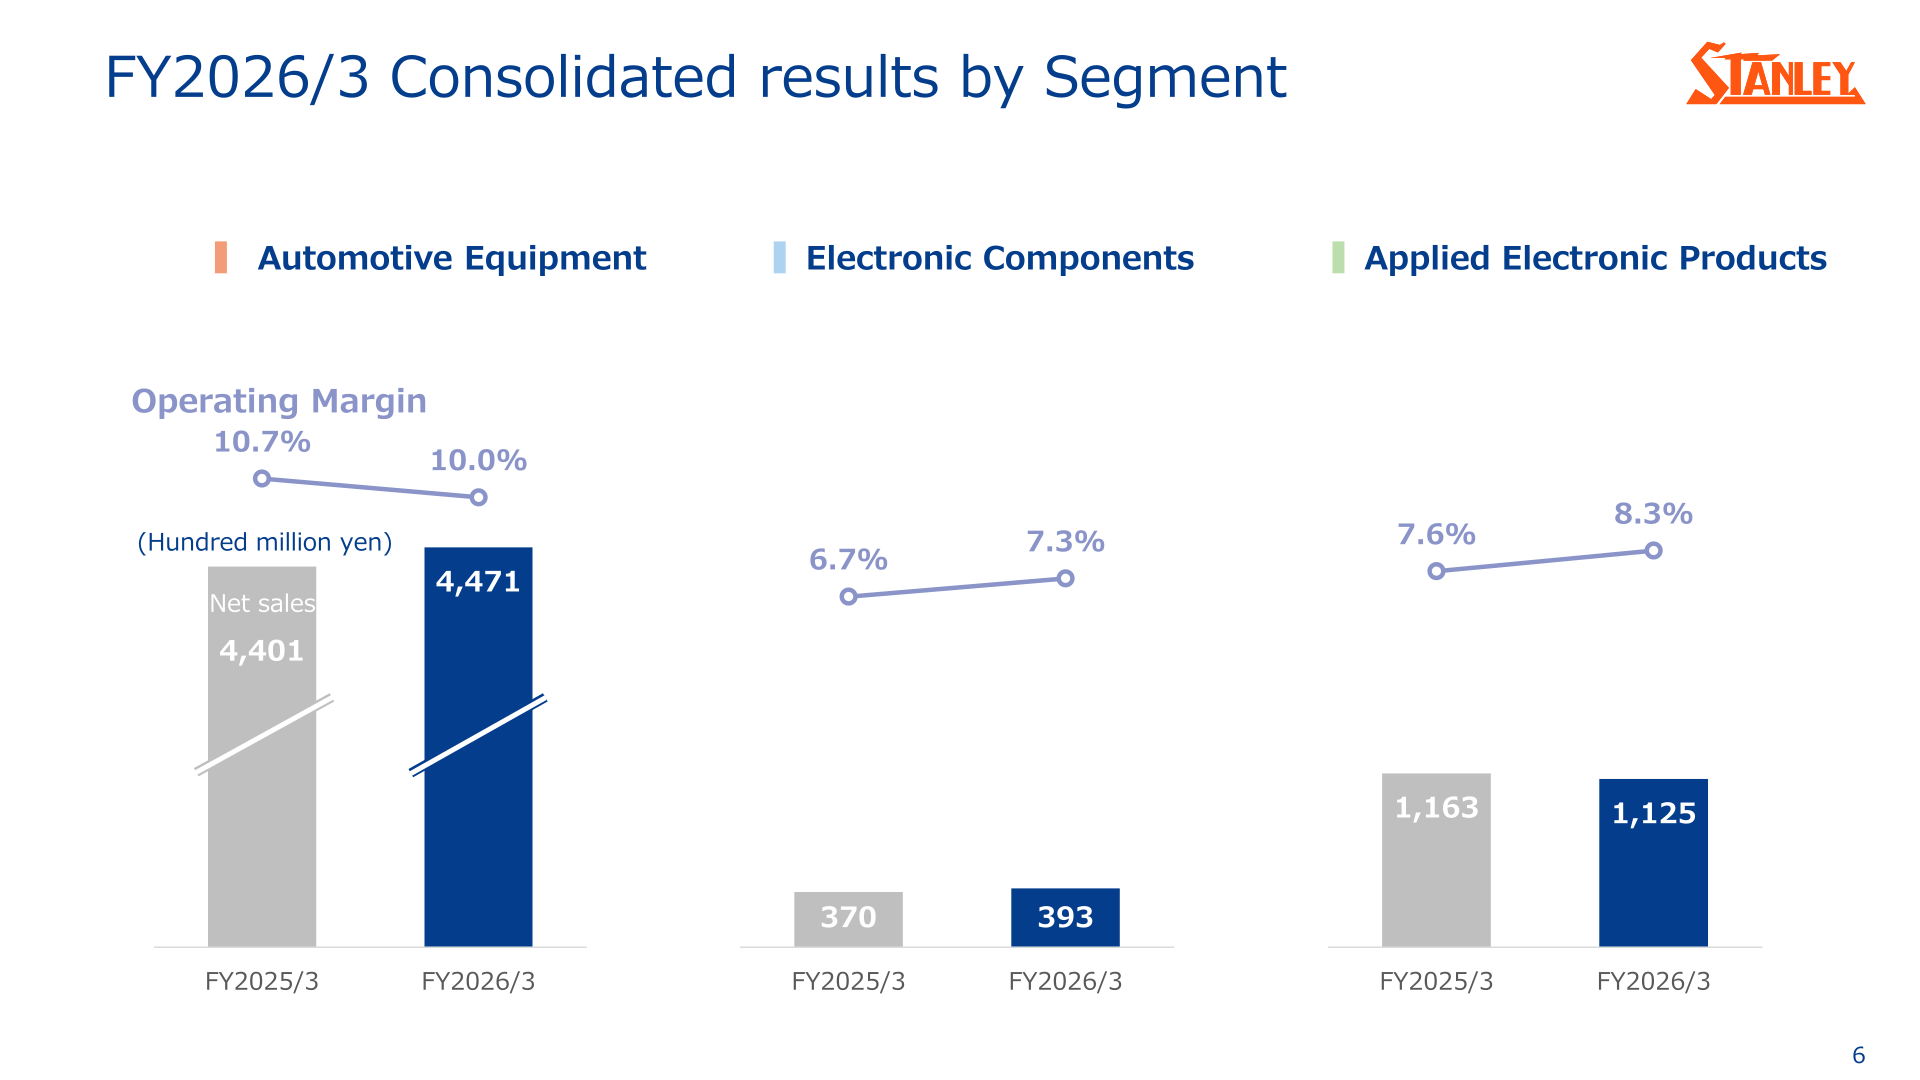
For FY2027/3 the company forecasts net sales of 622.0 billion yen and operating income of 55.0 billion yen. It states that net sales are forecast to increase by 20% year on year mainly due to the impact of newly consolidated companies, and that operating income is forecast to increase by 29% year on year driven by the contribution from Iwasaki Electric, improved material costs, and expense reductions. The newly consolidated companies, both placed in the Applied Electronic Products Business, are Iwasaki Electric and Stanley Mobility Electric.
| Item | FY2027/3 (Forecast) | FY2026/3 (Results) | Year-on-Year |
|---|---|---|---|
| Net sales (Hundred million yen) | 6,220 | 5,184 | 1,035 / 20.0% |
| Operating income (Hundred million yen) | 550 | 426 | 123 / 28.9% |
| Operating income to net sales ratio | 8.8% | 8.2% | 0.6pt |
| Ordinary income (Hundred million yen) | 580 | 508 | 71 / 14.1% |
| Net income attributable to owners of parent (Hundred million yen) | 340 | 328 | 11 / 3.6% |
| ROE | 7.7% | 7.0% | 0.7pt |
| Equity ratio | 50.0% | 56.1% | (6.1pt) |
| Free cash flow (Hundred million yen) | (670) | 294 | (964) |
| Net income per share (yen) | 276.62 | 240.51 | 36.11 / 15.0% |
| Exchange rate (USD/JPY) | 150.00 | 151.14 | (1.14) / (0.8%) |
By segment, the company plans FY2027/3 net sales of 4,477 hundred million yen for the Automotive Equipment Business (+0.1%), 447 hundred million yen for the Electronic Components Business (+13.7%) and 2,295 hundred million yen for the Applied Electronic Products Business (+103.9%), the last including the newly consolidated companies; excluding them, the Applied Electronic Products Business is 1,130 hundred million yen and the consolidated total is 5,276 hundred million yen against 6,220 hundred million yen including them. On the operating income bridge for FY2027/3, growth effects total +282 hundred million yen against decrease effects of -158 hundred million yen. On the external sales assumptions, automobiles rise to 3,567 hundred million yen from 3,503 hundred million yen (+2%) while motorcycles fall to 910 hundred million yen from 949 hundred million yen (-4%), and external sales to non-Japanese OEMs rise to 106 hundred million yen from 81 hundred million yen (+31%).
Shareholder Returns
The dividend policy is the higher of DOE 3.5% or a dividend payout ratio of 40%, with purchases of treasury stock implemented flexibly and continuously. The cash dividend per share for FY2026/3 was 104 yen, up from 72 yen for FY2025/3, and the company plans 111 yen for FY2027/3.
| Item | FY2025/3 | FY2026/3 | FY2027/3 (Forecast) |
|---|---|---|---|
| Interim dividend per share (yen) | 32 | 49 | 55 |
| Year-end dividend per share (yen) | 40 | 55 | 56 |
| Full-year dividend per share (yen) | 72 | 104 | 111 |
| Dividend policy | Higher of DOE 3.5% or dividend payout ratio of 40% | Higher of DOE 3.5% or dividend payout ratio of 40% | Higher of DOE 3.5% or dividend payout ratio of 40% |
On capital allocation, FY2026/3 operating cash flow before R&D was 627 hundred million yen (operating cash flow of 783 hundred million yen plus R&D expenses of 262 hundred million yen less depreciation of 418 hundred million yen). Capital investments were 603 hundred million yen, of which strategic investments were 235 hundred million yen and general investments 368 hundred million yen, and R&D expenses of 262 hundred million yen were equivalent to 5.1% of net sales. For FY2027/3 the company plans capital investments of 650 hundred million yen (strategic investments 401 hundred million yen and general investments 249 hundred million yen), R&D expenses of 326 hundred million yen (5.2% of net sales) and depreciation of 474 hundred million yen, alongside the completed acquisition of Iwasaki Electric shares for 770 hundred million yen.
Medium-Term Management Plan
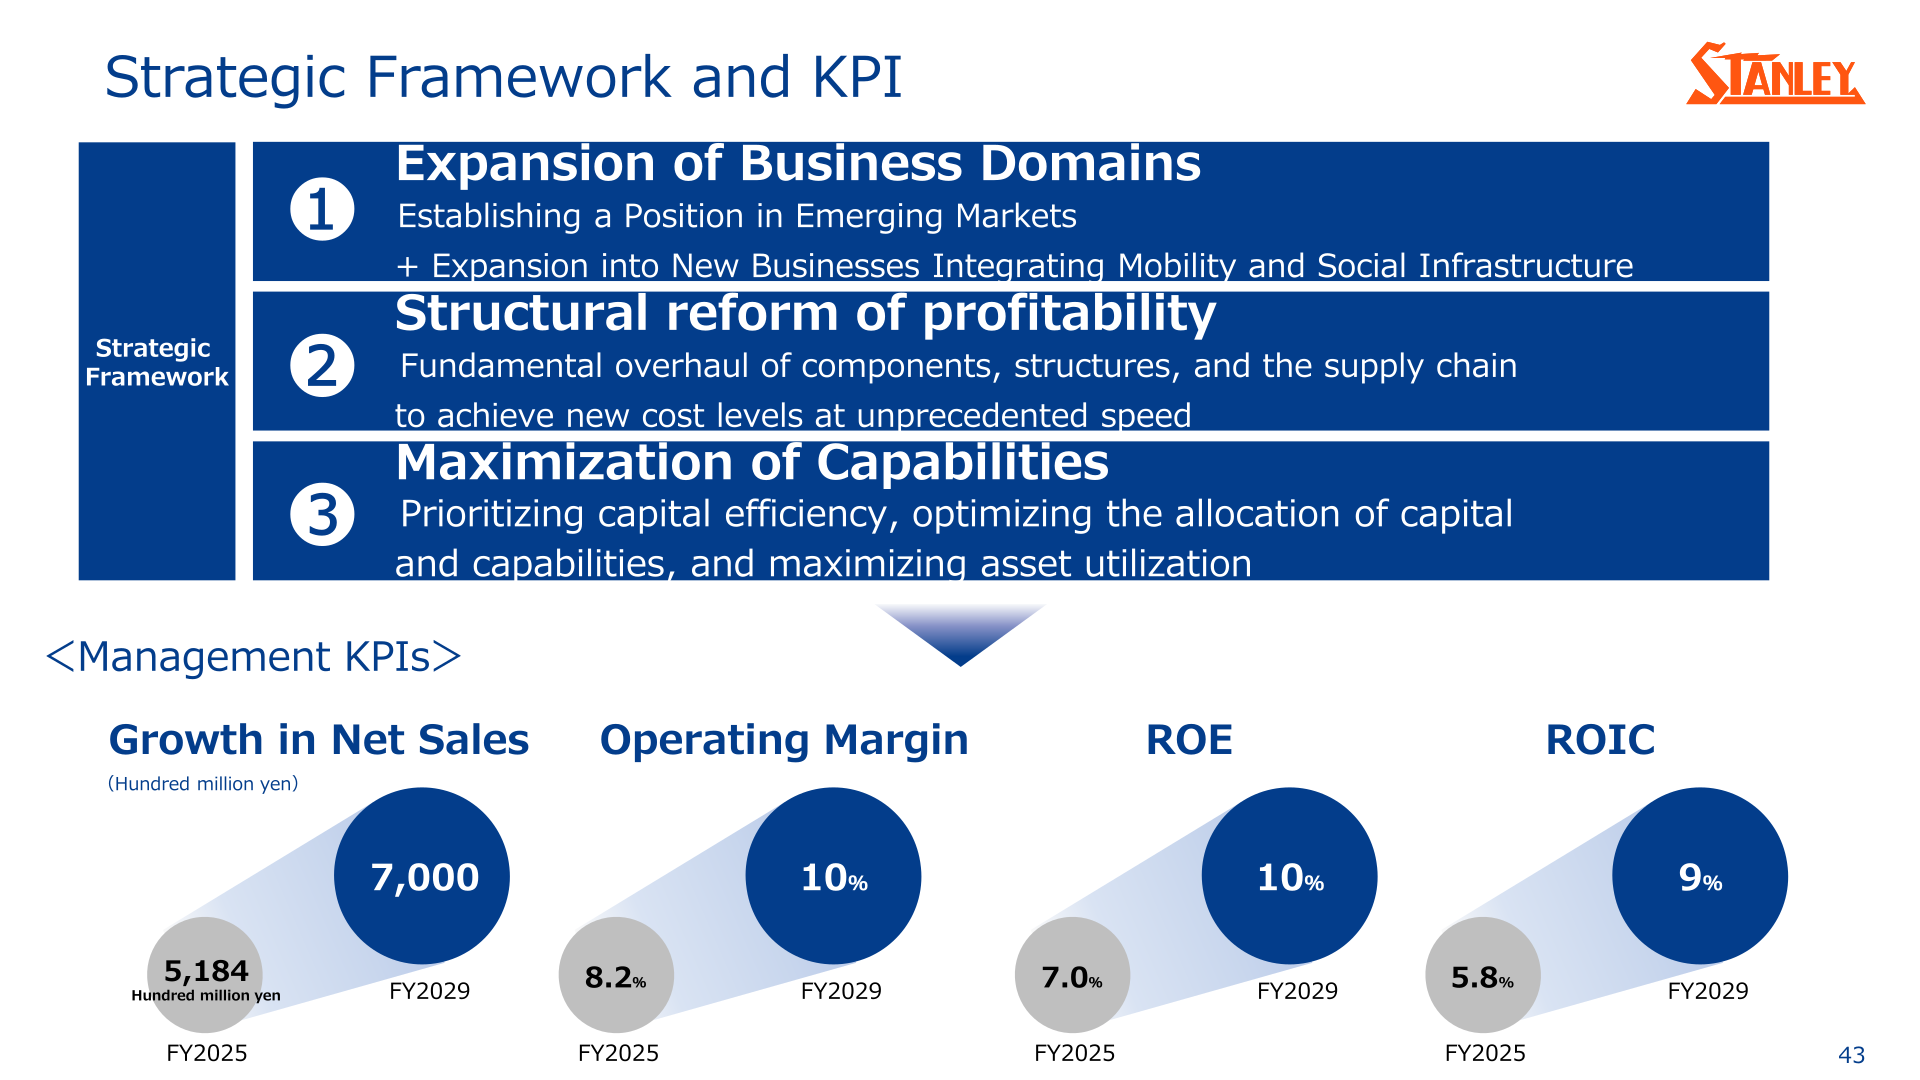
Stanley Electric presented its 9th Mid-Term Management Plan covering FY2026 to FY2029, described as four years of committed structural reform. The key messages are that the company will transform its business and earnings structure to become a company with global competitive advantage and, as a result, aims to achieve a stable ROE of 10% or higher. The strategic framework has three pillars: expansion of business domains, structural reform of profitability, and maximization of capabilities.
| Management KPI | FY2025 | FY2029 |
|---|---|---|
| Net sales (Hundred million yen) | 5,184 | 7,000 |
| Operating margin | 8.2% | 10% |
| ROE | 7.0% | 10% |
| ROIC | 5.8% | 9% |
The sales target implies a CAGR of +7.8% over the four years from FY2025 to FY2029, with the business portfolio shifting from 8.6 : 1.4 to 7 : 3 between the automotive business and the electronics business. For the four-year period from the fiscal year ending March 2027 to the fiscal year ending March 2030, the company plans operating cash flow before deduction of R&D expenses of 3,300 to 3,400 hundred million yen, growth investment of 2,900 to 3,100 hundred million yen, research and development of 1,300 to 1,500 hundred million yen and dividends plus purchases of treasury stock of 1,500 to 1,700 hundred million yen, with depreciation and amortization of 2,000 to 2,100 hundred million yen. Planned investment in risk management initiatives is 60 to 75 hundred million yen.
On business strategy, the company cites a full-scale entry into ADAS systems through the launch of Stanley Mobility Electric, expansion of orders from non-Japanese OEMs, and business expansion into social infrastructure through the acquisition of Iwasaki Electric. It discloses an ADB adoption rate of 10% in FY2026/3 against 9% in FY2025/3, with 11% forecast for FY2027/3, and states that 12 new non-Japanese OEMs were developed over the three years of the 8th Mid-term Management Plan (FY2023-FY2025).
This article is an analysis based on publicly available information and is not a recommendation to buy or sell any specific securities. Investment decisions are your own responsibility.
![[Obayashi] Investors’ Guide 2026 — The Complete 24-Article Breakdown](https://japan-equity.com/wp-content/uploads/2026/07/hub_cover-1024x1024.png)
![[Obayashi] IR & SR Policy — Feeding Dialogue Back into Management](https://japan-equity.com/wp-content/uploads/2026/07/p32_sq-1024x1024.jpg)
![[Obayashi] Real Estate Development — 18.7% Margin, ¥287.7bn Unrealized Gains](https://japan-equity.com/wp-content/uploads/2026/07/p20_sq-1024x1024.jpg)
![[Obayashi] Domestic Civil Engineering — Resilience Spending Supports 9.6% Margin](https://japan-equity.com/wp-content/uploads/2026/07/p11_sq-1024x1024.jpg)
![[Obayashi] Share Price & External Ratings — vs TOPIX, ESG Index Inclusion](https://japan-equity.com/wp-content/uploads/2026/07/p40_sq-1024x1024.jpg)
![[Construction] ¥75.5tn Investment, Shrinking Workforce — Big-5 Market Share](https://japan-equity.com/wp-content/uploads/2026/07/p12_sq-1024x1024.jpg)



![[Obayashi] Capital Policy & Shareholder Returns — ROE 10%+, DOE ~5%, ¥100bn Buyback](https://japan-equity.com/wp-content/uploads/2026/07/p27_sq-1024x1024.jpg)
![[Obayashi] Reducing Cross-Shareholdings — ¥285.2bn Sold in Five Years](https://japan-equity.com/wp-content/uploads/2026/07/p29_sq-1024x1024.jpg)
![[Obayashi] ¥750bn Investment Plan — ¥300bn to Development, ¥190bn to Tech/DX](https://japan-equity.com/wp-content/uploads/2026/07/p30_sq-1024x1024.jpg)
![[Obayashi] MTP2022 KPIs — Operating Profit ~2x Target, ROE 14.4%](https://japan-equity.com/wp-content/uploads/2026/07/p25_sq-1024x1024.jpg)
![[Obayashi] Cash Allocation — ¥420bn Investment CF Over Five Years](https://japan-equity.com/wp-content/uploads/2026/07/p26_sq-1024x1024.jpg)
![[Obayashi] Green Energy — 44 Plants, 344MW, and the Green Hydrogen Challenge](https://japan-equity.com/wp-content/uploads/2026/07/p21_sq-1024x1024.jpg)
![[Obayashi] Tackling the Labor Shortage — Robotics Construction®](https://japan-equity.com/wp-content/uploads/2026/07/p14_sq-1024x1024.jpg)
