
This article is based on publicly available IR materials and is not a recommendation to buy or sell any specific securities.
Note: OBIC’s materials refer to the fiscal year ended March 31, 2026 as “FY March 2026”; this site classifies the most recent completed fiscal year as FY2025, and labels in the body and tables below follow the company’s materials. OBIC Co., Ltd. (4684), a provider of enterprise systems centered on its OBIC7 series, achieved double-digit growth across all profit metrics in FY March 2026, setting new record highs. Net sales reached 135,209 million yen (111.5% of the prior year) and operating income reached 88,823 million yen (113.3%), while basic earnings per share grew to 171.61 yen, 116.8% of the previous period.
Consolidated Results (FY March 2026 Actual)
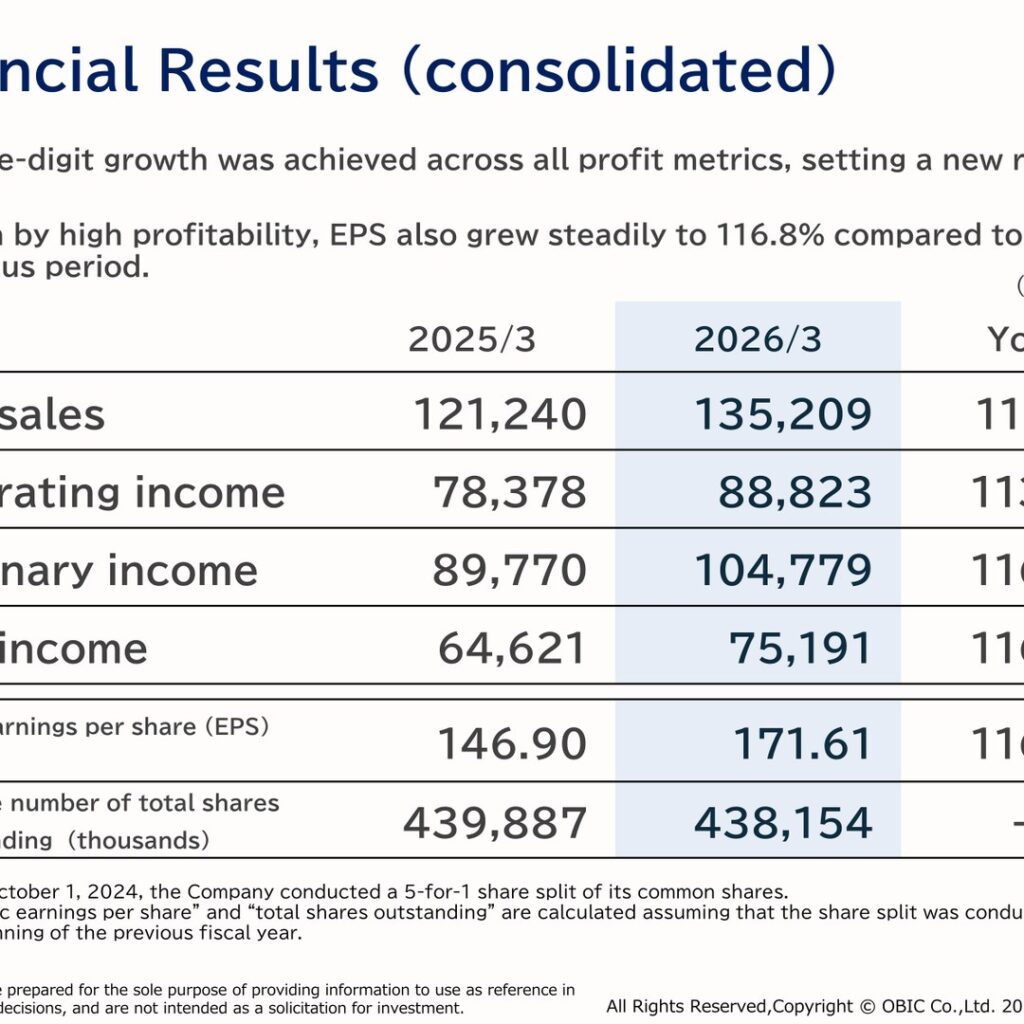
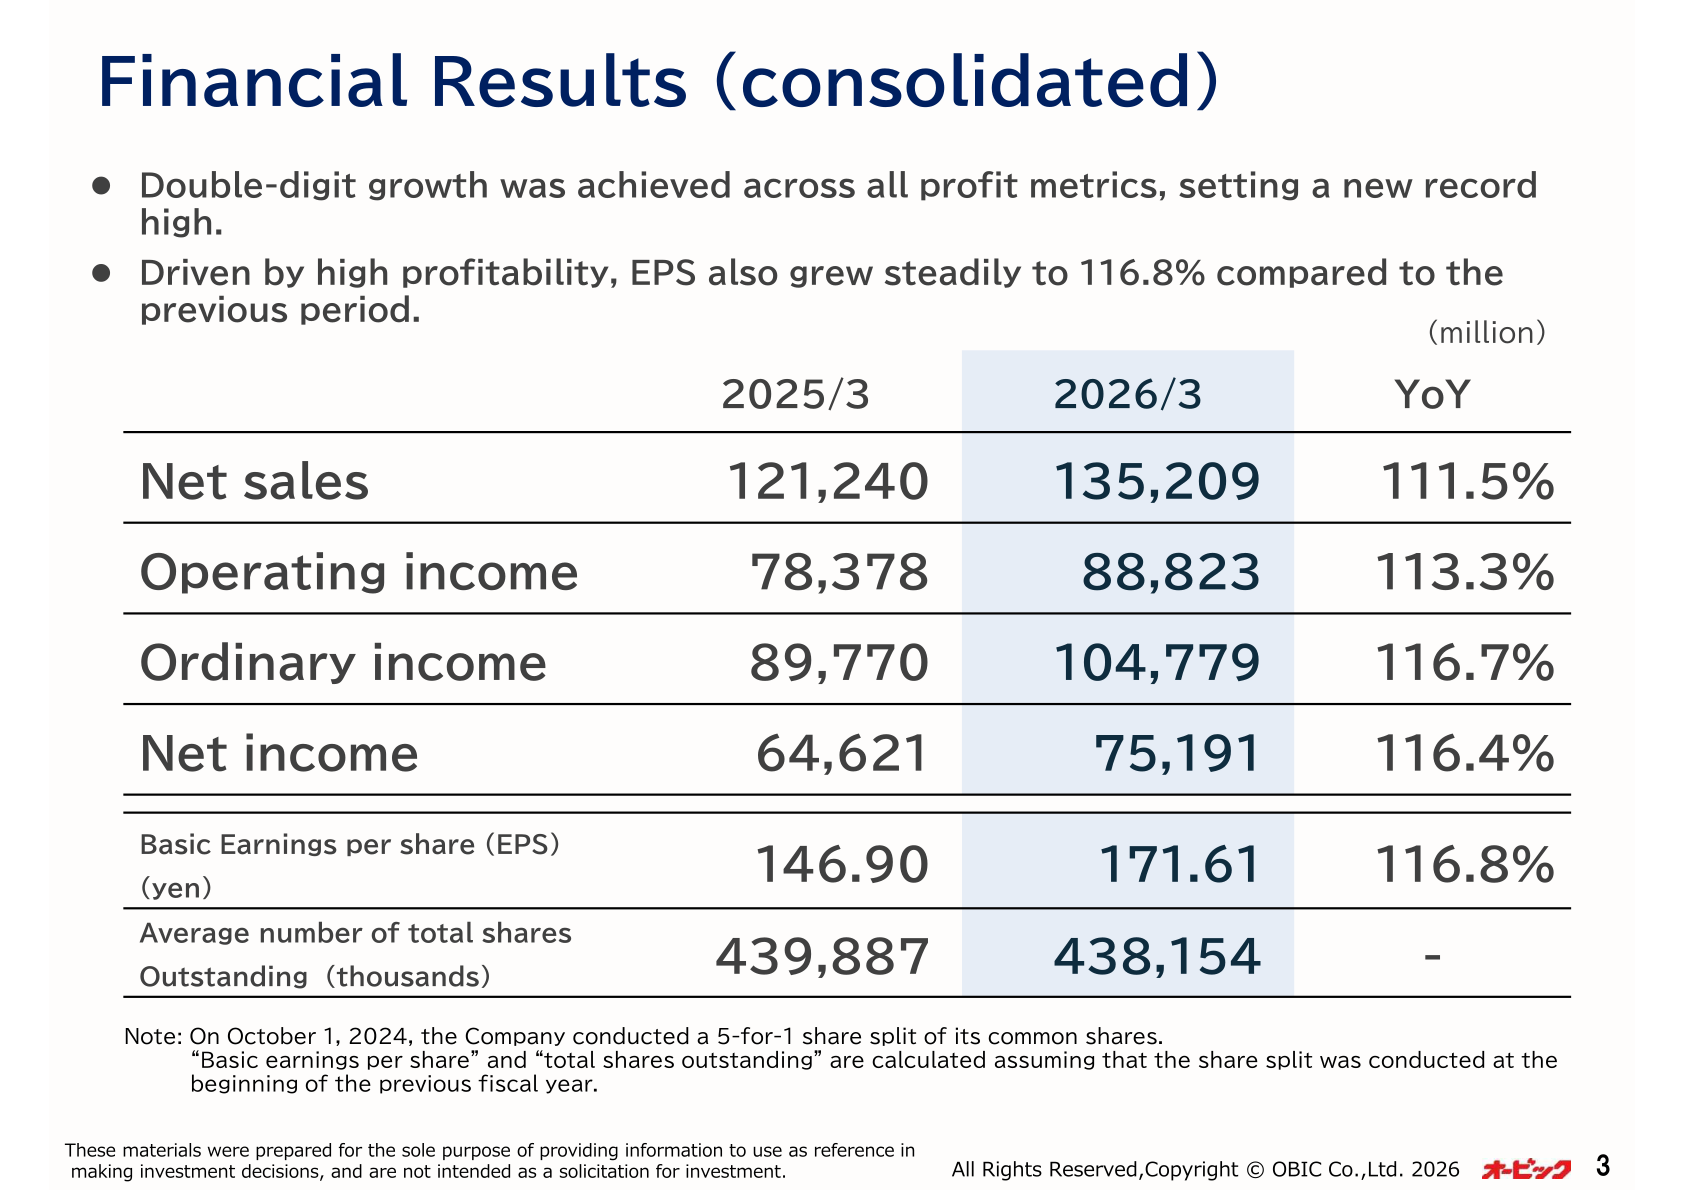
Net sales were 135,209 million yen (YoY 111.5%), operating income 88,823 million yen (113.3%), ordinary income 104,779 million yen (116.7%), and net income 75,191 million yen (116.4%). Operating income achieved 32 consecutive periods of growth, and the operating margin reached a new record high of 65.7%, up from 64.6% in the prior year. Margins improved across all profit metrics: the ordinary margin rose to 77.5% (from 74.0%) and the net margin to 55.6% (from 53.3%). The company notes that on October 1, 2024 it conducted a 5-for-1 share split, and EPS and total shares outstanding are calculated assuming the split was conducted at the beginning of the previous fiscal year.
| Item (million yen) | 2026/3 | 2025/3 | YoY |
|---|---|---|---|
| Net sales | 135,209 | 121,240 | 111.5% |
| Operating income | 88,823 | 78,378 | 113.3% |
| Ordinary income | 104,779 | 89,770 | 116.7% |
| Net income | 75,191 | 64,621 | 116.4% |
| Basic earnings per share (yen) | 171.61 | 146.90 | 116.8% |
Capital efficiency also improved: ROE was 15.8% and ROIC rose to 16.8% in 2026/3 (ROIC = operating income after taxes divided by shareholders’ equity plus interest-bearing debt). On the cash flow side, cash flows from operating activities were +73,746 million yen, cash flows from investing activities were -2,022 million yen, and cash flows from financing activities were -64,404 million yen (including dividends paid of -32,992 million yen and purchases of treasury shares of -31,411 million yen), leaving an end-of-period balance of 207,385 million yen.
Segment Results
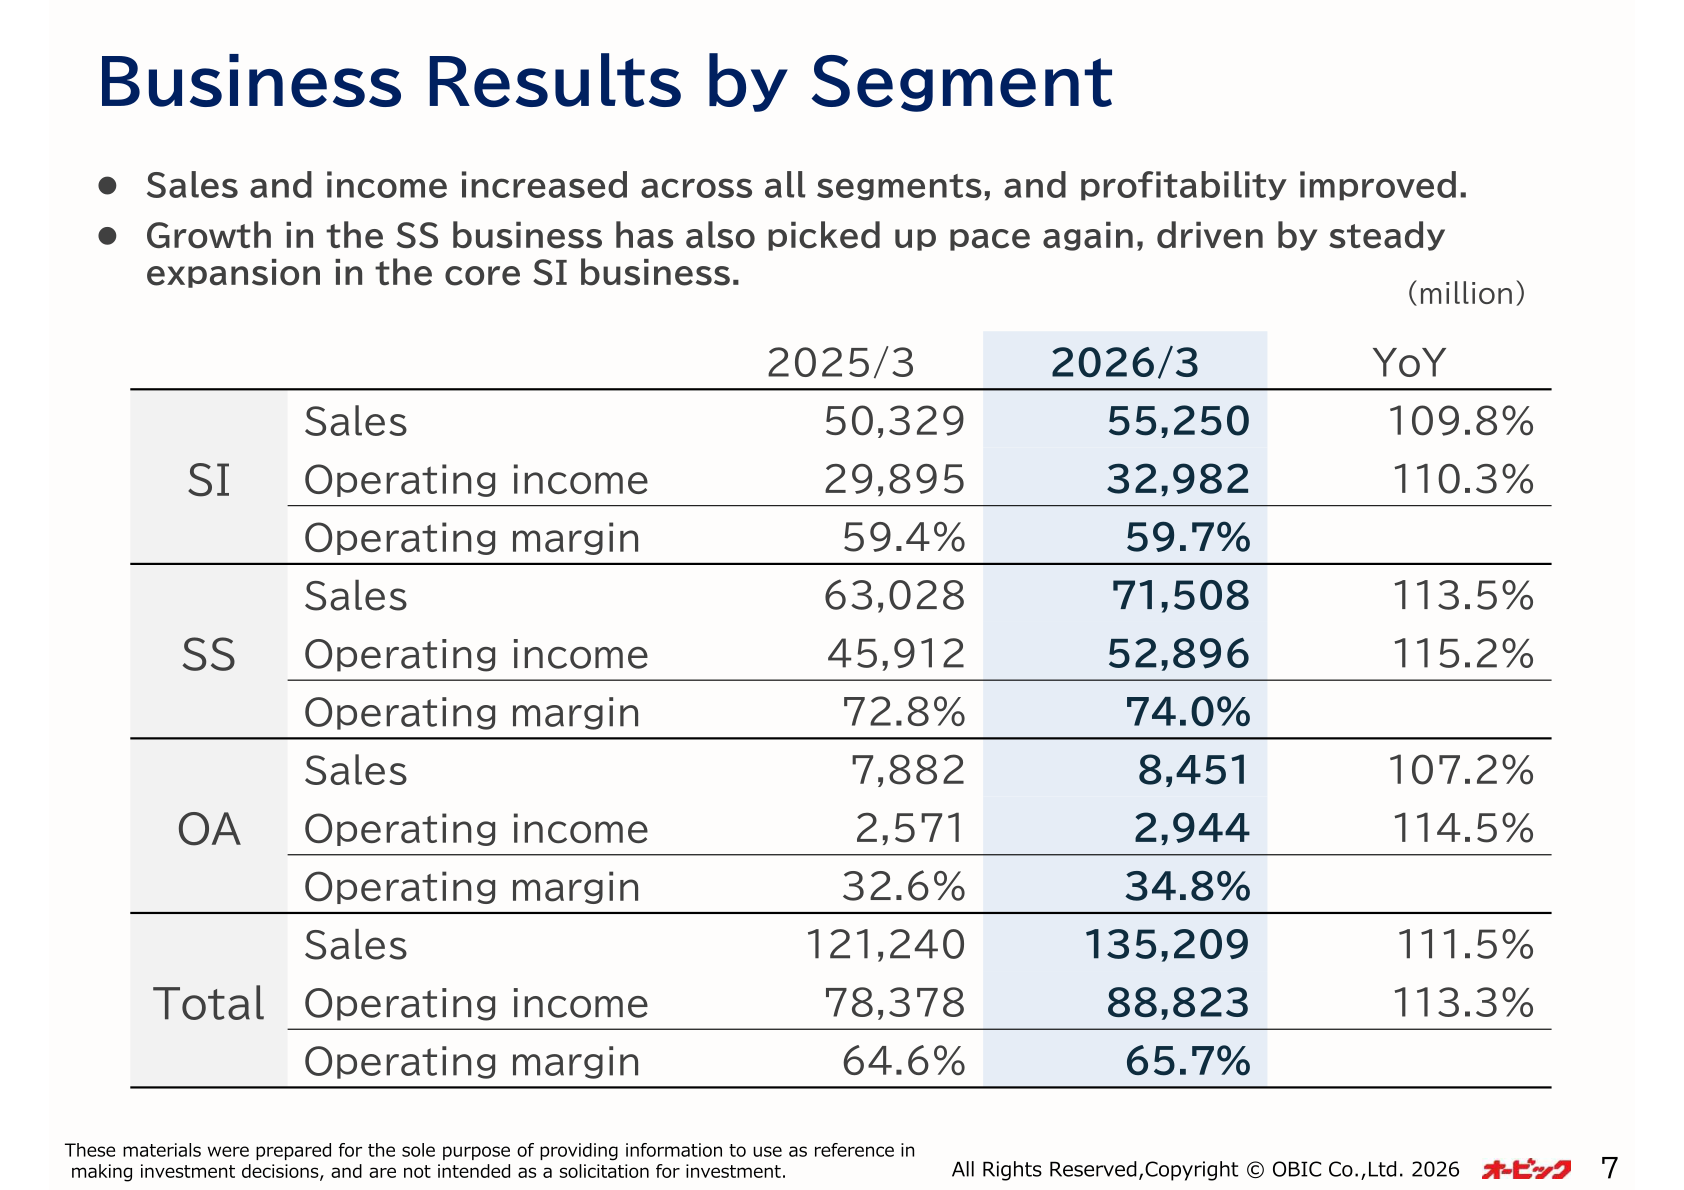
Sales and income increased across all segments, and profitability improved. Growth in the SS (system support) business picked up pace again, driven by steady expansion in the core SI (system integration) business. The SS segment’s operating margin rose to 74.0% (from 72.8%), while the SI segment’s margin edged up to 59.7% (from 59.4%) and the OA segment’s margin improved to 34.8% (from 32.6%).
| Segment | Metric (million yen) | 2026/3 | 2025/3 | YoY |
|---|---|---|---|---|
| SI | Sales | 55,250 | 50,329 | 109.8% |
| SI | Operating income | 32,982 | 29,895 | 110.3% |
| SS | Sales | 71,508 | 63,028 | 113.5% |
| SS | Operating income | 52,896 | 45,912 | 115.2% |
| OA | Sales | 8,451 | 7,882 | 107.2% |
| OA | Operating income | 2,944 | 2,571 | 114.5% |
| Total | Sales | 135,209 | 121,240 | 111.5% |
| Total | Operating income | 88,823 | 78,378 | 113.3% |
Consolidated segment orders received remained strong across all segments, achieving double-digit growth overall at 144,570 million yen in 2026/3 versus 129,427 million yen in 2025/3 (total YoY 111.7%; SI 109.0%, SS 114.7%, OA 102.0%). By customer profile within system integration sales, inquiries increased from major enterprises with annual sales exceeding 100 billion yen — customers with 100 billion yen or more in annual sales accounted for 29% of the composition (+2pt YoY) — and the portfolio remains well balanced with no heavy concentration in any specific industry (manufacturing 31%, services 26%, distribution 24%, finance 18%, other 1%).
FY March 2027 Forecast
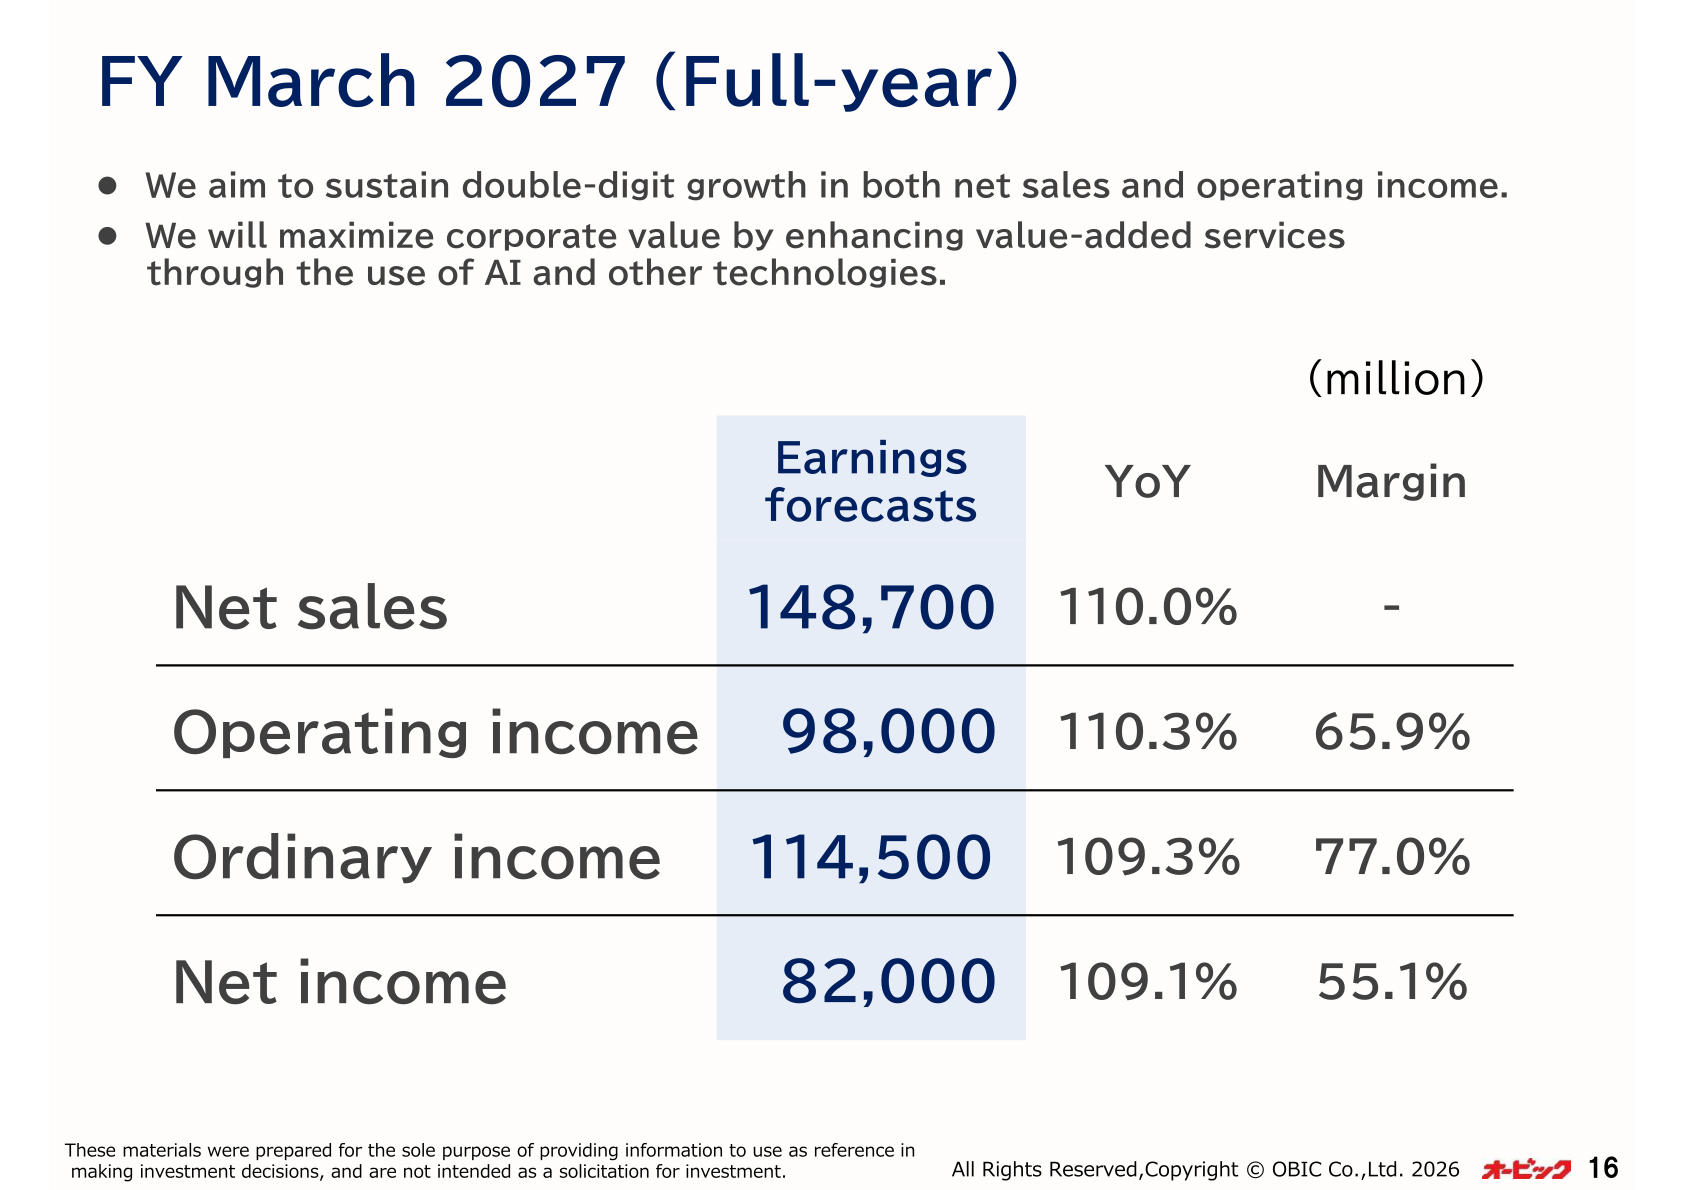
For the fiscal year ending March 2027, the company aims to sustain double-digit growth in both net sales and operating income, and states it will maximize corporate value by enhancing value-added services through the use of AI and other technologies.
| Item (million yen) | FY March 2027 Forecast | YoY | Margin |
|---|---|---|---|
| Net sales | 148,700 | 110.0% | – |
| Operating income | 98,000 | 110.3% | 65.9% |
| Ordinary income | 114,500 | 109.3% | 77.0% |
| Net income | 82,000 | 109.1% | 55.1% |
Shareholder Returns
The annual dividend for FY March 2026 was 84 yen per share (interim 37 yen, year-end 47 yen), with a consolidated dividend payout ratio of 48.9%. Over the past 10 years the DOE (dividend on equity ratio) has risen by 3.0 points to 7.7%, and the company states it remains committed to delivering long-term, stable, and consistent shareholder returns. For the fiscal year ending March 2027, the company plans an annual dividend of 94 yen (interim 47 yen, year-end 47 yen), for a consolidated dividend payout ratio of 49.7%. Note: dividend amounts are calculated assuming the 5-for-1 share split of October 1, 2024 was conducted at the beginning of each fiscal year shown.
| Fiscal year | Annual dividend (yen) | Consolidated dividend payout ratio |
|---|---|---|
| 2023/3 | 50 | 44.2% |
| 2024/3 | 60 | 45.8% |
| 2025/3 | 70 | 47.7% |
| 2026/3 | 84 | 48.9% |
| 2027/3 (Forecast) | 94 | 49.7% |
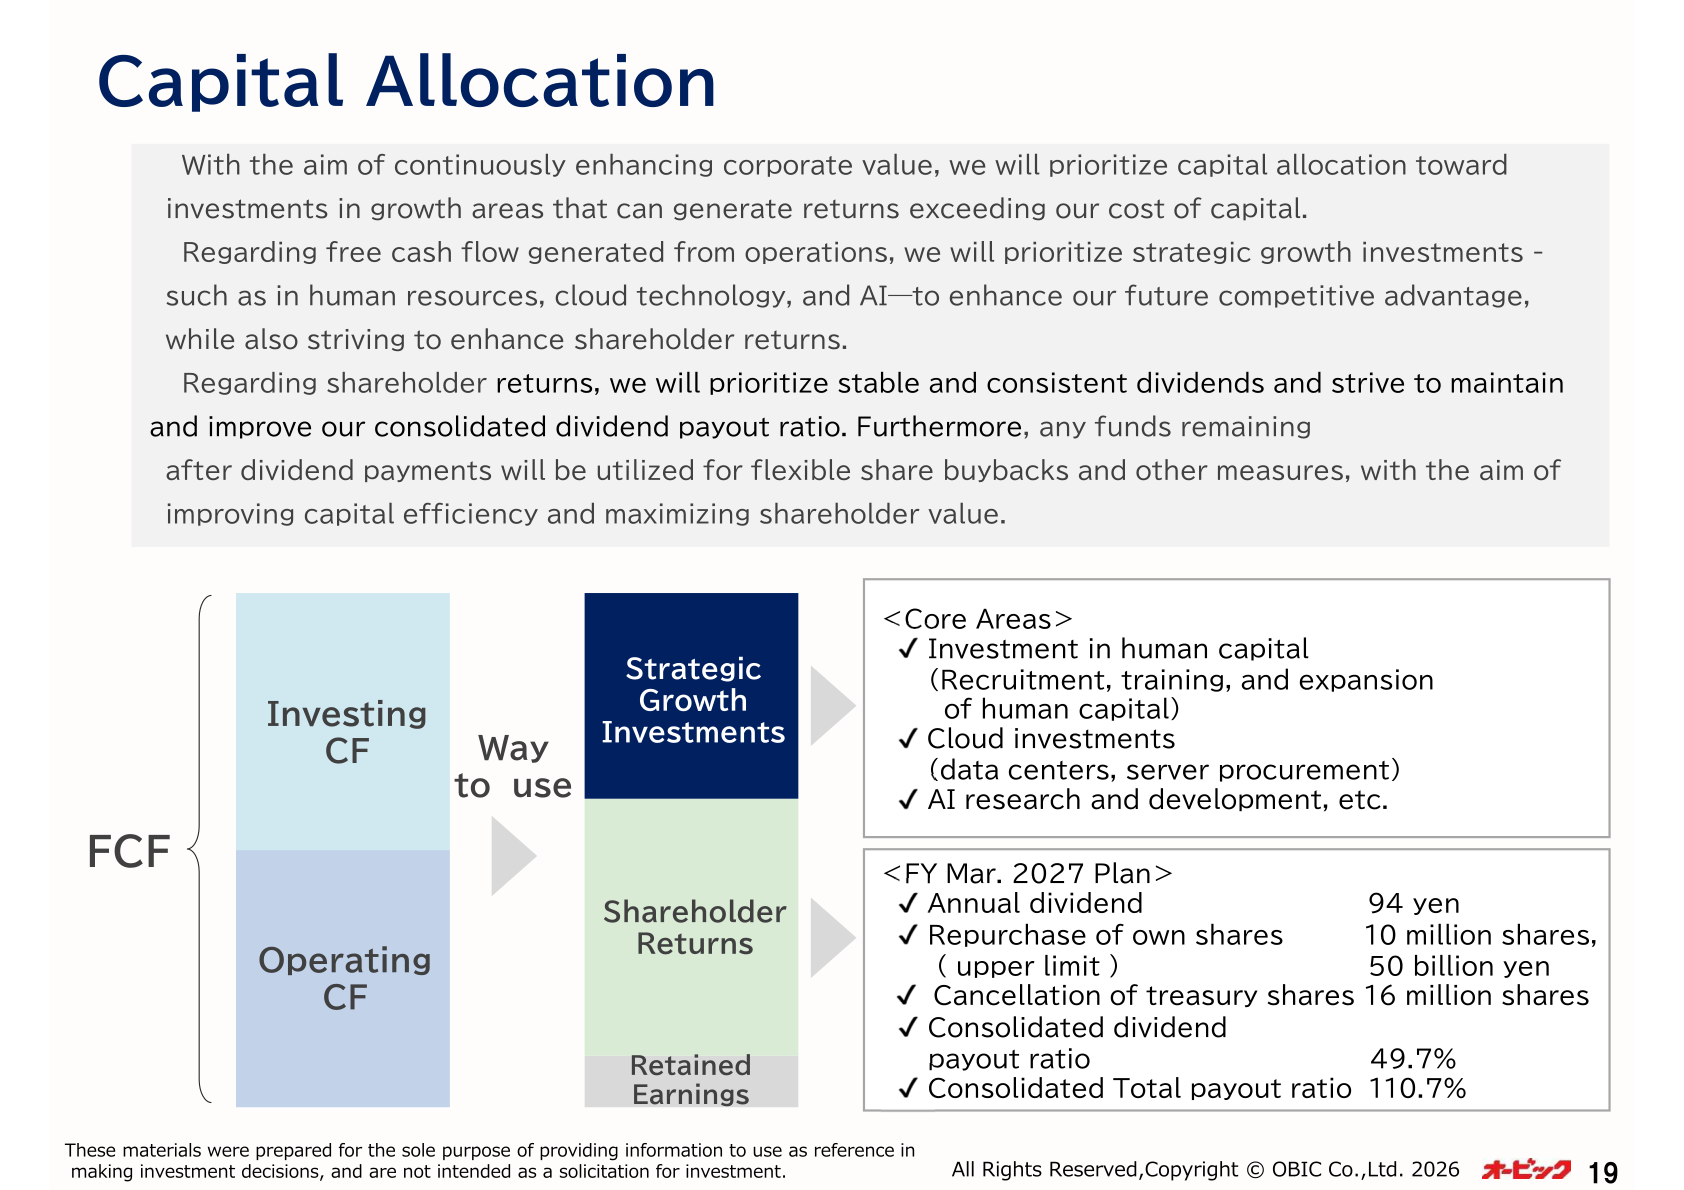
Under its capital allocation policy, OBIC prioritizes strategic growth investments — in human capital, cloud (data centers and server procurement), and AI research and development — funded by free cash flow, while also striving to enhance shareholder returns. The FY March 2027 plan comprises an annual dividend of 94 yen, repurchase of own shares with an upper limit of 10 million shares or 50 billion yen, and cancellation of 16 million treasury shares, for a consolidated dividend payout ratio of 49.7% and a consolidated total payout ratio of 110.7%.
Recent Initiatives — AI and Intellectual Property
OBIC is building a portfolio of AI-related patents that help solve customers’ business challenges: cumulative patent applications reached 2,428 and registrations 1,231 as of 2026/3. The company is utilizing AI thoroughly in-house across marketing, sales, product development, and customer support, and provides AI solutions to client companies, including business analytics AI, decision support AI, input assistance AI, and log analysis AI. Management states that the rise of AI technology is not a threat but an opportunity for further growth, and that thorough internal implementation will elevate its use of AI into a unique competitive advantage.
This article is an analysis based on publicly available information and is not a recommendation to buy or sell any specific securities. Investment decisions are your own responsibility.
![[Obayashi] Investors’ Guide 2026 — The Complete 24-Article Breakdown](https://japan-equity.com/wp-content/uploads/2026/07/hub_cover-1024x1024.png)
![[Obayashi] IR & SR Policy — Feeding Dialogue Back into Management](https://japan-equity.com/wp-content/uploads/2026/07/p32_sq-1024x1024.jpg)
![[Obayashi] Real Estate Development — 18.7% Margin, ¥287.7bn Unrealized Gains](https://japan-equity.com/wp-content/uploads/2026/07/p20_sq-1024x1024.jpg)
![[Obayashi] Domestic Civil Engineering — Resilience Spending Supports 9.6% Margin](https://japan-equity.com/wp-content/uploads/2026/07/p11_sq-1024x1024.jpg)
![[Obayashi] Share Price & External Ratings — vs TOPIX, ESG Index Inclusion](https://japan-equity.com/wp-content/uploads/2026/07/p40_sq-1024x1024.jpg)
![[Construction] ¥75.5tn Investment, Shrinking Workforce — Big-5 Market Share](https://japan-equity.com/wp-content/uploads/2026/07/p12_sq-1024x1024.jpg)



![[Obayashi] Capital Policy & Shareholder Returns — ROE 10%+, DOE ~5%, ¥100bn Buyback](https://japan-equity.com/wp-content/uploads/2026/07/p27_sq-1024x1024.jpg)
![[Obayashi] Reducing Cross-Shareholdings — ¥285.2bn Sold in Five Years](https://japan-equity.com/wp-content/uploads/2026/07/p29_sq-1024x1024.jpg)
![[Obayashi] ¥750bn Investment Plan — ¥300bn to Development, ¥190bn to Tech/DX](https://japan-equity.com/wp-content/uploads/2026/07/p30_sq-1024x1024.jpg)
![[Obayashi] MTP2022 KPIs — Operating Profit ~2x Target, ROE 14.4%](https://japan-equity.com/wp-content/uploads/2026/07/p25_sq-1024x1024.jpg)
![[Obayashi] Cash Allocation — ¥420bn Investment CF Over Five Years](https://japan-equity.com/wp-content/uploads/2026/07/p26_sq-1024x1024.jpg)
![[Obayashi] Green Energy — 44 Plants, 344MW, and the Green Hydrogen Challenge](https://japan-equity.com/wp-content/uploads/2026/07/p21_sq-1024x1024.jpg)
![[Obayashi] Tackling the Labor Shortage — Robotics Construction®](https://japan-equity.com/wp-content/uploads/2026/07/p14_sq-1024x1024.jpg)
