
This article is based on publicly available IR materials and is not a recommendation to buy or sell any specific securities.
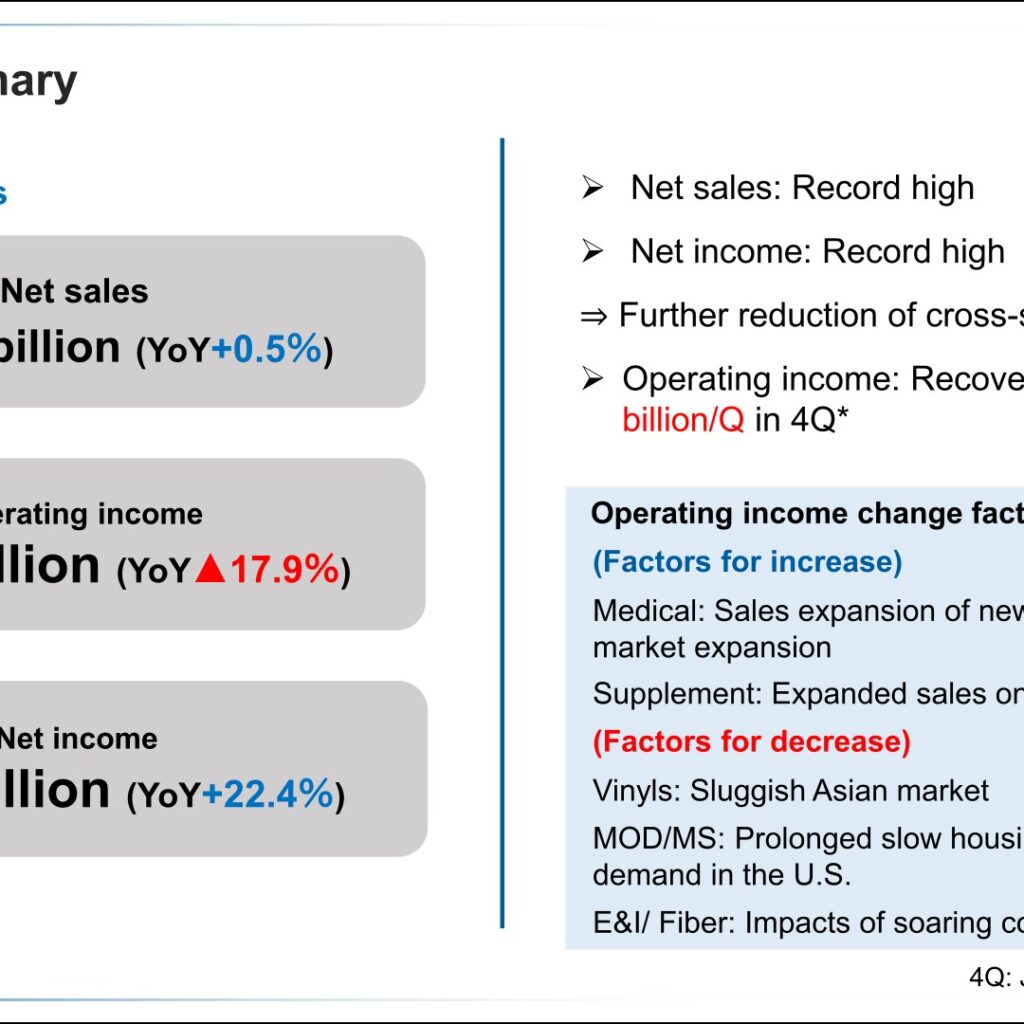
Kaneka Corporation (4118) announced its consolidated financial results for the fiscal year ended March 31, 2026 (FY2025) on May 14, 2026. Net sales rose 0.5% year on year to ¥811.6 billion and net income attributable to owners of the parent increased 22.4% to ¥31.0 billion, both record highs, while operating income declined 17.9% to ¥32.9 billion. The company cited sales expansion of new products and market expansion in Medical and globally expanded sales in Supplement as factors for increase, against a sluggish Asian market in Vinyls, prolonged slow housing and construction demand in the U.S. for MOD/MS, and impacts of soaring raw material costs in E&I/Fiber as factors for decrease. Quarterly operating income recovered to exceed ¥10.0 billion in the fourth quarter (January 1 to March 31, 2026).
Consolidated Results (Full-Year Actual)
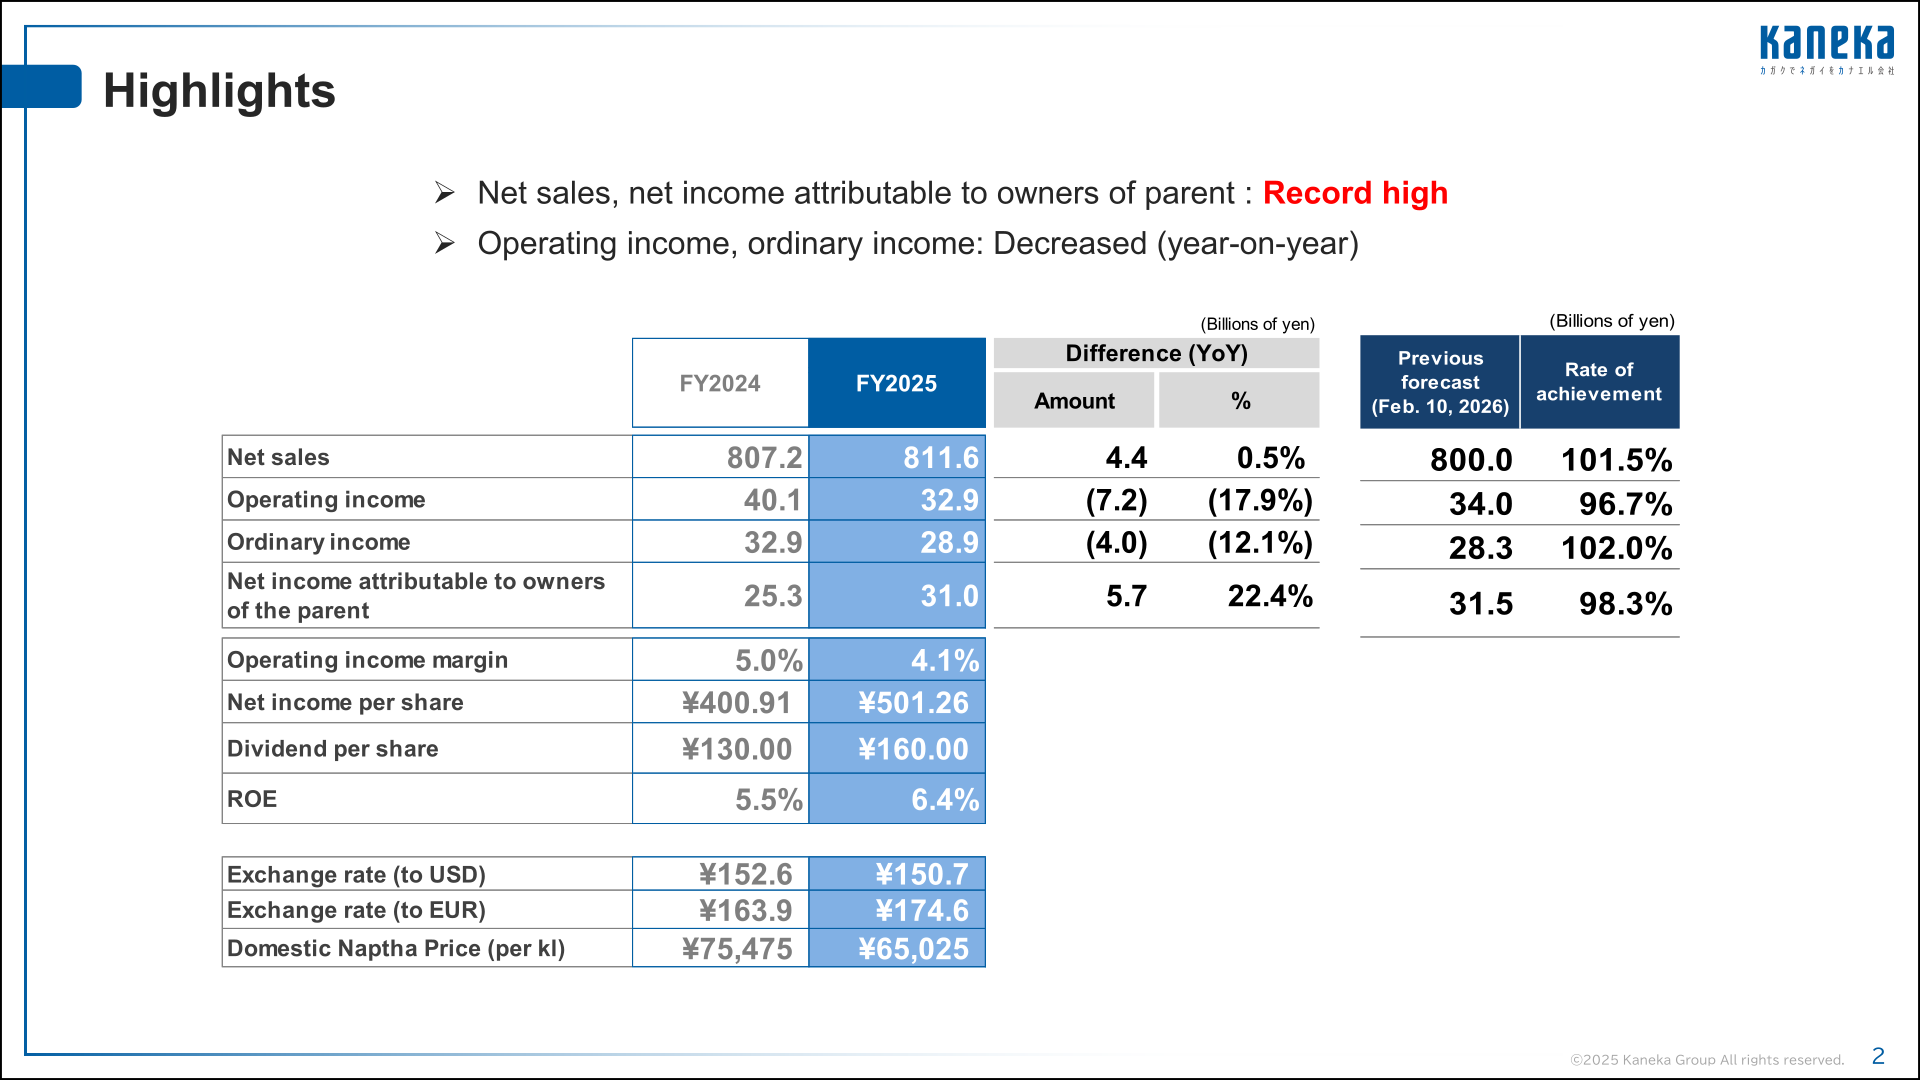
Net sales and net income attributable to owners of the parent reached record highs, while operating income and ordinary income decreased year on year. The operating income margin was 4.1% (5.0% in FY2024) and ROE was 6.4% (5.5% in FY2024). Against the previous forecast announced on February 10, 2026, the rate of achievement was 101.5% for net sales (forecast: ¥800.0 billion), 96.7% for operating income (¥34.0 billion), 102.0% for ordinary income (¥28.3 billion), and 98.3% for net income (¥31.5 billion). Assumed exchange rates for FY2025 were ¥150.7 to the U.S. dollar and ¥174.6 to the euro, with a domestic naphtha price of ¥65,025 per kl.
| Item (Billions of yen) | FY2024 | FY2025 | Difference (YoY) | % |
|---|---|---|---|---|
| Net sales | 807.2 | 811.6 | 4.4 | 0.5% |
| Operating income | 40.1 | 32.9 | (7.2) | (17.9%) |
| Ordinary income | 32.9 | 28.9 | (4.0) | (12.1%) |
| Net income attributable to owners of the parent | 25.3 | 31.0 | 5.7 | 22.4% |
| Operating income margin | 5.0% | 4.1% | – | – |
| Net income per share | ¥400.91 | ¥501.26 | – | – |
| Dividend per share | ¥130.00 | ¥160.00 | – | – |
| ROE | 5.5% | 6.4% | – | – |
Segment Results
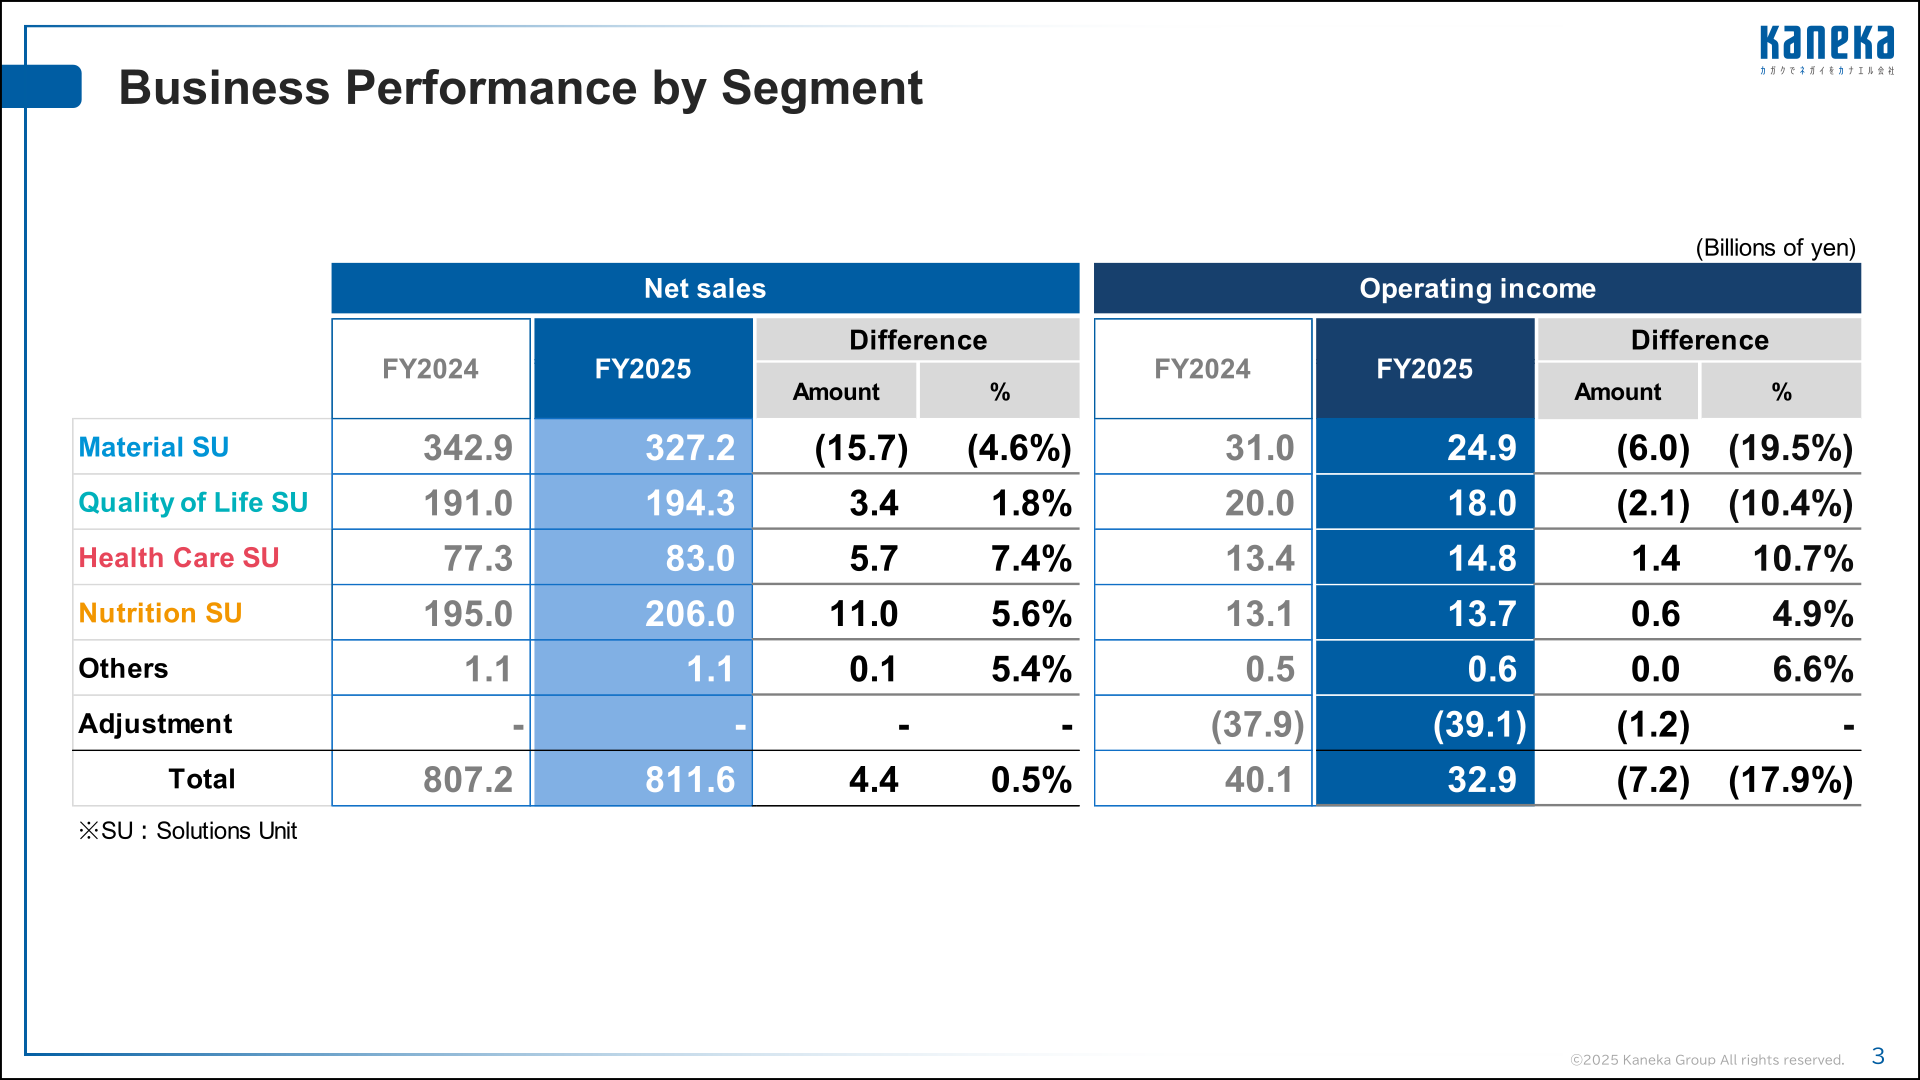
By Solutions Unit (SU): Material SU saw decreased sales and profits on sluggishness in the Asian market for Vinyls and prolonged slow housing and construction demand in the U.S. for MOD and MS. Quality of Life SU posted increased sales and decreased profits, with solid performance in Foam and PV while E&I and Fiber experienced soaring raw material costs. Health Care SU achieved increased sales and profits on dramatic growth of Medical, where both blood purification devices and catheters expanded substantially, making it the largest earning-generating business. Nutrition SU recorded higher sales and profits on strong performance for Supplemental Nutrition — with sales of the active form of coenzyme Q10 expanding in the global market, particularly in the U.S. — and improved profitability of Foods.
| Segment | Net sales FY2024 | Net sales FY2025 | Operating income FY2024 | Operating income FY2025 |
|---|---|---|---|---|
| Material SU | 342.9 | 327.2 | 31.0 | 24.9 |
| Quality of Life SU | 191.0 | 194.3 | 20.0 | 18.0 |
| Health Care SU | 77.3 | 83.0 | 13.4 | 14.8 |
| Nutrition SU | 195.0 | 206.0 | 13.1 | 13.7 |
| Others | 1.1 | 1.1 | 0.5 | 0.6 |
| Adjustment | – | – | (37.9) | (39.1) |
| Total | 807.2 | 811.6 | 40.1 | 32.9 |
FY2026 Forecast
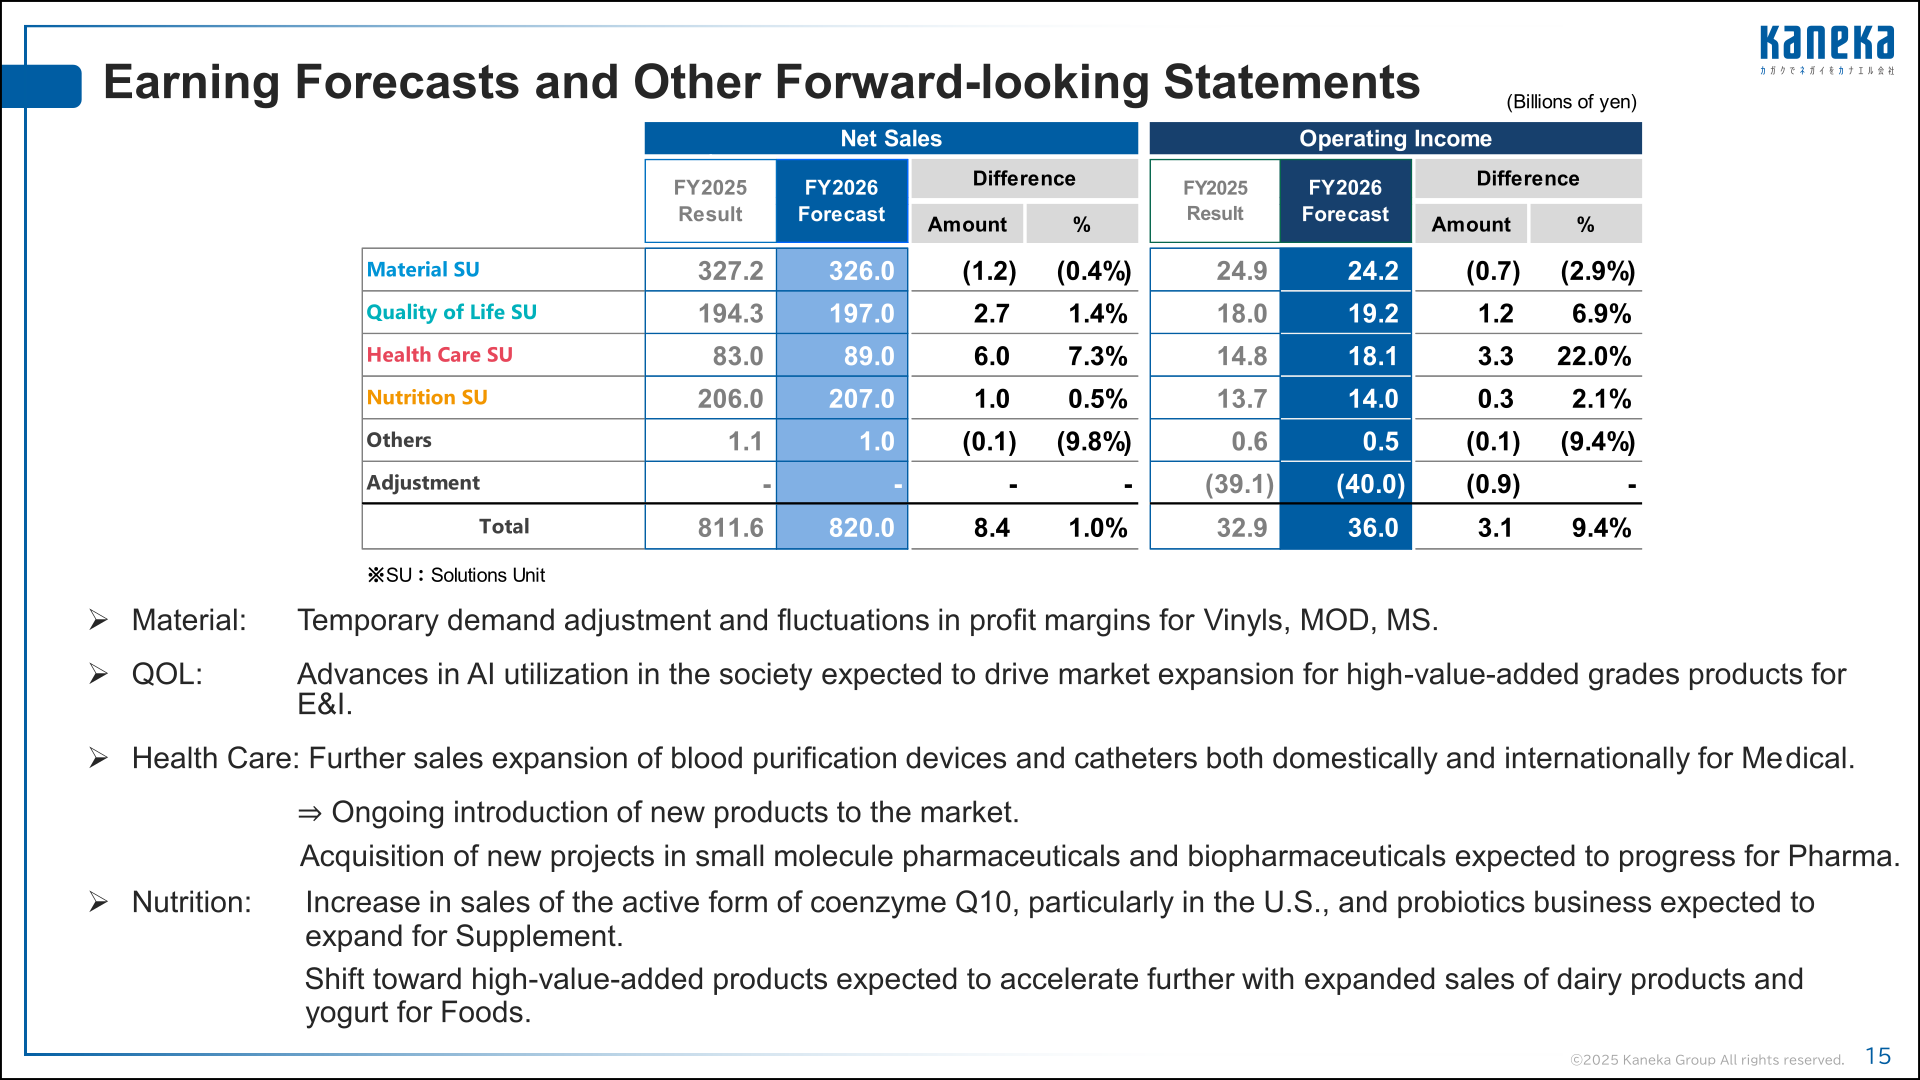
For FY2026, Kaneka forecasts net sales of ¥820.0 billion (up 1.0% year on year), operating income of ¥36.0 billion (up 9.4%), ordinary income of ¥32.0 billion (up 10.8%), and net income attributable to owners of parent of ¥31.5 billion (up 1.7%). The company will actively invest management resources in Life Science and Leading-edge businesses to accelerate business expansion and improvement in profitability. Regarding impacts of the situation in the Middle East, it anticipates temporary adjustments in demand and fluctuation in profit margins, primarily for certain Solutions Vehicles of Material and QoL SU, and states it will closely monitor future developments and promptly revise the plan as necessary. Forecast assumptions are ¥150.0 to the U.S. dollar, ¥170.0 to the euro, and a domestic naphtha price of ¥120,000 per kl.
| Item (Billions of yen) | FY2025 Result | FY2026 Forecast | Difference | % |
|---|---|---|---|---|
| Net sales | 811.6 | 820.0 | 8.4 | 1.0% |
| Operating income | 32.9 | 36.0 | 3.1 | 9.4% |
| Ordinary income | 28.9 | 32.0 | 3.1 | 10.8% |
| Net income attributable to owners of parent | 31.0 | 31.5 | 0.5 | 1.7% |
| Operating income margin | 4.1% | 4.4% | – | – |
| Net income per share | ¥501.26 | ¥523.04 | – | – |
| Dividend per share | ¥160.00 | ¥210.00 | – | – |
| ROE | 6.4% | 6.2% | – | – |
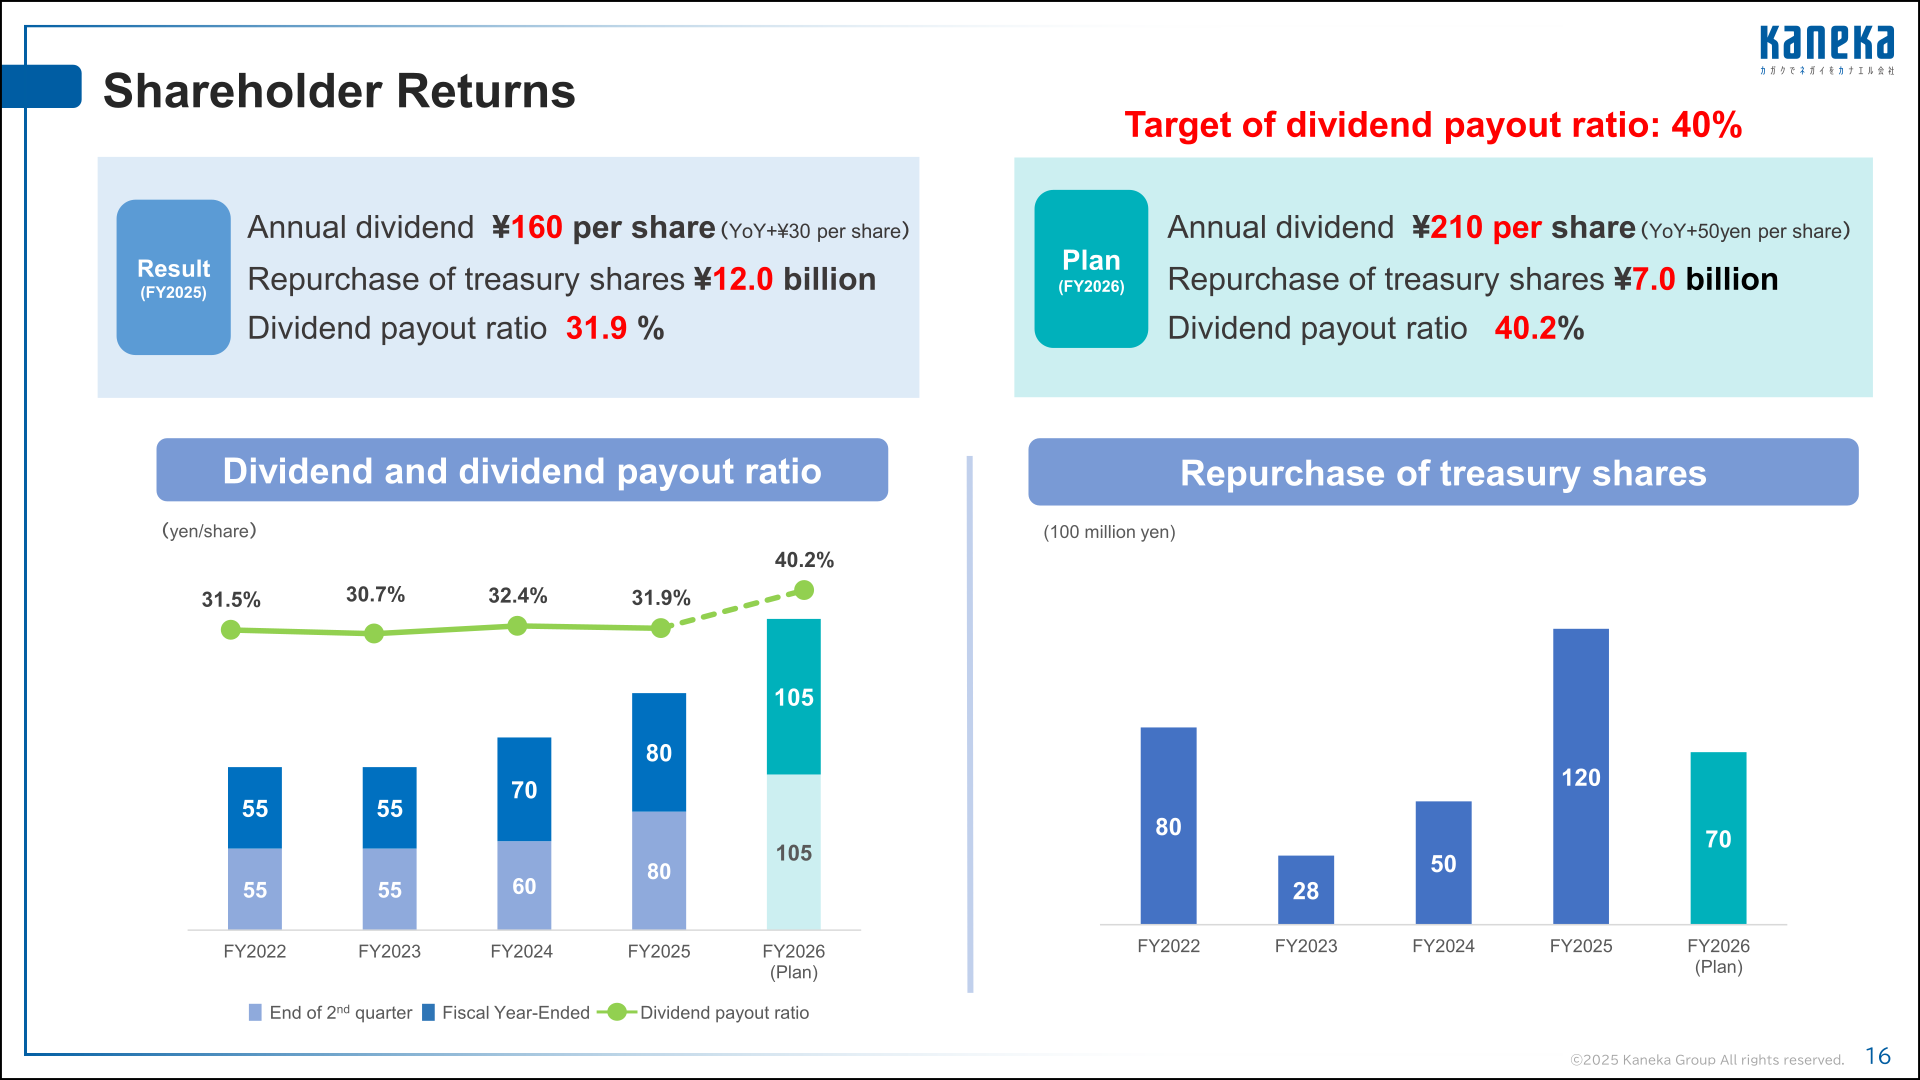
Shareholder Returns
The FY2025 annual dividend was ¥160 per share (up ¥30 per share year on year), with repurchase of treasury shares of ¥12.0 billion and a dividend payout ratio of 31.9%. For FY2026, the company plans an annual dividend of ¥210 per share (up ¥50 per share year on year), repurchase of treasury shares of ¥7.0 billion (upper limit 1,400,000 shares), and a dividend payout ratio of 40.2%. Kaneka will implement a progressive dividend policy for the period FY2025 to FY2027, with a dividend payout ratio of 40% as target.
| Item | FY2025 Result | FY2026 Plan |
|---|---|---|
| Annual dividend | ¥160 per share (YoY +¥30 per share) | ¥210 per share (YoY +¥50 per share) |
| Repurchase of treasury shares | ¥12.0 billion | ¥7.0 billion |
| Dividend payout ratio | 31.9% | 40.2% |
Topics: Portfolio Transformation and Cross-Shareholdings
The operating income contribution ratio of Leading-edge businesses (MS, E&I, PV, Medical, Pharma, Supplement) increased to 53% in FY2025, from 46% in FY2023 and 48% in FY2024. Key drivers were Medical (expanded sales of new products and broadened sales areas in Asia and the U.S.), Supplement (global sales expansion, primarily in the U.S.), and E&I (sales expansion of high-value-added grades such as polyimide films and optical acrylic resins). Kaneka also made further reductions of cross-shareholdings: the total amount disposed in FY2025 was ¥22.7 billion, and the ratio of cross-shareholdings to consolidated net assets was reduced to 8.1%, below 10%. On the balance sheet, total assets stood at ¥959.2 billion as of March 31, 2026, with an equity ratio of 52.0%. Cash flows from operating activities were ¥50.1 billion and free cash flow was ¥24.0 billion, with cash and cash equivalents of ¥48.9 billion at period-end.
This article is an analysis based on publicly available information and is not a recommendation to buy or sell any specific securities. Investment decisions are your own responsibility.
![[Obayashi] Investors’ Guide 2026 — The Complete 24-Article Breakdown](https://japan-equity.com/wp-content/uploads/2026/07/hub_cover-1024x1024.png)
![[Obayashi] IR & SR Policy — Feeding Dialogue Back into Management](https://japan-equity.com/wp-content/uploads/2026/07/p32_sq-1024x1024.jpg)
![[Obayashi] Domestic Civil Engineering — Resilience Spending Supports 9.6% Margin](https://japan-equity.com/wp-content/uploads/2026/07/p11_sq-1024x1024.jpg)
![[Obayashi] Overseas Construction — Orders Reach ¥1.2tn](https://japan-equity.com/wp-content/uploads/2026/07/p15_sq-1024x1024.jpg)
![[Obayashi] Share Price & External Ratings — vs TOPIX, ESG Index Inclusion](https://japan-equity.com/wp-content/uploads/2026/07/p40_sq-1024x1024.jpg)
![[Construction] ¥75.5tn Investment, Shrinking Workforce — Big-5 Market Share](https://japan-equity.com/wp-content/uploads/2026/07/p12_sq-1024x1024.jpg)



![[Obayashi] Capital Policy & Shareholder Returns — ROE 10%+, DOE ~5%, ¥100bn Buyback](https://japan-equity.com/wp-content/uploads/2026/07/p27_sq-1024x1024.jpg)
![[Obayashi] Reducing Cross-Shareholdings — ¥285.2bn Sold in Five Years](https://japan-equity.com/wp-content/uploads/2026/07/p29_sq-1024x1024.jpg)
![[Obayashi] ¥750bn Investment Plan — ¥300bn to Development, ¥190bn to Tech/DX](https://japan-equity.com/wp-content/uploads/2026/07/p30_sq-1024x1024.jpg)
![[Obayashi] MTP2022 KPIs — Operating Profit ~2x Target, ROE 14.4%](https://japan-equity.com/wp-content/uploads/2026/07/p25_sq-1024x1024.jpg)
![[Obayashi] Cash Allocation — ¥420bn Investment CF Over Five Years](https://japan-equity.com/wp-content/uploads/2026/07/p26_sq-1024x1024.jpg)
![[Obayashi] Green Energy — 44 Plants, 344MW, and the Green Hydrogen Challenge](https://japan-equity.com/wp-content/uploads/2026/07/p21_sq-1024x1024.jpg)
![[Obayashi] Tackling the Labor Shortage — Robotics Construction®](https://japan-equity.com/wp-content/uploads/2026/07/p14_sq-1024x1024.jpg)
