
This article is based on publicly available IR materials and is not a recommendation to buy or sell any specific securities.
Anritsu Corporation labels the fiscal year ended March 31, 2026 as FY2025 and the year ending March 31, 2027 as FY2026; the text and tables below keep the company’s labels. For FY2025 (April to March), Anritsu reported consolidated orders of 124.6 billion yen (up 11% year on year), revenue of 117.5 billion yen (up 4%), operating profit of 14.8 billion yen (up 22%) and profit of 11.7 billion yen (up 26%) under IFRS, summarizing the year as “YoY increased revenue and profit.” The Test & Measurement (T&M) segment saw revenue decrease but profit increase, PQA increased both revenue and profit, and Environmental Measurement increased revenue but decreased profit. For FY2026 the company forecasts revenue of 140.0 billion yen and operating profit of 20.0 billion yen, and it has raised the FY2025 annual dividend from 40 yen to 50 yen per share, including a 4 yen commemorative dividend.
Consolidated Results (Full-Year Actual)
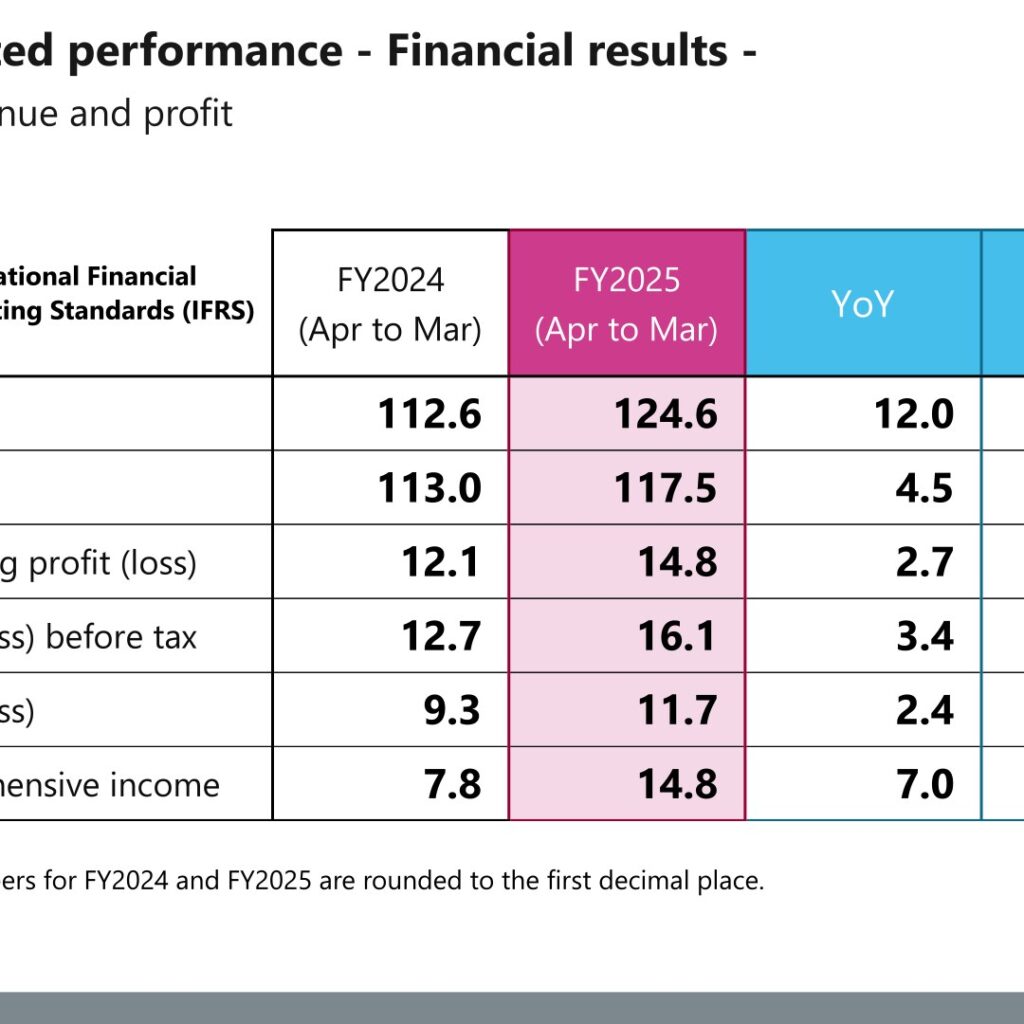
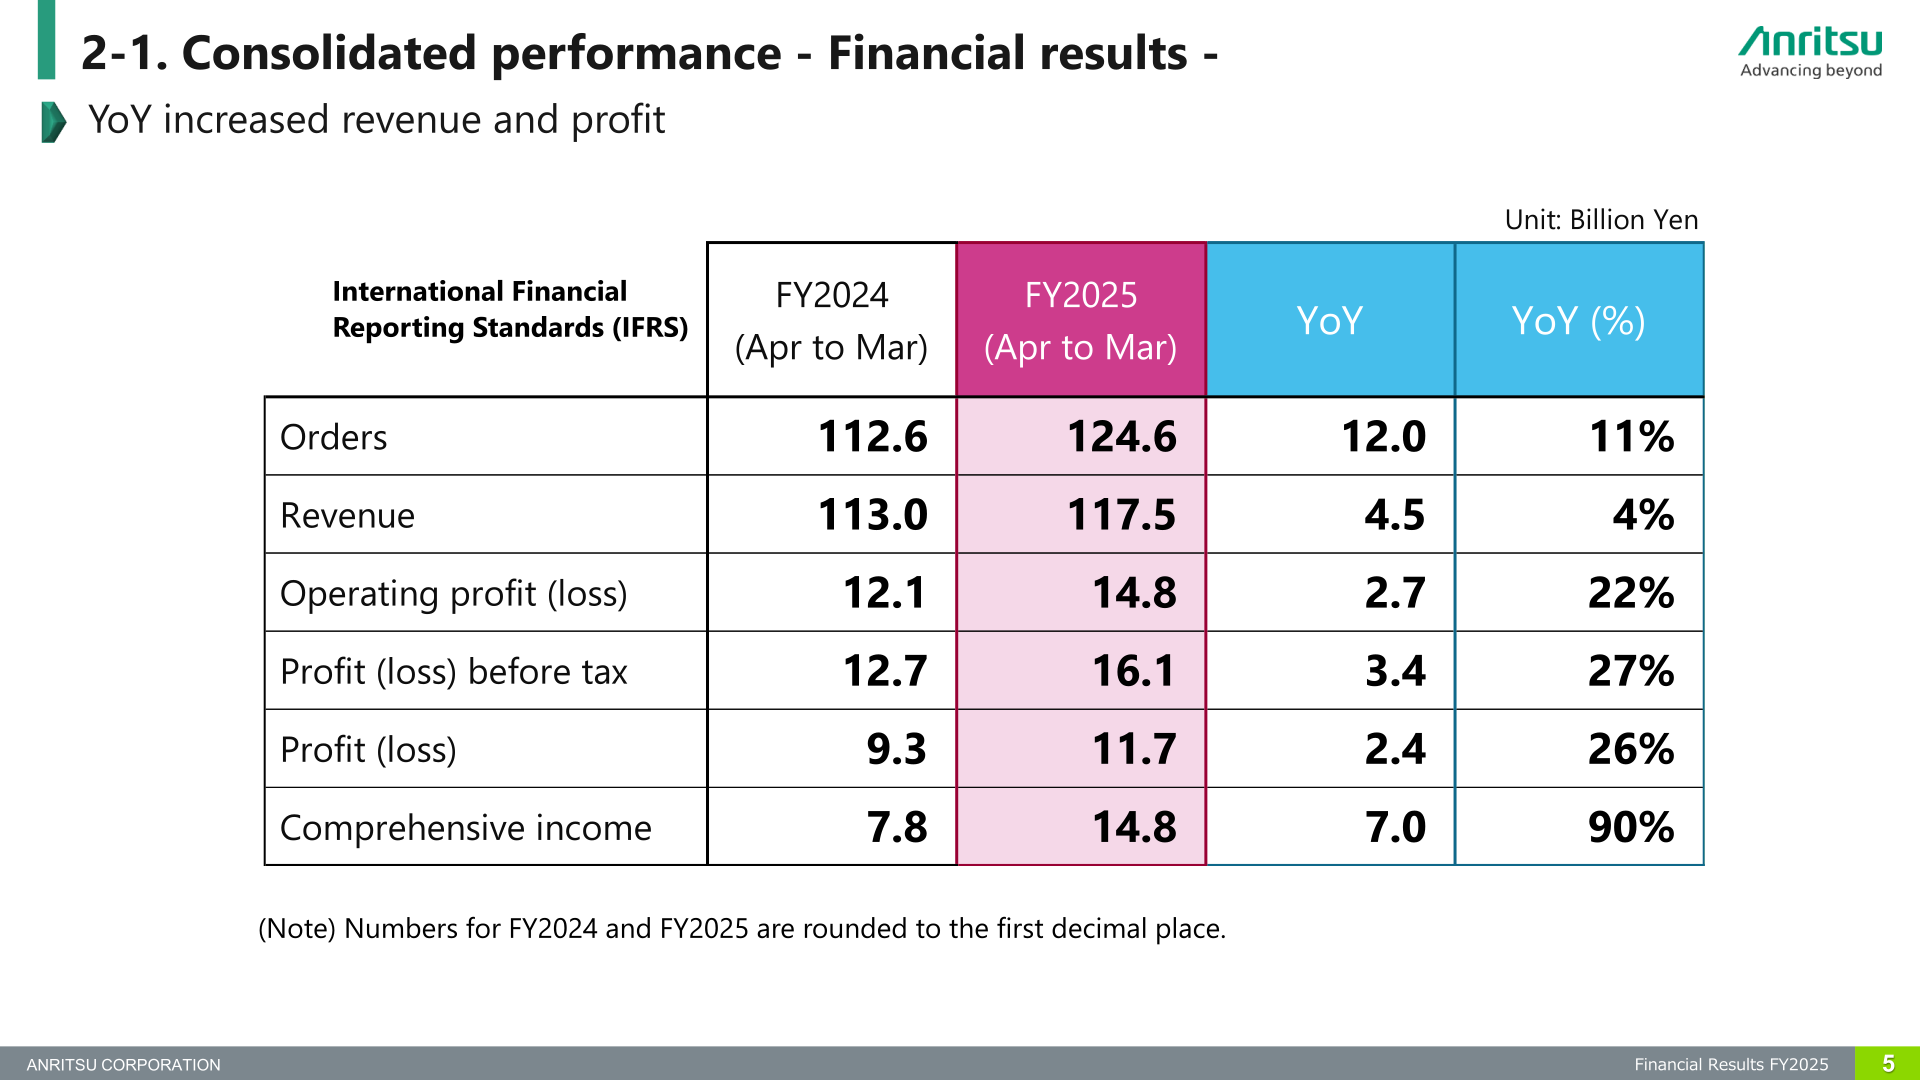
Consolidated orders for FY2025 were 124.6 billion yen, up 12.0 billion yen (11%) from 112.6 billion yen in FY2024. Revenue was 117.5 billion yen, up 4.5 billion yen (4%) from 113.0 billion yen. Operating profit was 14.8 billion yen, up 2.7 billion yen (22%) from 12.1 billion yen; profit before tax was 16.1 billion yen, up 3.4 billion yen (27%) from 12.7 billion yen; profit was 11.7 billion yen, up 2.4 billion yen (26%) from 9.3 billion yen; and comprehensive income was 14.8 billion yen, up 7.0 billion yen (90%) from 7.8 billion yen. The company notes that figures for FY2024 and FY2025 are rounded to the first decimal place. Quarterly revenue in FY2025 was 23.6 billion yen in 1Q, 28.1 billion yen in 2Q, 29.4 billion yen in 3Q and 36.4 billion yen in 4Q, and operating profit was 1.3 billion yen, 3.7 billion yen, 3.4 billion yen and 6.4 billion yen, respectively. In 4Q (January to March), the operating margin was 20.8% for T&M, 14.2% for PQA and 16.7% for Environmental Measurement.
| Item (Billion Yen) | FY2024 (Apr to Mar) | FY2025 (Apr to Mar) | YoY | YoY (%) |
|---|---|---|---|---|
| Orders | 112.6 | 124.6 | 12.0 | 11% |
| Revenue | 113.0 | 117.5 | 4.5 | 4% |
| Operating profit (loss) | 12.1 | 14.8 | 2.7 | 22% |
| Profit (loss) before tax | 12.7 | 16.1 | 3.4 | 27% |
| Profit (loss) | 9.3 | 11.7 | 2.4 | 26% |
| Comprehensive income | 7.8 | 14.8 | 7.0 | 90% |
On cash flow, operating cash flow for FY2025 was 17.9 billion yen, investing cash flow was (14.7) billion yen and financing cash flow was (6.4) billion yen, giving free cash flow (operating CF plus investing CF) of 3.2 billion yen. The operating cash flow margin ratio was 15.2%. Cash at the end of the period was 49.3 billion yen and interest-bearing debt was 6.8 billion yen.
Segment Results
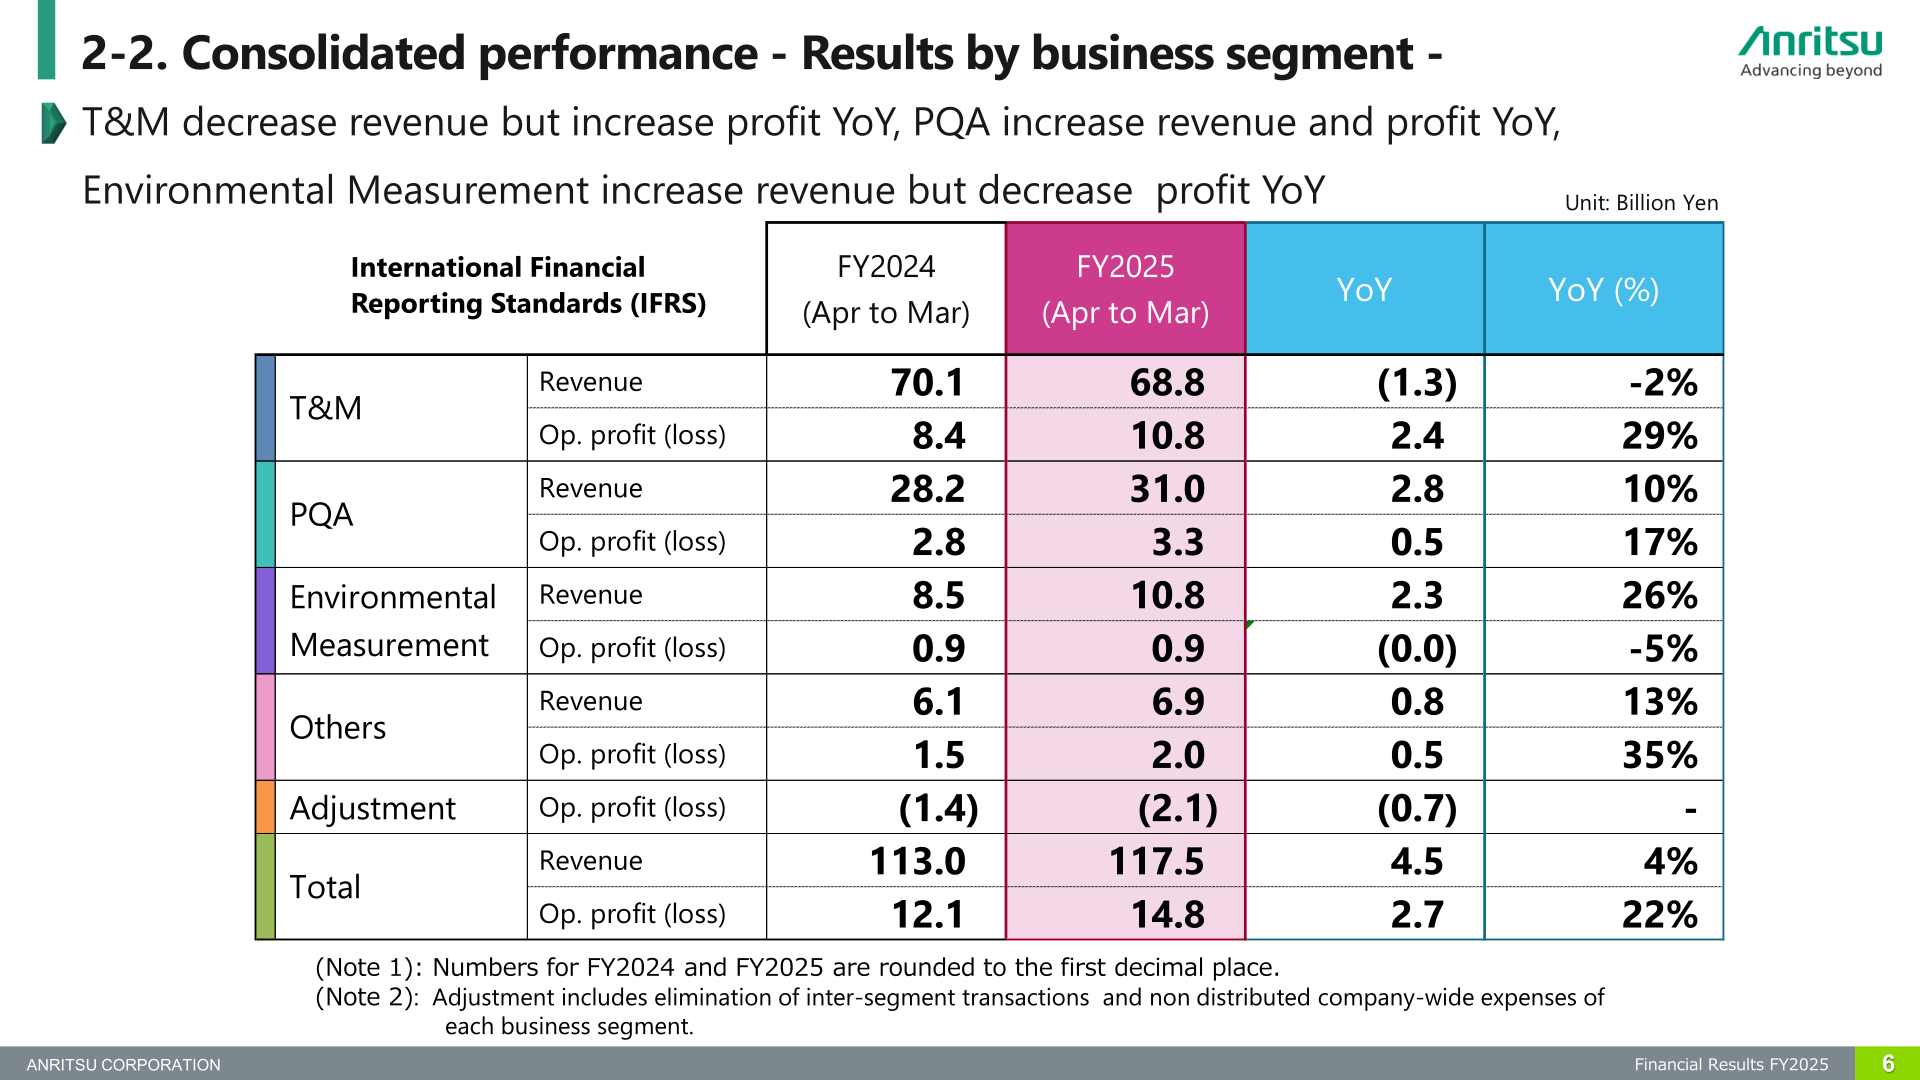
By business segment, T&M revenue was 68.8 billion yen, down 1.3 billion yen (2%) from 70.1 billion yen, while T&M operating profit rose 2.4 billion yen (29%) to 10.8 billion yen from 8.4 billion yen. PQA revenue was 31.0 billion yen, up 2.8 billion yen (10%) from 28.2 billion yen, with operating profit of 3.3 billion yen, up 0.5 billion yen (17%) from 2.8 billion yen. Environmental Measurement revenue was 10.8 billion yen, up 2.3 billion yen (26%) from 8.5 billion yen, while its operating profit was 0.9 billion yen, down (0.0) billion yen (-5%) from 0.9 billion yen. Others revenue was 6.9 billion yen, up 0.8 billion yen (13%) from 6.1 billion yen, with operating profit of 2.0 billion yen, up 0.5 billion yen (35%) from 1.5 billion yen. The adjustment to operating profit was (2.1) billion yen versus (1.4) billion yen; the company notes that the adjustment includes elimination of inter-segment transactions and non-distributed company-wide expenses of each business segment. In FY2025, T&M accounted for 59% of consolidated revenue, PQA 26%, EM 9% and Others 6%; within T&M, Mobile was 38%, Network Infrastructure 39% and Electronics 23%. T&M revenue by region in FY2025 was Japan 16%, Americas 28%, EMEA 18% and Asia & Others 38%. Orders increased 20% year on year in T&M, 21% in PQA and 57% in Environmental Measurement.
| Segment | Item (Billion Yen) | FY2024 (Apr to Mar) | FY2025 (Apr to Mar) | YoY | YoY (%) |
|---|---|---|---|---|---|
| T&M | Revenue | 70.1 | 68.8 | (1.3) | -2% |
| T&M | Op. profit (loss) | 8.4 | 10.8 | 2.4 | 29% |
| PQA | Revenue | 28.2 | 31.0 | 2.8 | 10% |
| PQA | Op. profit (loss) | 2.8 | 3.3 | 0.5 | 17% |
| Environmental Measurement | Revenue | 8.5 | 10.8 | 2.3 | 26% |
| Environmental Measurement | Op. profit (loss) | 0.9 | 0.9 | (0.0) | -5% |
| Others | Revenue | 6.1 | 6.9 | 0.8 | 13% |
| Others | Op. profit (loss) | 1.5 | 2.0 | 0.5 | 35% |
| Adjustment | Op. profit (loss) | (1.4) | (2.1) | (0.7) | – |
| Total | Revenue | 113.0 | 117.5 | 4.5 | 4% |
| Total | Op. profit (loss) | 12.1 | 14.8 | 2.7 | 22% |
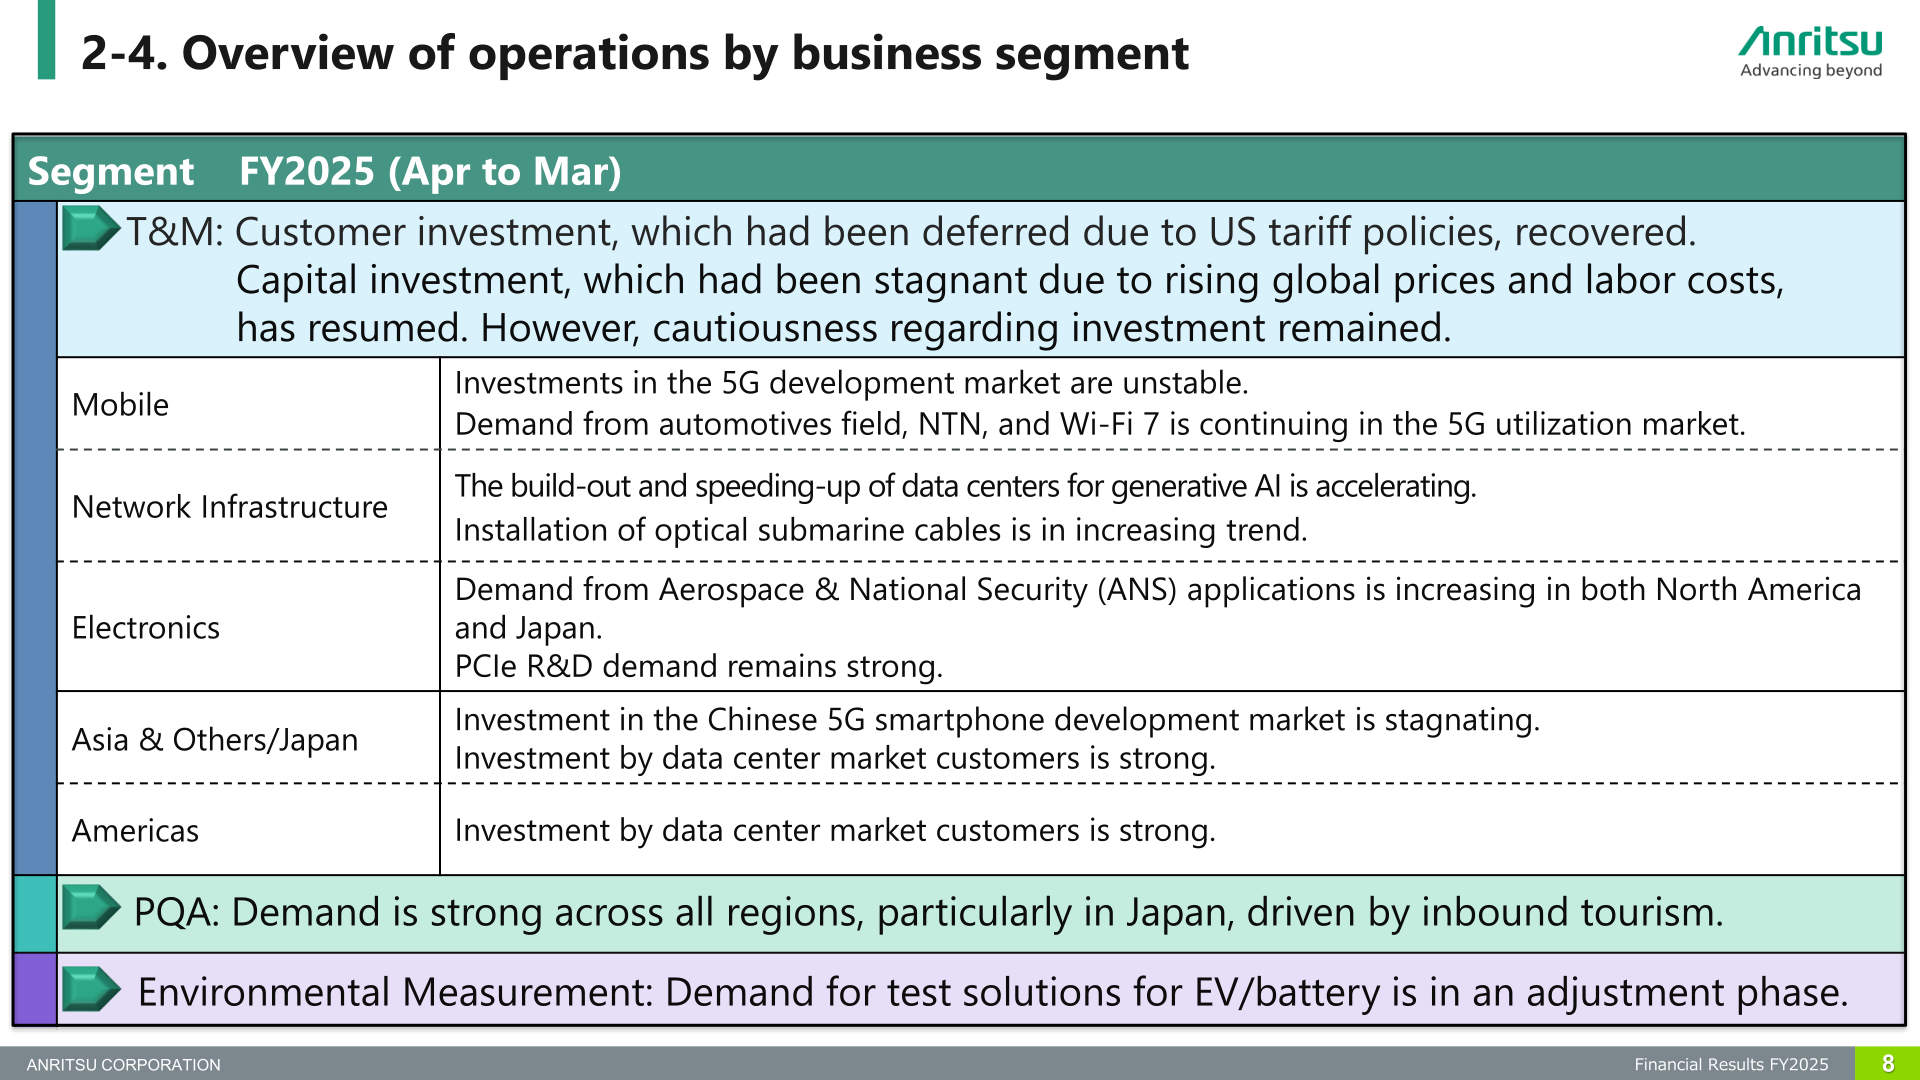
In its overview of operations, the company says that in T&M, customer investment which had been deferred due to US tariff policies recovered, and capital investment that had been stagnant due to rising global prices and labor costs resumed, although cautiousness regarding investment remained. In Mobile, investments in the 5G development market are unstable, while demand from the automotive field, NTN and Wi-Fi 7 is continuing in the 5G utilization market. In Network Infrastructure, the build-out and speeding-up of data centers for generative AI is accelerating and installation of optical submarine cables is in an increasing trend. In Electronics, demand from Aerospace & National Security (ANS) applications is increasing in both North America and Japan, and PCIe R&D demand remains strong. By region, investment in the Chinese 5G smartphone development market is stagnating while investment by data center market customers is strong in Asia & Others/Japan and in the Americas. In PQA, demand is strong across all regions, particularly in Japan, driven by inbound tourism. In Environmental Measurement, demand for test solutions for EV/battery is in an adjustment phase.
FY2026 Forecast
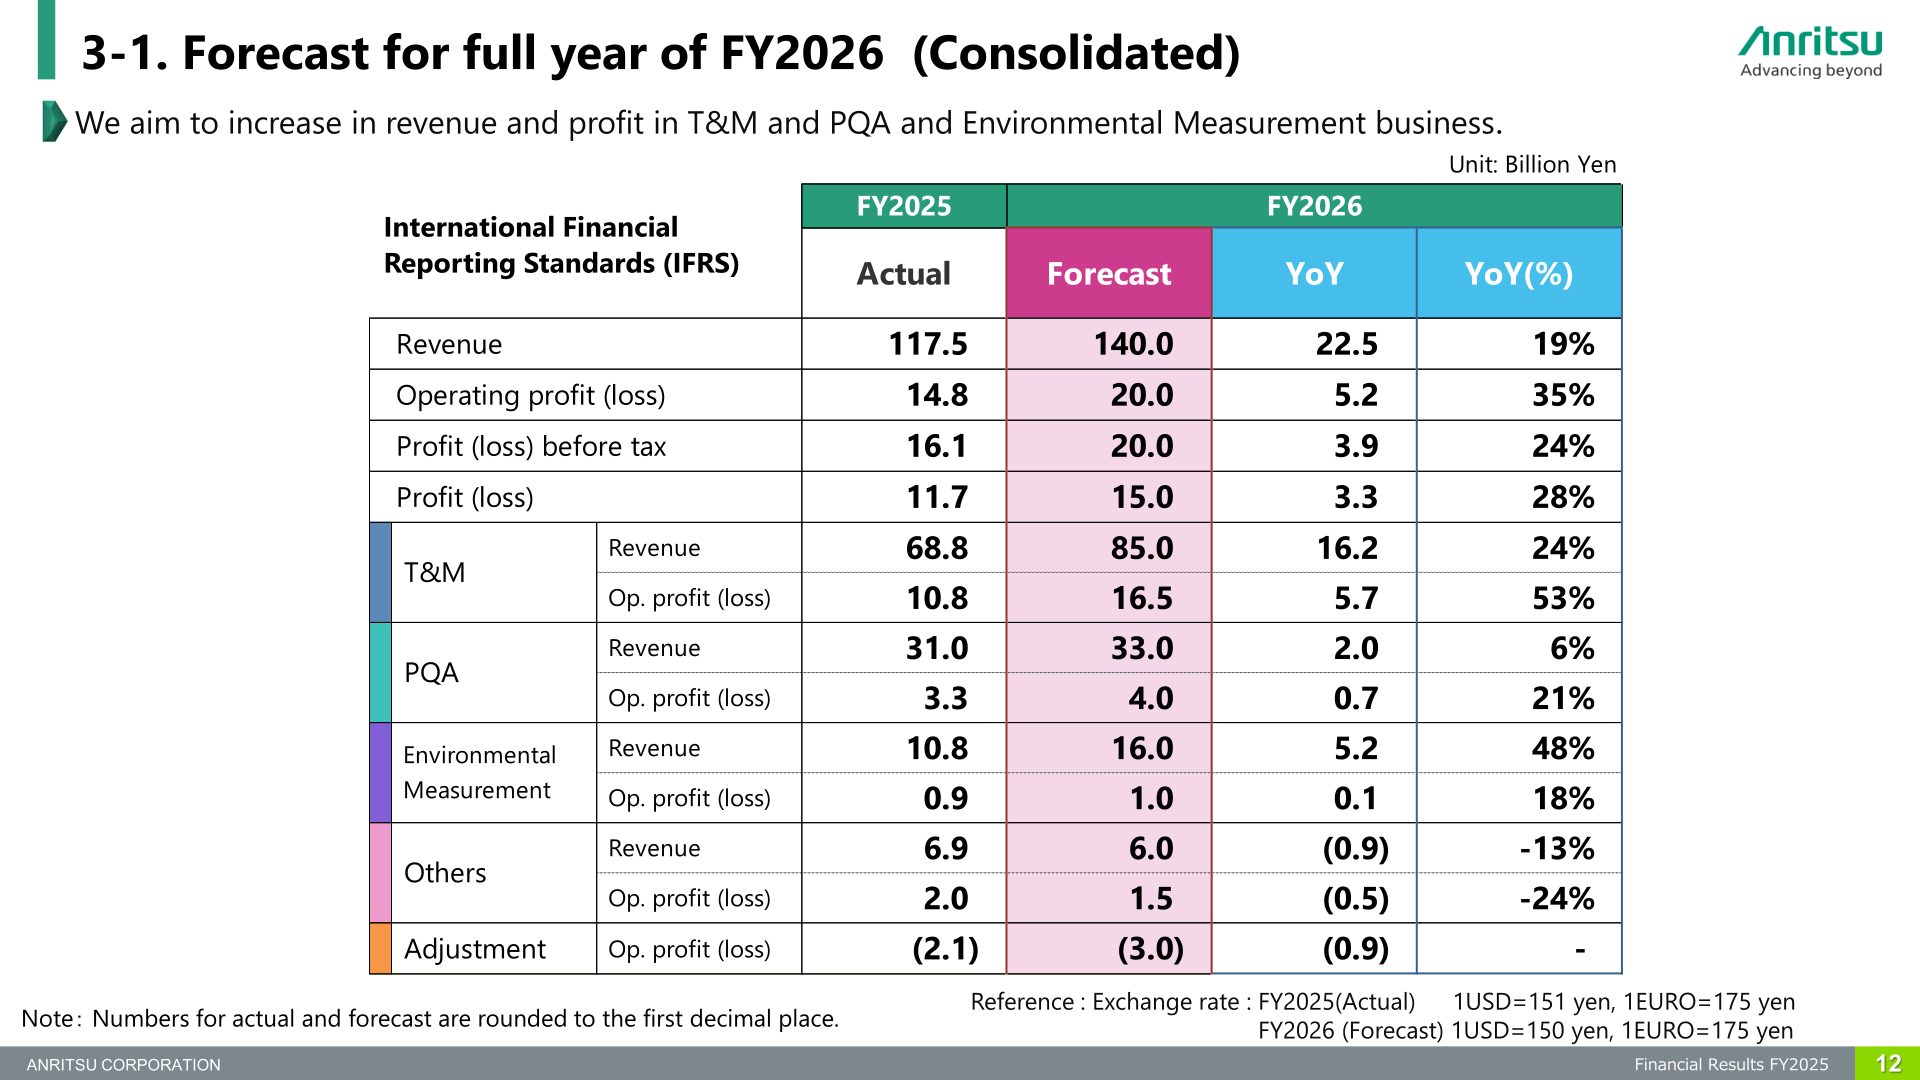
For FY2026 (consolidated), Anritsu forecasts revenue of 140.0 billion yen, up 22.5 billion yen (19%) from 117.5 billion yen in FY2025, operating profit of 20.0 billion yen, up 5.2 billion yen (35%) from 14.8 billion yen, profit before tax of 20.0 billion yen, up 3.9 billion yen (24%) from 16.1 billion yen, and profit of 15.0 billion yen, up 3.3 billion yen (28%) from 11.7 billion yen. By segment, T&M revenue is forecast at 85.0 billion yen (up 16.2 billion yen, 24%) with operating profit of 16.5 billion yen (up 5.7 billion yen, 53%); PQA revenue at 33.0 billion yen (up 2.0 billion yen, 6%) with operating profit of 4.0 billion yen (up 0.7 billion yen, 21%); Environmental Measurement revenue at 16.0 billion yen (up 5.2 billion yen, 48%) with operating profit of 1.0 billion yen (up 0.1 billion yen, 18%); and Others revenue at 6.0 billion yen ((0.9) billion yen, -13%) with operating profit of 1.5 billion yen ((0.5) billion yen, -24%). The adjustment is forecast at (3.0) billion yen versus (2.1) billion yen. The company states, “We aim to increase in revenue and profit in T&M and PQA and Environmental Measurement business.” The reference exchange rates are 1USD=151 yen and 1EURO=175 yen for FY2025 (actual) and 1USD=150 yen and 1EURO=175 yen for the FY2026 forecast.
| Item (Billion Yen) | FY2025 Actual | FY2026 Forecast | YoY | YoY (%) |
|---|---|---|---|---|
| Revenue | 117.5 | 140.0 | 22.5 | 19% |
| Operating profit (loss) | 14.8 | 20.0 | 5.2 | 35% |
| Profit (loss) before tax | 16.1 | 20.0 | 3.9 | 24% |
| Profit (loss) | 11.7 | 15.0 | 3.3 | 28% |
| T&M — Revenue | 68.8 | 85.0 | 16.2 | 24% |
| T&M — Op. profit (loss) | 10.8 | 16.5 | 5.7 | 53% |
| PQA — Revenue | 31.0 | 33.0 | 2.0 | 6% |
| PQA — Op. profit (loss) | 3.3 | 4.0 | 0.7 | 21% |
| Environmental Measurement — Revenue | 10.8 | 16.0 | 5.2 | 48% |
| Environmental Measurement — Op. profit (loss) | 0.9 | 1.0 | 0.1 | 18% |
| Others — Revenue | 6.9 | 6.0 | (0.9) | -13% |
| Others — Op. profit (loss) | 2.0 | 1.5 | (0.5) | -24% |
| Adjustment — Op. profit (loss) | (2.1) | (3.0) | (0.9) | – |
Shareholder Returns
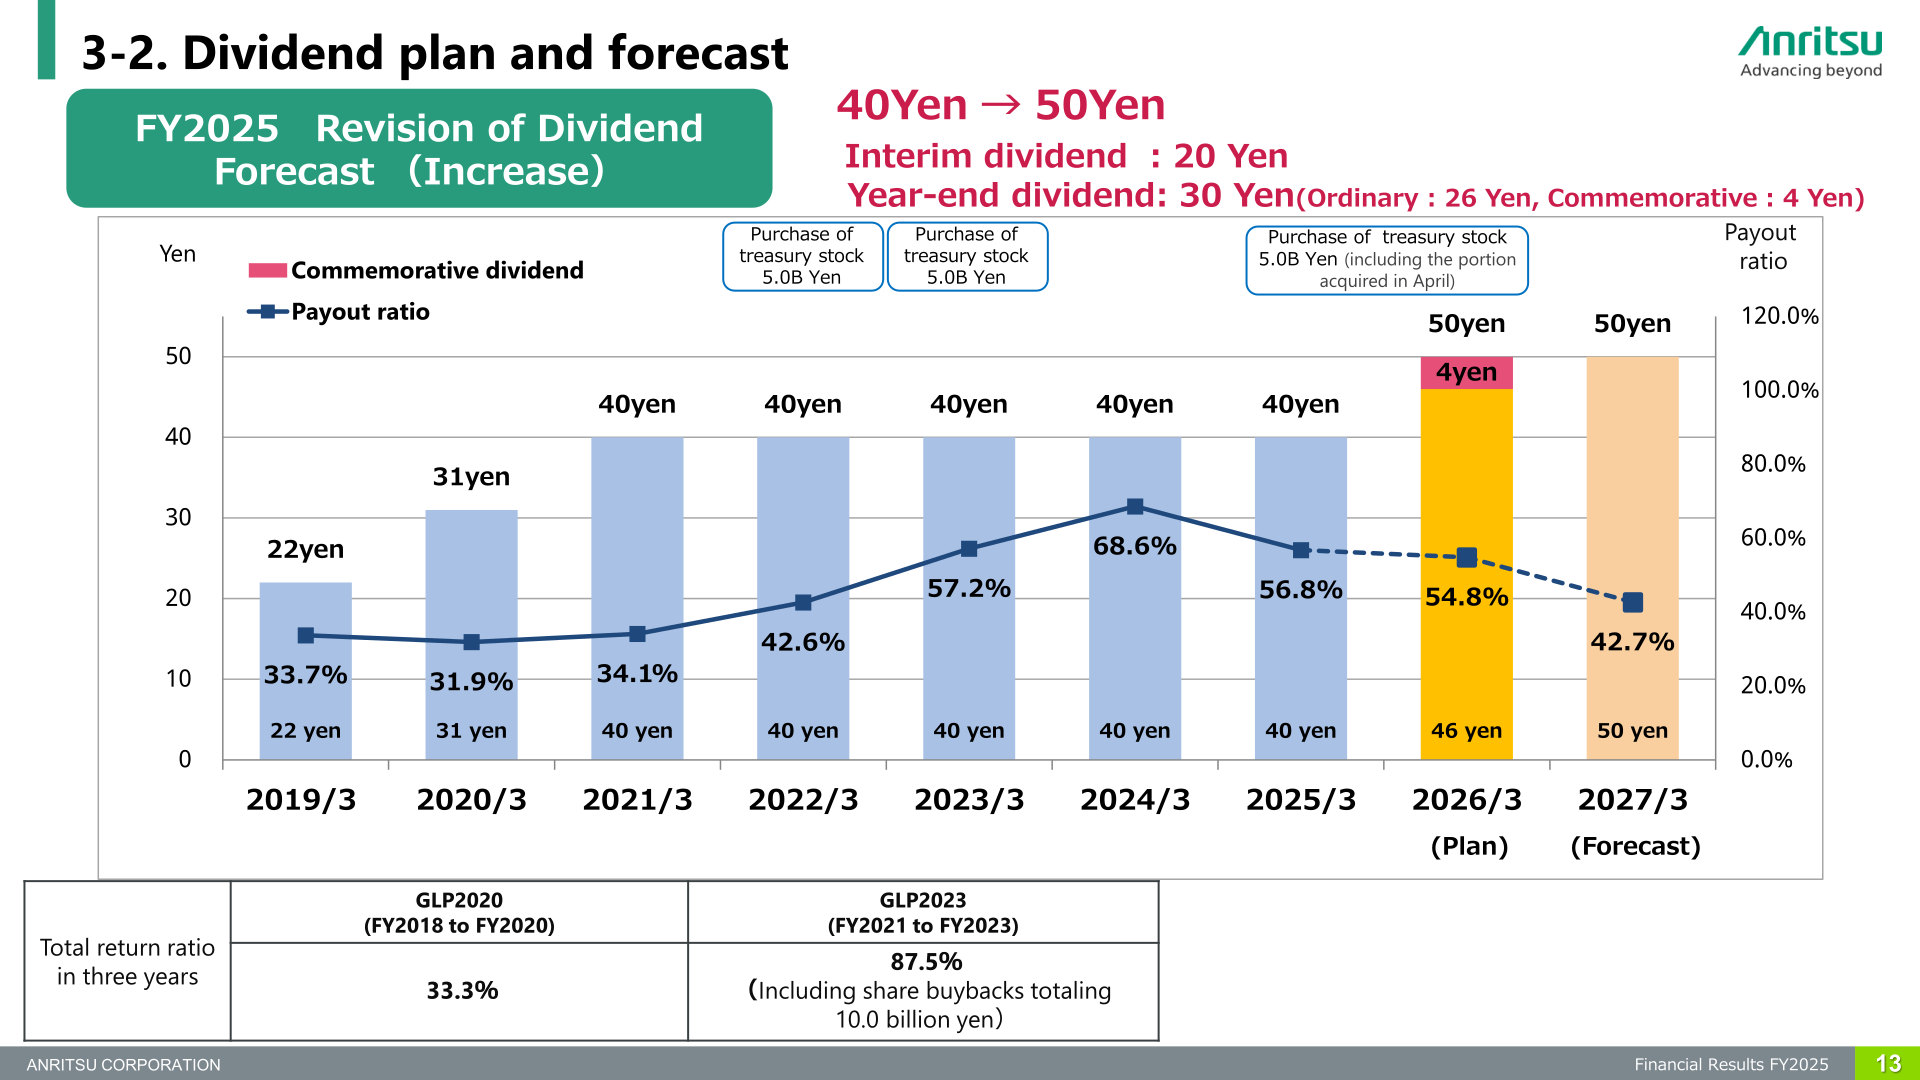
Anritsu revised its FY2025 dividend forecast upward from 40 yen to 50 yen per share, consisting of an interim dividend of 20 yen and a year-end dividend of 30 yen (ordinary 26 yen and commemorative 4 yen). The annual dividend per share was 22 yen for 2019/3, 31 yen for 2020/3, 40 yen for each of 2021/3 through 2025/3, 50 yen for 2026/3 (plan; 46 yen ordinary plus 4 yen commemorative) and 50 yen for 2027/3 (forecast). The payout ratio shown on the dividend slide was 56.8% for 2025/3, 54.8% for 2026/3 (plan) and 42.7% for 2027/3 (forecast). The slide also shows purchases of treasury stock of 5.0 billion yen in 2022/3 and 2023/3, and 5.0 billion yen for 2026/3 (including the portion acquired in April). The total return ratio over three years was 33.3% under GLP2020 (FY2018 to FY2020) and 87.5% under GLP2023 (FY2021 to FY2023), the latter including share buybacks totaling 10.0 billion yen.
| Item | 2025/3 | 2026/3 (Plan) | 2027/3 (Forecast) |
|---|---|---|---|
| Annual dividend per share | 40 yen | 50 yen (Ordinary 46 yen + Commemorative 4 yen) | 50 yen |
| Interim / Year-end (2026/3) | – | 20 Yen / 30 Yen (Ordinary 26 Yen, Commemorative 4 Yen) | – |
| Payout ratio | 56.8% | 54.8% | 42.7% |
Medium-Term Plan (GLP2026) and Topics
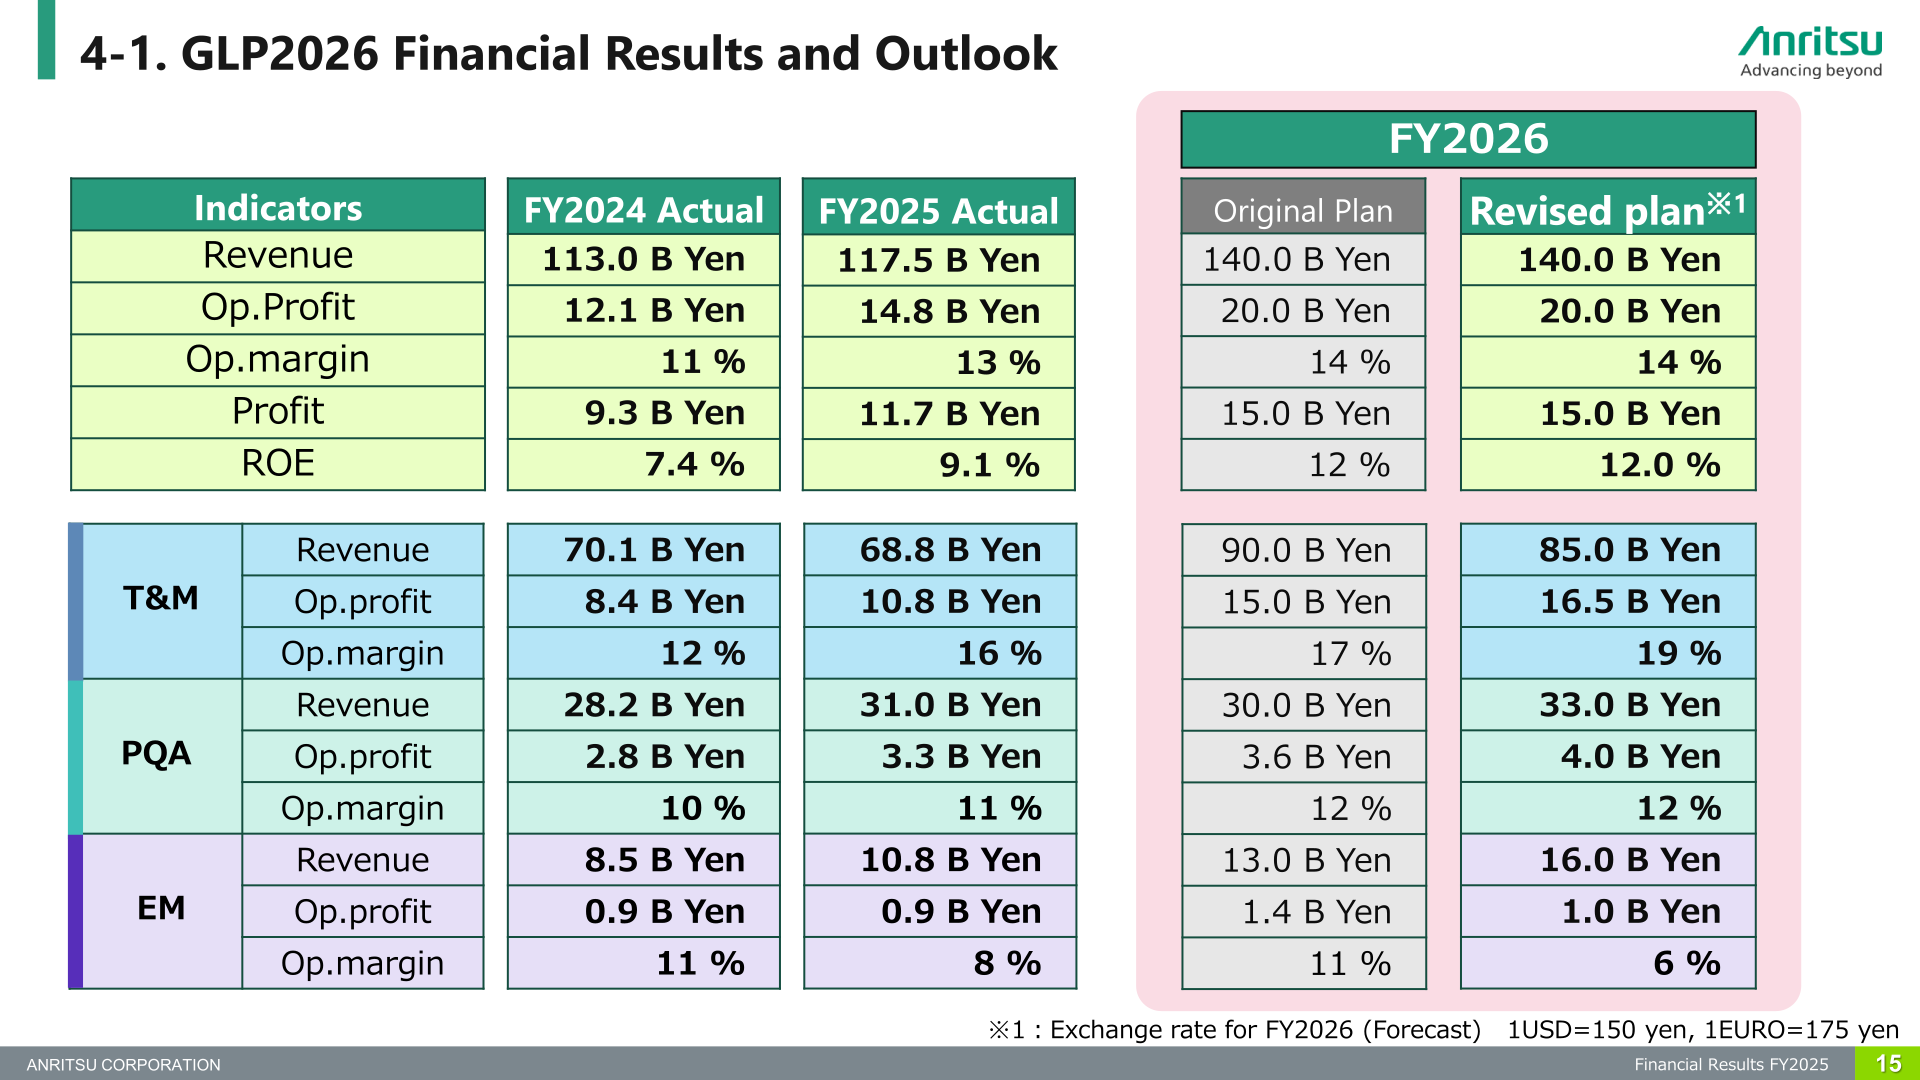
Under GLP2026, the company presents FY2024 actual, FY2025 actual and FY2026 original and revised plans. Consolidated revenue was 113.0 B Yen in FY2024 and 117.5 B Yen in FY2025, against a FY2026 plan of 140.0 B Yen (both original and revised); operating profit was 12.1 B Yen and 14.8 B Yen versus 20.0 B Yen; operating margin was 11% and 13% versus 14%; profit was 9.3 B Yen and 11.7 B Yen versus 15.0 B Yen; and ROE was 7.4% and 9.1% versus 12.0% in the revised plan (12% in the original plan). By segment, T&M revenue was 70.1 B Yen (FY2024) and 68.8 B Yen (FY2025), with a FY2026 revised plan of 85.0 B Yen (original plan 90.0 B Yen), operating profit of 8.4 B Yen and 10.8 B Yen versus a revised 16.5 B Yen (original 15.0 B Yen), and operating margin of 12% and 16% versus a revised 19% (original 17%). PQA revenue was 28.2 B Yen and 31.0 B Yen versus a revised 33.0 B Yen (original 30.0 B Yen), operating profit 2.8 B Yen and 3.3 B Yen versus a revised 4.0 B Yen (original 3.6 B Yen), and operating margin 10% and 11% versus 12% (both plans). EM revenue was 8.5 B Yen and 10.8 B Yen versus a revised 16.0 B Yen (original 13.0 B Yen), operating profit 0.9 B Yen and 0.9 B Yen versus a revised 1.0 B Yen (original 1.4 B Yen), and operating margin 11% and 8% versus a revised 6% (original 11%). The exchange rate assumption for the FY2026 forecast is 1USD=150 yen and 1EURO=175 yen.
On market trends, the company states that demand for 800GE optical transceivers is expected to remain at a high level in 2026, that increased production of optical transceivers is expected to lead to an increase in demand for test and measurement instruments, and that 1.6TE optical transceiver production is expected to gain full steam in the second half of 2026, with an increase in demand expected as manufacturing lines start up. For FY2026, under the heading “Accelerate Business Expansion in Growth Areas,” the company shows a FY2030 revenue target of 50.0 B Yen for Industrial Measurement (Industrial Measurement Div., with a sales agreement with TTi (UK) in April 2026) and a FY2030 revenue target of 10.0 B Yen for Pharmaceutical (Healthcare Business Div., with the launch of an NIR tablet inspection system in February 2026). At Mobile World Congress (MWC) 2026, the company’s booth showcased a “Virtual Signaling Tester” supporting the early standardization of 6G, a test platform with AI-powered analysis functions, and a “Virtualized Automotive Testing Solution”; it reports 271 visitors to its booth and a joint demonstration with Qualcomm Technologies, Inc.
This article is an analysis based on publicly available information and is not a recommendation to buy or sell any specific securities. Investment decisions are your own responsibility.
![[Obayashi] Investors’ Guide 2026 — The Complete 24-Article Breakdown](https://japan-equity.com/wp-content/uploads/2026/07/hub_cover-1024x1024.png)
![[Obayashi] IR & SR Policy — Feeding Dialogue Back into Management](https://japan-equity.com/wp-content/uploads/2026/07/p32_sq-1024x1024.jpg)
![[Obayashi] Domestic Civil Engineering — Resilience Spending Supports 9.6% Margin](https://japan-equity.com/wp-content/uploads/2026/07/p11_sq-1024x1024.jpg)
![[Obayashi] Overseas Construction — Orders Reach ¥1.2tn](https://japan-equity.com/wp-content/uploads/2026/07/p15_sq-1024x1024.jpg)
![[Obayashi] Share Price & External Ratings — vs TOPIX, ESG Index Inclusion](https://japan-equity.com/wp-content/uploads/2026/07/p40_sq-1024x1024.jpg)
![[Construction] ¥75.5tn Investment, Shrinking Workforce — Big-5 Market Share](https://japan-equity.com/wp-content/uploads/2026/07/p12_sq-1024x1024.jpg)



![[Obayashi] Capital Policy & Shareholder Returns — ROE 10%+, DOE ~5%, ¥100bn Buyback](https://japan-equity.com/wp-content/uploads/2026/07/p27_sq-1024x1024.jpg)
![[Obayashi] Reducing Cross-Shareholdings — ¥285.2bn Sold in Five Years](https://japan-equity.com/wp-content/uploads/2026/07/p29_sq-1024x1024.jpg)
![[Obayashi] ¥750bn Investment Plan — ¥300bn to Development, ¥190bn to Tech/DX](https://japan-equity.com/wp-content/uploads/2026/07/p30_sq-1024x1024.jpg)
![[Obayashi] MTP2022 KPIs — Operating Profit ~2x Target, ROE 14.4%](https://japan-equity.com/wp-content/uploads/2026/07/p25_sq-1024x1024.jpg)
![[Obayashi] Cash Allocation — ¥420bn Investment CF Over Five Years](https://japan-equity.com/wp-content/uploads/2026/07/p26_sq-1024x1024.jpg)
![[Obayashi] Green Energy — 44 Plants, 344MW, and the Green Hydrogen Challenge](https://japan-equity.com/wp-content/uploads/2026/07/p21_sq-1024x1024.jpg)
![[Obayashi] Tackling the Labor Shortage — Robotics Construction®](https://japan-equity.com/wp-content/uploads/2026/07/p14_sq-1024x1024.jpg)
