
This article is based on publicly available IR materials and is not a recommendation to buy or sell any specific securities.
Note: ULVAC’s fiscal year ends in June; the company labels the fiscal year ended June 30, 2026 as “FY2026/6” (FY26/6) and the year ending June 30, 2027 as “FY2027/6” (FY27/6). The text and tables below keep the company’s own labels. For FY2026/6, ULVAC reported record-high orders received of ¥324.2 billion, a significant increase of ¥98.7 billion year on year, driven by the Semiconductor, Display and Rare earth-related businesses. Net sales rose ¥17.9 billion year on year to ¥269.1 billion, while operating profit fell to ¥19.6 billion (down 26%) and profit attributable to owners of parent was ¥17.1 billion (up 2%), with the company citing the recording of one-time EV-related expenses. For FY2027/6 the company plans net sales of ¥255.0 billion and operating profit of ¥28.0 billion, with the gross profit margin projected at 33.7%, and an unchanged annual dividend of ¥152 per share.
Consolidated Results (Full-Year Actual)
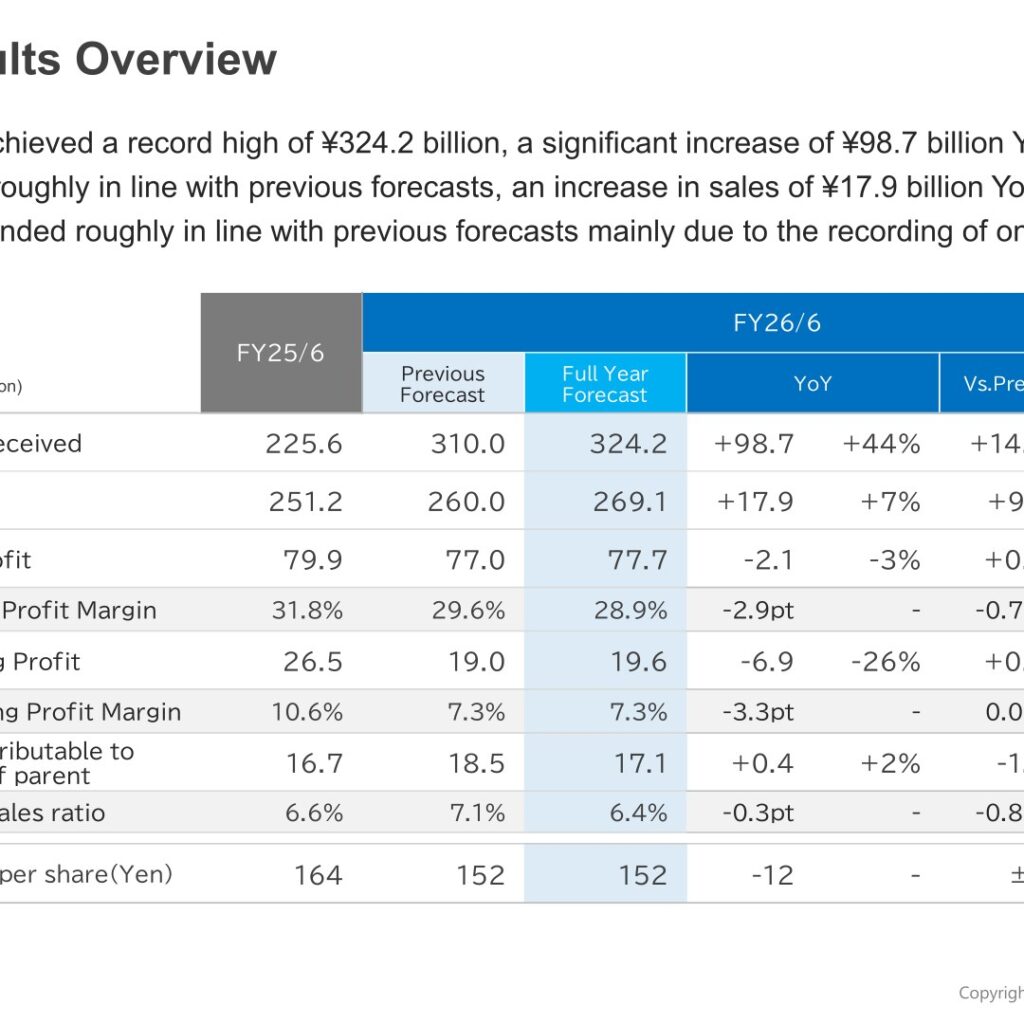
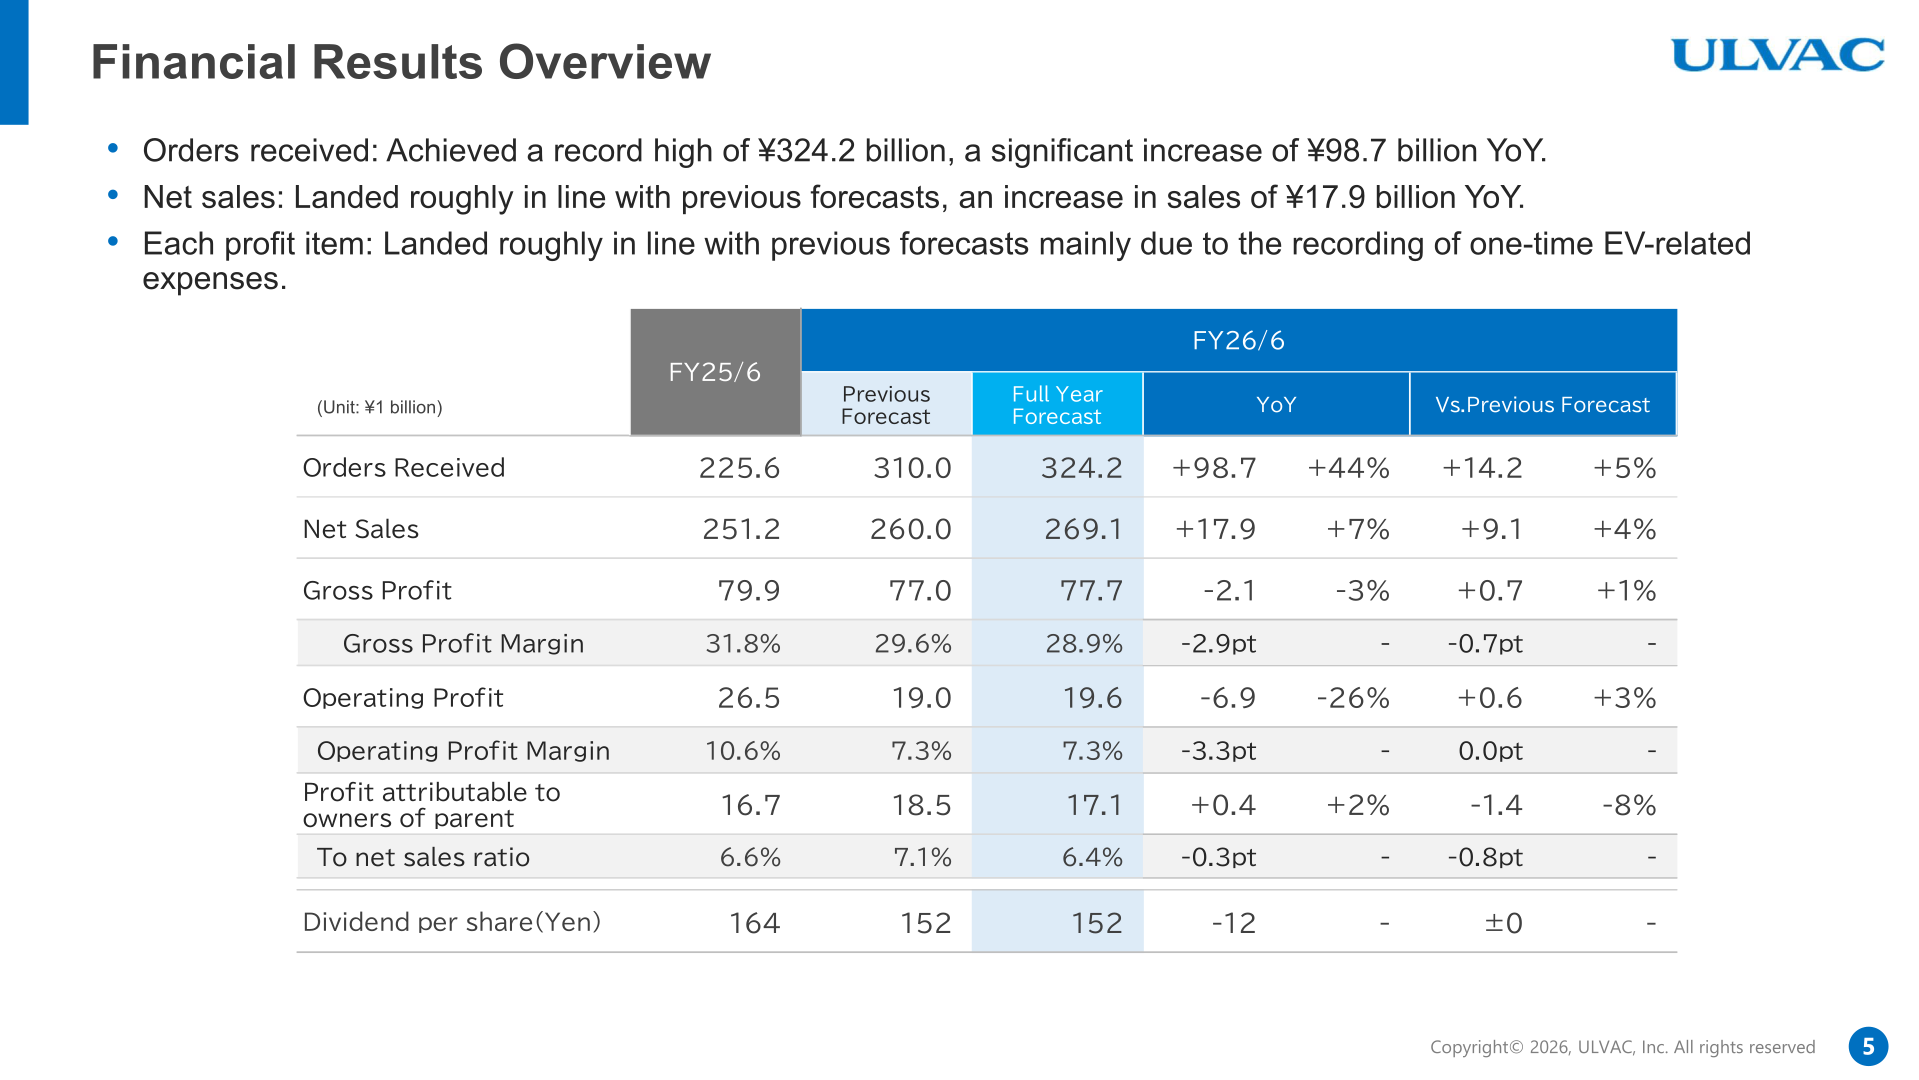
Orders received for FY2026/6 were ¥324.2 billion, a record high and up ¥98.7 billion (+44%) from ¥225.6 billion in FY2025/6; this was also ¥14.2 billion (+5%) above the previous forecast of ¥310.0 billion. Net sales were ¥269.1 billion, up ¥17.9 billion (+7%) year on year and ¥9.1 billion (+4%) above the previous forecast of ¥260.0 billion, which the company describes as roughly in line with the previous forecast. Gross profit was ¥77.7 billion, down ¥2.1 billion (-3%), with the gross profit margin falling 2.9 pt to 28.9% due to the recognition of EV-related expenses and mix changes from an increase in display-related businesses. Operating profit was ¥19.6 billion, down ¥6.9 billion (-26%) year on year but ¥0.6 billion (+3%) above the previous forecast of ¥19.0 billion; the operating profit margin declined 3.3 pt to 7.3% due to an increase in SG&A expenses driven by one-time factors and higher R&D expenses. SG&A expenses were ¥58.1 billion (21.6% of net sales), including R&D expenses of ¥13.1 billion. Profit attributable to owners of parent was ¥17.1 billion, up ¥0.4 billion (+2%) year on year, though ¥1.4 billion (-8%) below the previous forecast of ¥18.5 billion. The company summarizes the year as higher sales and lower profit year on year, mainly due to the recording of one-time EV-related expenses.
| Item (Unit: ¥1 billion) | FY25/6 | FY26/6 Previous Forecast | FY26/6 Full Year | YoY | YoY % | Vs. Previous Forecast |
|---|---|---|---|---|---|---|
| Orders Received | 225.6 | 310.0 | 324.2 | +98.7 | +44% | +14.2 (+5%) |
| Net Sales | 251.2 | 260.0 | 269.1 | +17.9 | +7% | +9.1 (+4%) |
| Gross Profit | 79.9 | 77.0 | 77.7 | -2.1 | -3% | +0.7 (+1%) |
| Gross Profit Margin | 31.8% | 29.6% | 28.9% | -2.9pt | – | -0.7pt |
| Operating Profit | 26.5 | 19.0 | 19.6 | -6.9 | -26% | +0.6 (+3%) |
| Operating Profit Margin | 10.6% | 7.3% | 7.3% | -3.3pt | – | 0.0pt |
| Profit attributable to owners of parent | 16.7 | 18.5 | 17.1 | +0.4 | +2% | -1.4 (-8%) |
| To net sales ratio | 6.6% | 7.1% | 6.4% | -0.3pt | – | -0.8pt |
| Dividend per share (Yen) | 164 | 152 | 152 | -12 | – | ±0 |
On the balance sheet, total assets stood at ¥414.0 billion at the end of FY2026/6 (¥375.1 billion at the end of FY25/6), and net assets were ¥249.2 billion (¥231.1 billion). Cash on hand and in banks was ¥105.0 billion (¥99.0 billion), inventories were ¥71.1 billion (¥71.1 billion) and interest-bearing debt was ¥7.5 billion (¥11.0 billion). Contract liabilities were ¥39.9 billion.
Segment Results
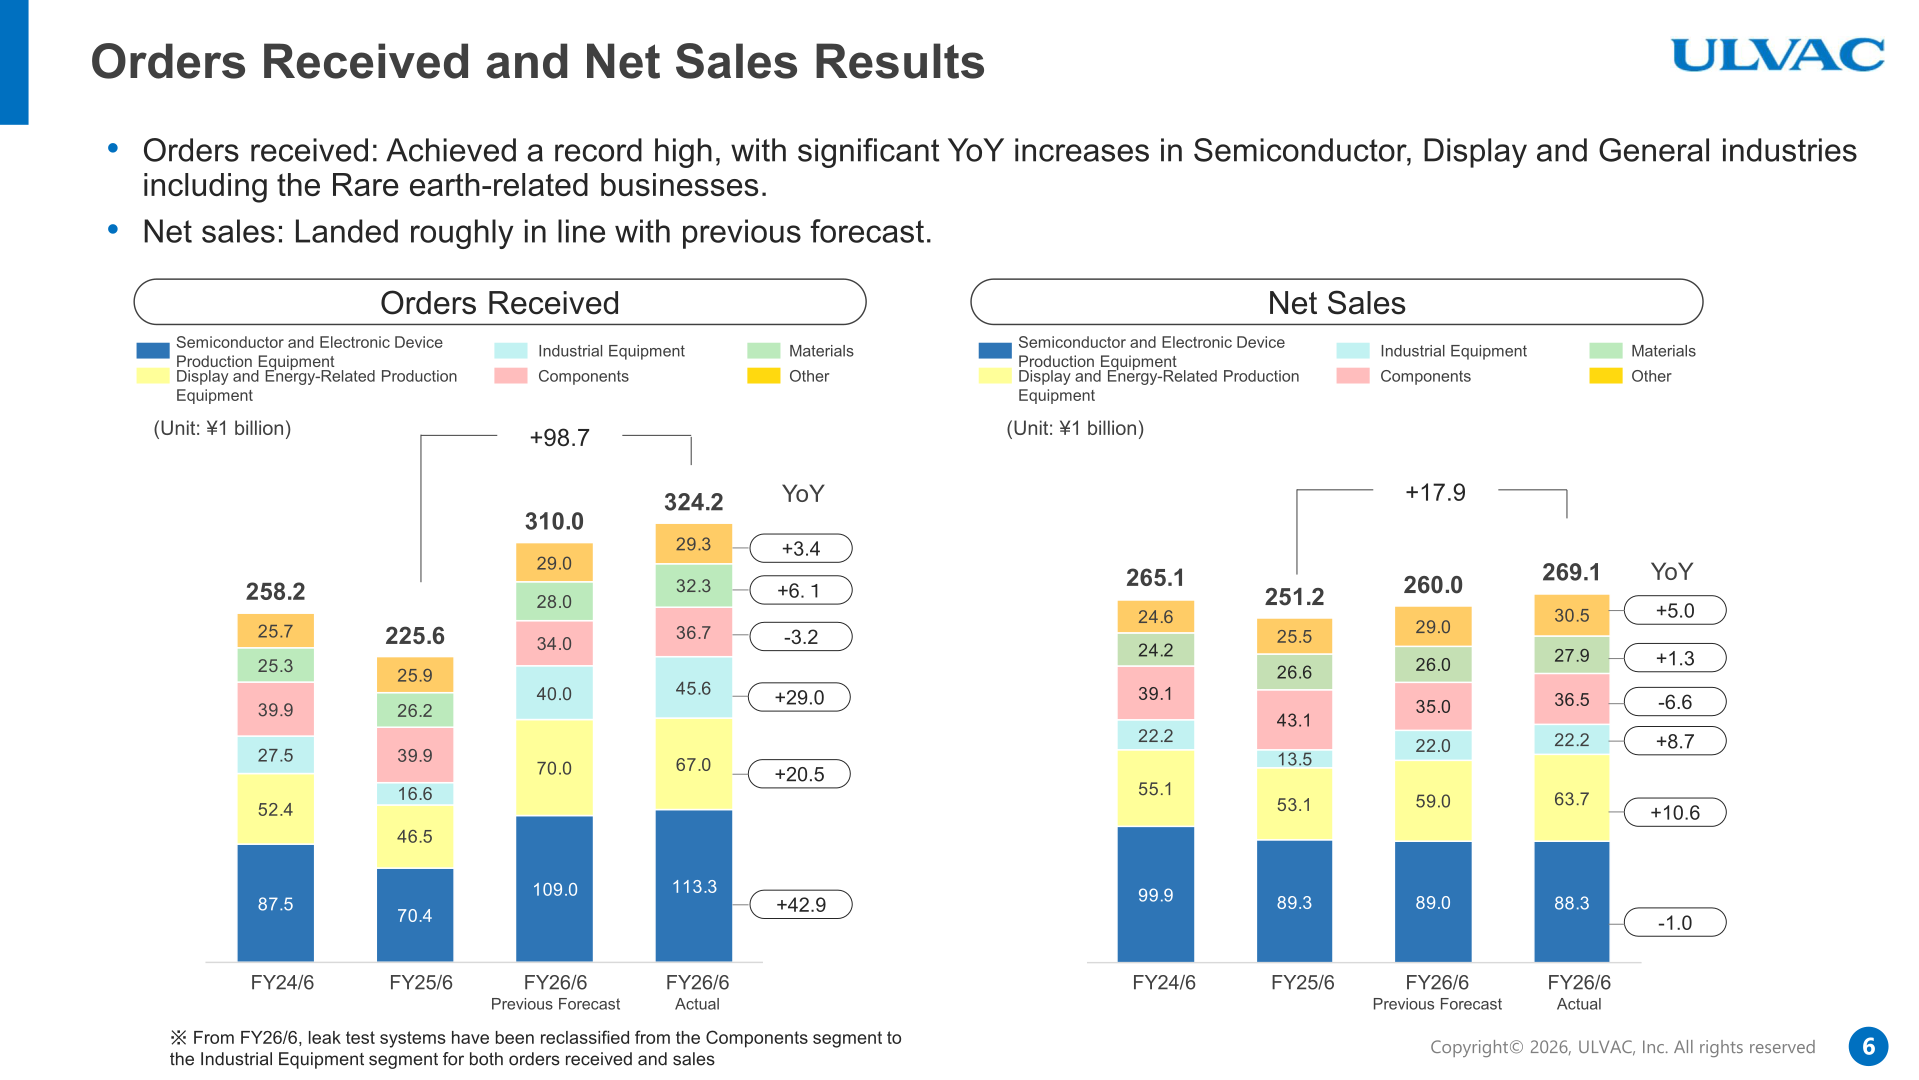
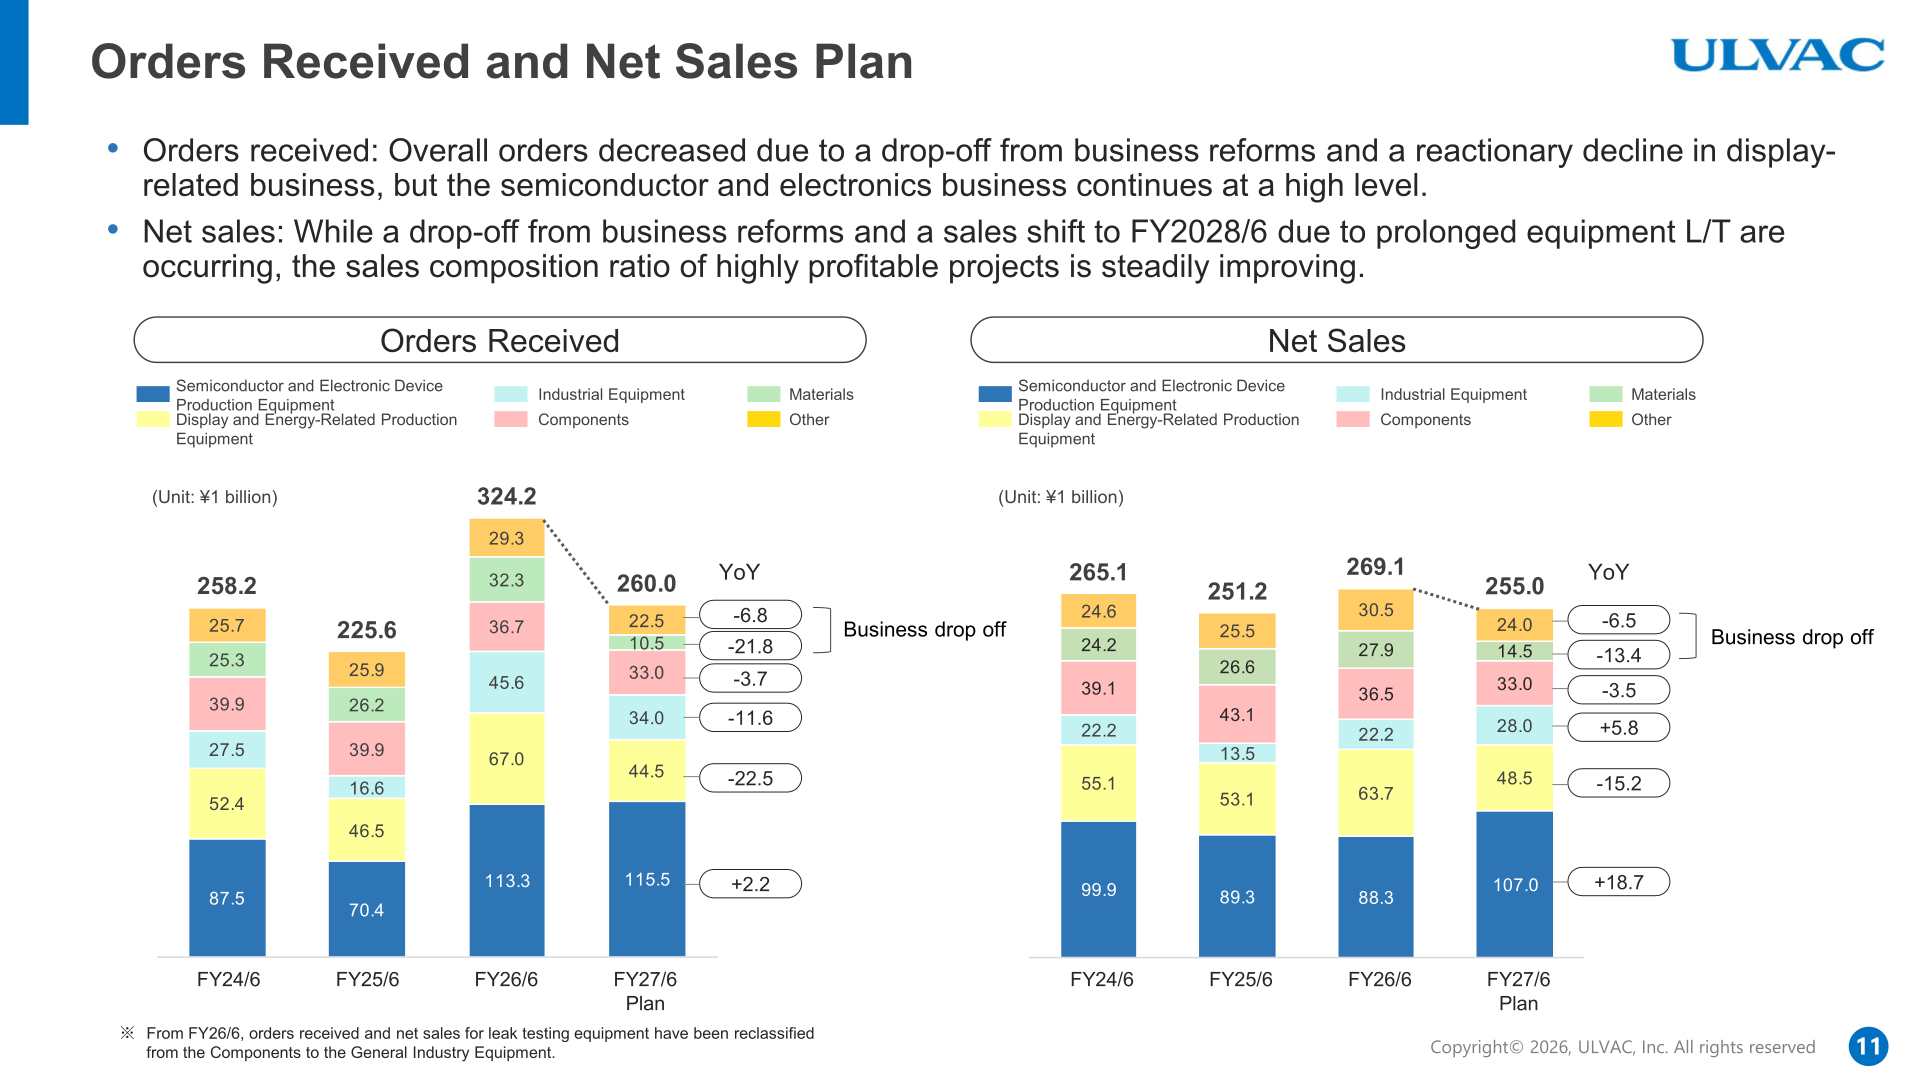
By product category, orders received in Semiconductor and Electronic Device Production Equipment were ¥113.3 billion (up ¥42.9 billion year on year), Display and Energy-Related Production Equipment ¥67.0 billion (up ¥20.5 billion), Industrial Equipment ¥45.6 billion (up ¥29.0 billion), Components ¥36.7 billion (down ¥3.2 billion), Materials ¥32.3 billion (up ¥6.1 billion) and Other ¥29.3 billion (up ¥3.4 billion). The company notes that orders achieved a record high with significant year-on-year increases in Semiconductor, Display and General industries including the Rare earth-related businesses. Net sales by category were Semiconductor and Electronic Device Production Equipment ¥88.3 billion (down ¥1.0 billion), Display and Energy-Related Production Equipment ¥63.7 billion (up ¥10.6 billion), Industrial Equipment ¥22.2 billion (up ¥8.7 billion), Components ¥36.5 billion (down ¥6.6 billion), Materials ¥27.9 billion (up ¥1.3 billion) and Other ¥30.5 billion (up ¥5.0 billion). From FY26/6, leak test systems have been reclassified from the Components segment to the Industrial Equipment segment for both orders received and sales. Orders received for vacuum furnaces (Rare earth magnet-related) rose to ¥18.2 billion in FY26/6 from ¥7.6 billion in FY25/6.
| Product Category (Unit: ¥1 billion) | Orders Received FY26/6 | Orders YoY | Net Sales FY26/6 | Net Sales YoY |
|---|---|---|---|---|
| Semiconductor and Electronic Device Production Equipment | 113.3 | +42.9 | 88.3 | -1.0 |
| Display and Energy-Related Production Equipment | 67.0 | +20.5 | 63.7 | +10.6 |
| Industrial Equipment | 45.6 | +29.0 | 22.2 | +8.7 |
| Components | 36.7 | -3.2 | 36.5 | -6.6 |
| Materials | 32.3 | +6.1 | 27.9 | +1.3 |
| Other | 29.3 | +3.4 | 30.5 | +5.0 |
| Total | 324.2 | +98.7 | 269.1 | +17.9 |
By region, net sales in FY26/6 were Japan ¥69.2 billion, China ¥102.9 billion, Korea ¥41.4 billion, Taiwan ¥31.4 billion, Other Asia ¥6.6 billion and Europe, others ¥17.6 billion. Capital expenditures in FY26/6 were ¥18.0 billion and R&D expenses (including those in manufacturing fixed costs and SG&A expenses) were ¥14.6 billion.
FY2027/6 Forecast
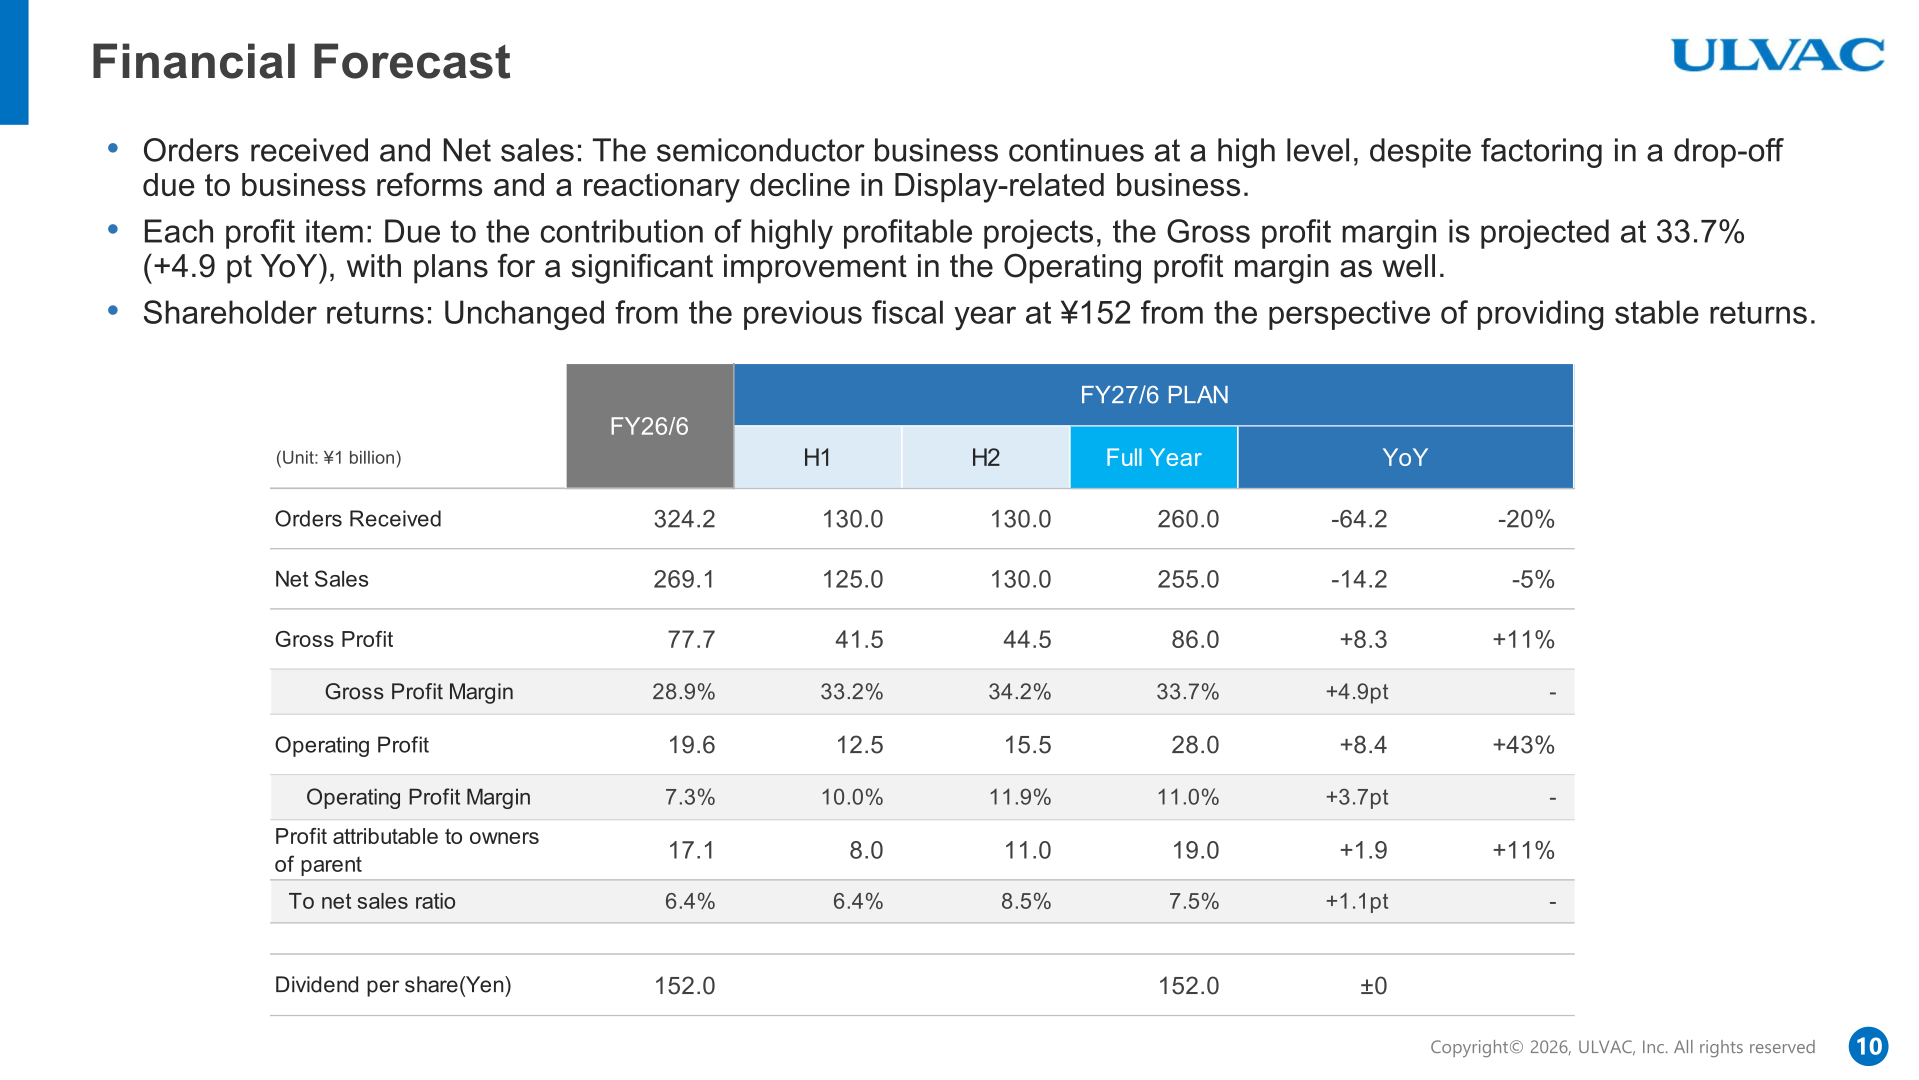
For FY2027/6, ULVAC plans orders received of ¥260.0 billion (down ¥64.2 billion, -20%), net sales of ¥255.0 billion (down ¥14.2 billion, -5%), gross profit of ¥86.0 billion (up ¥8.3 billion, +11%) with a gross profit margin of 33.7% (+4.9 pt), operating profit of ¥28.0 billion (up ¥8.4 billion, +43%) with an operating profit margin of 11.0% (+3.7 pt), and profit attributable to owners of parent of ¥19.0 billion (up ¥1.9 billion, +11%). By half, the plan calls for net sales of ¥125.0 billion in H1 and ¥130.0 billion in H2, and operating profit of ¥12.5 billion in H1 and ¥15.5 billion in H2. The company says the semiconductor business continues at a high level despite factoring in a drop-off due to business reforms and a reactionary decline in Display-related business, and that the gross profit margin is expected to reach the Value-up Plan level (33.7%) due to the contribution of highly profitable projects such as the Semiconductor and Rare earth-related businesses. In the operating profit bridge from ¥19.6 billion in FY26/6 to ¥28.0 billion in FY27/6, the company shows the dissipation of one-time factors (+5.8 billion, to ¥25.4 billion excluding one-time factors), business divestiture (-1.5), higher sales in Semiconductor & Electronics (+4.0), cost reduction from workforce optimization (+2.0) and higher personnel and R&D expenses (-1.9).
| Item (Unit: ¥1 billion) | FY26/6 Actual | FY27/6 Plan H1 | FY27/6 Plan H2 | FY27/6 Plan Full Year | YoY |
|---|---|---|---|---|---|
| Orders Received | 324.2 | 130.0 | 130.0 | 260.0 | -64.2 (-20%) |
| Net Sales | 269.1 | 125.0 | 130.0 | 255.0 | -14.2 (-5%) |
| Gross Profit | 77.7 | 41.5 | 44.5 | 86.0 | +8.3 (+11%) |
| Gross Profit Margin | 28.9% | 33.2% | 34.2% | 33.7% | +4.9pt |
| Operating Profit | 19.6 | 12.5 | 15.5 | 28.0 | +8.4 (+43%) |
| Operating Profit Margin | 7.3% | 10.0% | 11.9% | 11.0% | +3.7pt |
| Profit attributable to owners of parent | 17.1 | 8.0 | 11.0 | 19.0 | +1.9 (+11%) |
| To net sales ratio | 6.4% | 6.4% | 8.5% | 7.5% | +1.1pt |
| Dividend per share (Yen) | 152.0 | – | – | 152.0 | ±0 |
By product category, the FY27/6 plan for orders received is Semiconductor and Electronic Device Production Equipment ¥115.5 billion (up ¥2.2 billion), Display and Energy-Related Production Equipment ¥44.5 billion (down ¥22.5 billion), Industrial Equipment ¥34.0 billion (down ¥11.6 billion), Components ¥33.0 billion (down ¥3.7 billion), Materials ¥10.5 billion (down ¥21.8 billion) and Other ¥22.5 billion (down ¥6.8 billion). The net sales plan is Semiconductor and Electronic Device Production Equipment ¥107.0 billion (up ¥18.7 billion), Display and Energy-Related Production Equipment ¥48.5 billion (down ¥15.2 billion), Industrial Equipment ¥28.0 billion (up ¥5.8 billion), Components ¥33.0 billion (down ¥3.5 billion), Materials ¥14.5 billion (down ¥13.4 billion) and Other ¥24.0 billion (down ¥6.5 billion). The company attributes the declines in Materials and Other to business drop-off.
Shareholder Returns
The dividend per share for FY26/6 was ¥152, down ¥12 from ¥164 in FY25/6 and unchanged from the previous forecast. For FY27/6 the company plans a dividend per share of ¥152.0, unchanged from the previous fiscal year, which it describes as being from the perspective of providing stable returns. In its capital allocation framework (cumulative total for the 6 years FY2026/6 to FY2031/6), cash in is composed of operating cash flow (approx. 85%) and others such as business sales and borrowings (approx. 15%), and cash out is allocated approx. 70% to growth and strategic investments and approx. 30% to shareholder returns; the company states that it aims to further expand shareholder returns.
| Item | FY25/6 | FY26/6 | FY27/6 Plan |
|---|---|---|---|
| Dividend per share (Yen) | 164 | 152 | 152.0 |
Medium-Term Plan (Value-up Plan) Progress
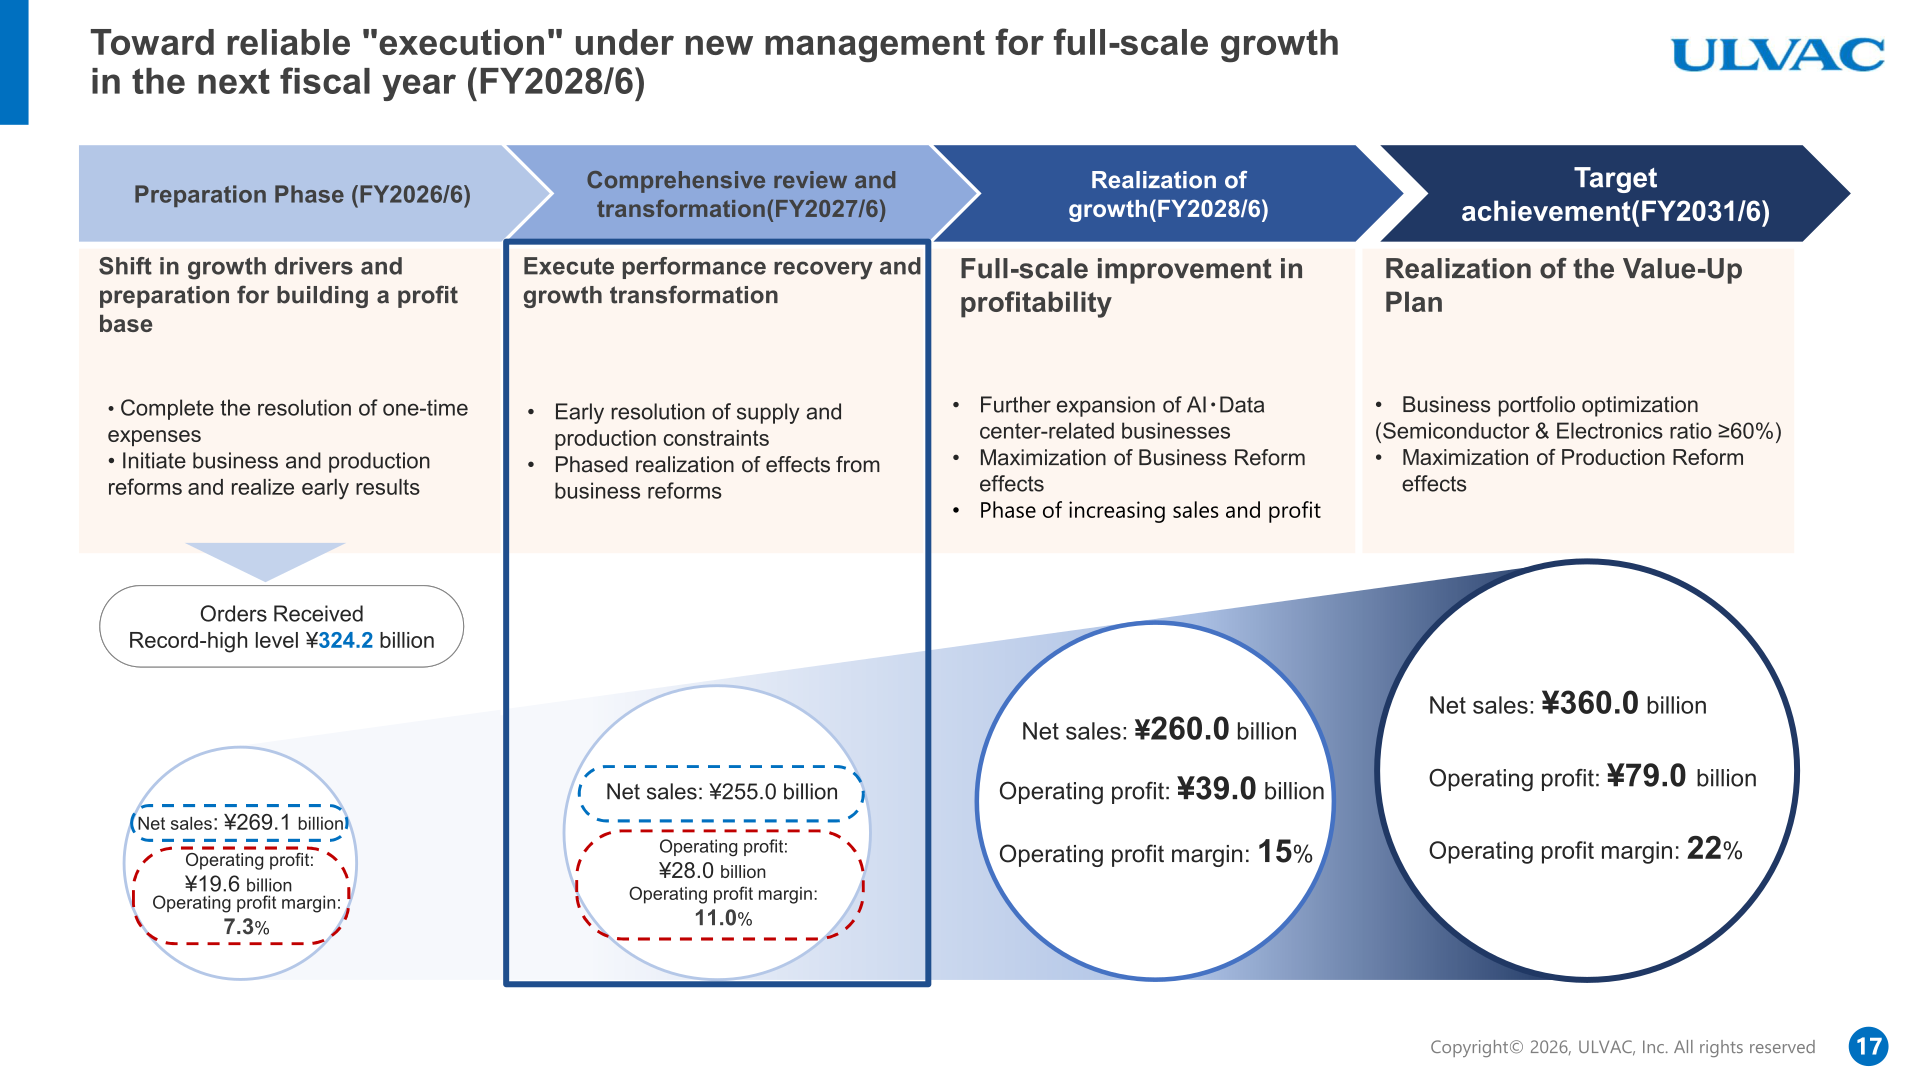
Reviewing the first year of the Value-up Plan (formulated in August 2025), the company lists as achievements record-high orders received of ¥324.2 billion, a semiconductor business that significantly outperformed the market, restructuring of display-related and low-margin businesses, reorganization of production bases, promotion of modular design, a 20% reduction in design man-hours and a ¥1 billion reduction in variable costs. As challenges, it cites that growth in net sales and operating profit is limited relative to the growth in orders received, that material supply risks and supply chain constraints emerged, and that shortening of manufacturing lead times is only halfway complete. In response, the company positions FY2027/6 as a year of “comprehensive review and transformation” leading to “realizing growth” in FY2028/6 and onward, defining AI and data center-related businesses as its strategic theme. Business reforms include the deconsolidation of 4 companies in FY2026/6 and the remaining 4 of 8 targeted in FY2027/6, completion of the Tohoku plant restructuring in FY2026/6 and Korea plant restructuring in FY2027/6, and workforce optimization including voluntary retirement for a reduction of approx. ¥2 billion to be allocated to R&D investments. The plan targets net sales of over ¥260.0 billion and operating profit of ¥39.0 billion (operating profit margin 15%) in FY2028/6, and net sales of ¥360.0 billion and operating profit of ¥79.0 billion (operating profit margin 22%) in FY2031/6. In the Semiconductor and Electronics field, the company targets orders received of ¥140.0 billion in FY28/6 and over ¥200 billion in FY31/6, and it aims for vacuum furnace (Rare earth magnet-related) orders of ¥20.0 billion or more in FY27/6 with potential of ¥30.0 billion or more from FY28/6.
This article is an analysis based on publicly available information and is not a recommendation to buy or sell any specific securities. Investment decisions are your own responsibility.
![[Obayashi] Investors’ Guide 2026 — The Complete 24-Article Breakdown](https://japan-equity.com/wp-content/uploads/2026/07/hub_cover-1024x1024.png)
![[Obayashi] IR & SR Policy — Feeding Dialogue Back into Management](https://japan-equity.com/wp-content/uploads/2026/07/p32_sq-1024x1024.jpg)
![[Obayashi] Domestic Civil Engineering — Resilience Spending Supports 9.6% Margin](https://japan-equity.com/wp-content/uploads/2026/07/p11_sq-1024x1024.jpg)
![[Obayashi] Overseas Construction — Orders Reach ¥1.2tn](https://japan-equity.com/wp-content/uploads/2026/07/p15_sq-1024x1024.jpg)
![[Obayashi] Share Price & External Ratings — vs TOPIX, ESG Index Inclusion](https://japan-equity.com/wp-content/uploads/2026/07/p40_sq-1024x1024.jpg)
![[Construction] ¥75.5tn Investment, Shrinking Workforce — Big-5 Market Share](https://japan-equity.com/wp-content/uploads/2026/07/p12_sq-1024x1024.jpg)



![[Obayashi] Capital Policy & Shareholder Returns — ROE 10%+, DOE ~5%, ¥100bn Buyback](https://japan-equity.com/wp-content/uploads/2026/07/p27_sq-1024x1024.jpg)
![[Obayashi] Reducing Cross-Shareholdings — ¥285.2bn Sold in Five Years](https://japan-equity.com/wp-content/uploads/2026/07/p29_sq-1024x1024.jpg)
![[Obayashi] ¥750bn Investment Plan — ¥300bn to Development, ¥190bn to Tech/DX](https://japan-equity.com/wp-content/uploads/2026/07/p30_sq-1024x1024.jpg)
![[Obayashi] MTP2022 KPIs — Operating Profit ~2x Target, ROE 14.4%](https://japan-equity.com/wp-content/uploads/2026/07/p25_sq-1024x1024.jpg)
![[Obayashi] Cash Allocation — ¥420bn Investment CF Over Five Years](https://japan-equity.com/wp-content/uploads/2026/07/p26_sq-1024x1024.jpg)
![[Obayashi] Green Energy — 44 Plants, 344MW, and the Green Hydrogen Challenge](https://japan-equity.com/wp-content/uploads/2026/07/p21_sq-1024x1024.jpg)
![[Obayashi] Tackling the Labor Shortage — Robotics Construction®](https://japan-equity.com/wp-content/uploads/2026/07/p14_sq-1024x1024.jpg)
