
This article is based on publicly available IR materials and is not a recommendation to buy or sell any specific securities.
OMRON Corporation (6645) released its FY2025 earnings results briefing on May 13, 2026, covering the fiscal year ended March 31, 2026. On an after-reclassification basis (consolidated results excluding the Device & Module Solutions Business, DMB, which is being treated as a discontinued operation in conjunction with its carve-out and equity transfer), net revenue rose 7.3% year on year to ¥767.4 bn and operating income rose 12.1% to ¥59.9 bn under US-GAAP. Net income attributable to OMRON shareholders increased 75.1% to ¥28.5 bn. Growth was driven by the Industrial Automation Business (IAB), where a recovery in the customer base and continued expansion of AI-related demand resulted in significant increases in both revenue and profit. For FY2026, OMRON plans revenue of ¥820.0 bn and operating profit of ¥62.0 bn under IFRS, and forecasts a full-year dividend of ¥110, up ¥6 from the previous year.
Note: OMRON is changing its accounting standard from US-GAAP to IFRS from FY2026. FY2025 and prior consolidated results in this article are prepared under US-GAAP, while the FY2026 forecast is prepared under IFRS; the FY2025 reference figures shown alongside the forecast are unaudited IFRS-adjusted figures (a simplified conversion from US-GAAP), as presented in the company’s materials.
Consolidated Results (Full-Year Actual, After Reclassification)
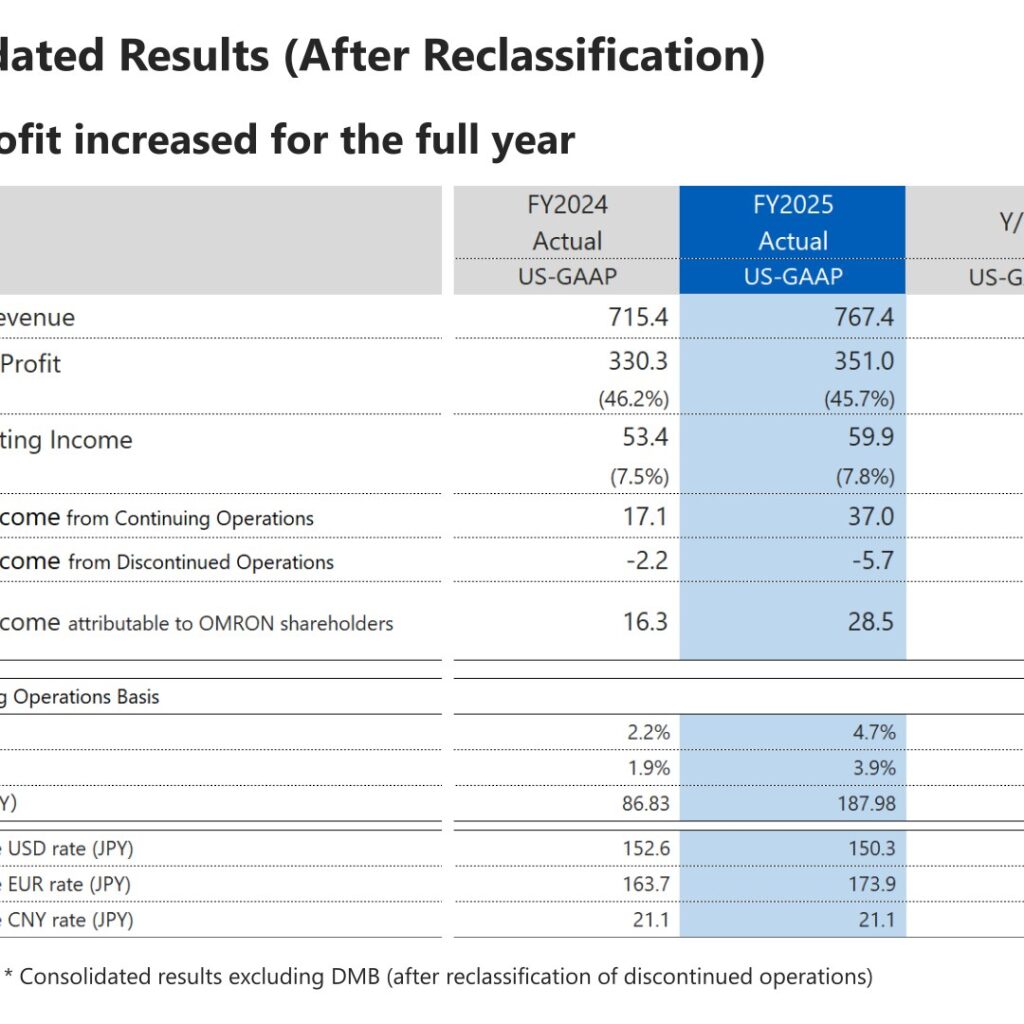
Revenue and profit increased for the full year. Net revenue was ¥767.4 bn (+7.3% Y/Y), gross profit was ¥351.0 bn (+6.3%) with the gross profit margin at 45.7% (-0.4%pt), and operating income was ¥59.9 bn (+12.1%) with the operating margin at 7.8% (+0.3%pt). Net income from continuing operations more than doubled to ¥37.0 bn (+116.3%), while net income from discontinued operations was -¥5.7 bn. Net income attributable to OMRON shareholders was ¥28.5 bn (+75.1%). On a continuing operations basis, ROE was 4.7% (+2.5pt), ROIC was 3.9% (+2.0pt) and EPS was ¥187.98 (+¥101.1). Average exchange rates for the year were ¥150.3 to the US dollar, ¥173.9 to the euro and ¥21.1 to the Chinese yuan.
| Item (¥bn, US-GAAP, after reclassification) | FY2024 Actual | FY2025 Actual | Y/Y |
|---|---|---|---|
| Net Revenue | 715.4 | 767.4 | +7.3% |
| Gross Profit | 330.3 | 351.0 | +6.3% |
| Gross Profit margin | 46.2% | 45.7% | -0.4%pt |
| Operating Income | 53.4 | 59.9 | +12.1% |
| Operating Income margin | 7.5% | 7.8% | +0.3%pt |
| Net Income from Continuing Operations | 17.1 | 37.0 | +116.3% |
| Net Income from Discontinued Operations | -2.2 | -5.7 | – |
| Net Income attributable to OMRON shareholders | 16.3 | 28.5 | +75.1% |
| ROE (continuing operations basis) | 2.2% | 4.7% | +2.5pt |
| ROIC (continuing operations basis) | 1.9% | 3.9% | +2.0pt |
| EPS (JPY, continuing operations basis) | 86.83 | 187.98 | +101.1 |
For reference, on a before-reclassification basis including DMB (not disclosed under US-GAAP; provided by the company for comparison with the FY2025 forecast), net revenue was ¥868.2 bn versus the forecast of ¥855.0 bn (+1.5%), operating income was ¥63.6 bn versus ¥60.0 bn (+6.0%), and net income attributable to OMRON shareholders was ¥28.5 bn versus ¥29.0 bn (-1.8%). EPS on this basis was ¥144.80 versus the forecast of ¥147.40.
In the company’s analysis of the year-on-year change in operating income (after reclassification), revenue growth at IAB drove performance and significantly increased gross profit. Operating income rose by ¥6.5 bn from ¥53.4 bn to ¥59.9 bn: gross profit increase on higher revenue contributed +¥21.4 bn, a lower gross profit margin was -¥5.4 bn, increased fixed costs were -¥12.6 bn (labor costs -¥4.7 bn / expenses -¥8.0 bn), and the forex impact was +¥3.1 bn. By business company, revenue changed by +¥41.0 bn at IAB, -¥2.4 bn at HCB, +¥0.6 bn at SSB and +¥8.4 bn at DSB.
Segment Results
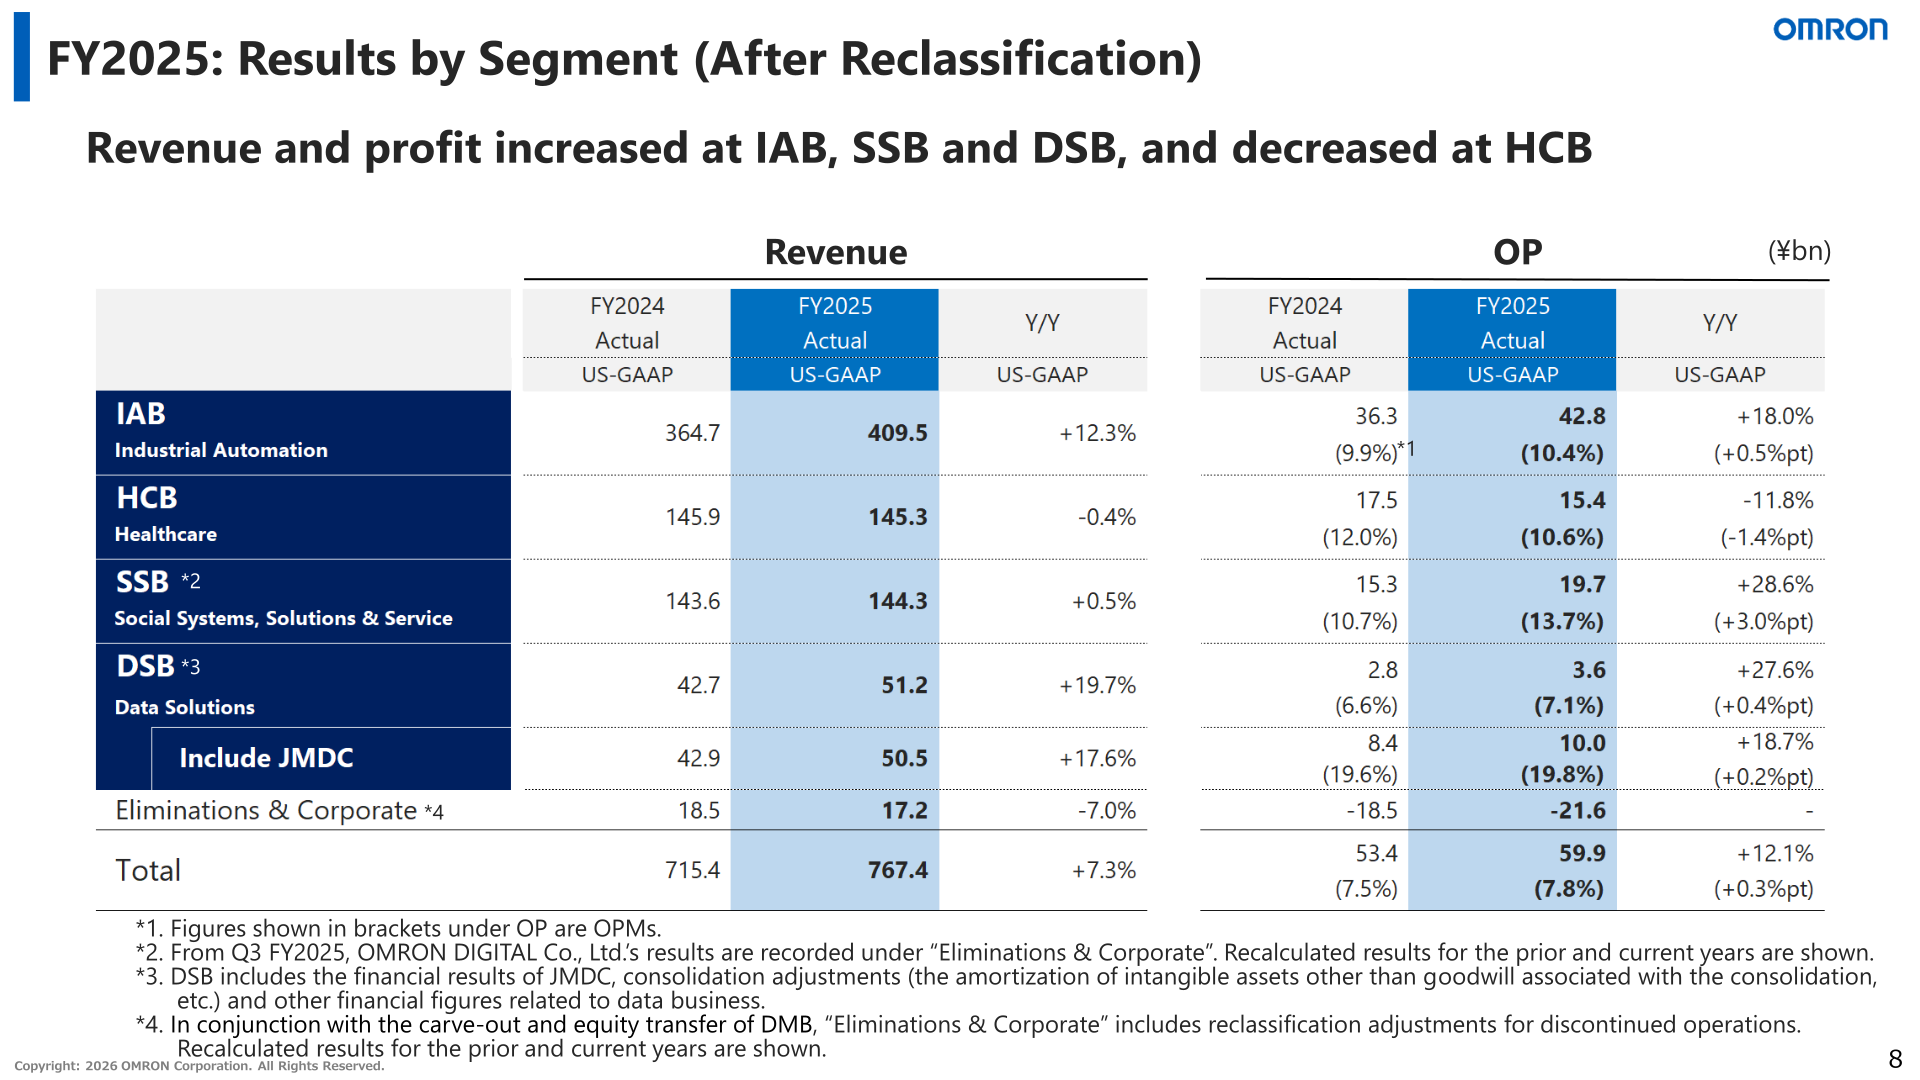
Revenue and profit increased at IAB, SSB and DSB, and decreased at HCB. IAB (Industrial Automation) revenue rose 12.3% to ¥409.5 bn and operating income rose 18.0% to ¥42.8 bn (OPM 10.4%, +0.5%pt). HCB (Healthcare) revenue was ¥145.3 bn (-0.4%) with operating income of ¥15.4 bn (-11.8%, OPM 10.6%). SSB (Social Systems, Solutions & Service) revenue was ¥144.3 bn (+0.5%) with operating income of ¥19.7 bn (+28.6%, OPM 13.7%). DSB (Data Solutions) revenue rose 19.7% to ¥51.2 bn with operating income of ¥3.6 bn (+27.6%, OPM 7.1%); DSB includes JMDC, whose revenue was ¥50.5 bn (+17.6%) and operating income ¥10.0 bn (+18.7%, OPM 19.8%). From Q3 FY2025, OMRON DIGITAL Co., Ltd.’s results are recorded under Eliminations & Corporate, and Eliminations & Corporate also includes reclassification adjustments for discontinued operations; recalculated results for the prior and current years are shown.
| Segment (¥bn, US-GAAP, after reclassification) | Revenue FY2024 | Revenue FY2025 | Y/Y | OP FY2024 (OPM) | OP FY2025 (OPM) | Y/Y |
|---|---|---|---|---|---|---|
| IAB (Industrial Automation) | 364.7 | 409.5 | +12.3% | 36.3 (9.9%) | 42.8 (10.4%) | +18.0% (+0.5%pt) |
| HCB (Healthcare) | 145.9 | 145.3 | -0.4% | 17.5 (12.0%) | 15.4 (10.6%) | -11.8% (-1.4%pt) |
| SSB (Social Systems, Solutions & Service) | 143.6 | 144.3 | +0.5% | 15.3 (10.7%) | 19.7 (13.7%) | +28.6% (+3.0%pt) |
| DSB (Data Solutions) | 42.7 | 51.2 | +19.7% | 2.8 (6.6%) | 3.6 (7.1%) | +27.6% (+0.4%pt) |
| of which JMDC | 42.9 | 50.5 | +17.6% | 8.4 (19.6%) | 10.0 (19.8%) | +18.7% (+0.2%pt) |
| Eliminations & Corporate | 18.5 | 17.2 | -7.0% | -18.5 | -21.6 | – |
| Total | 715.4 | 767.4 | +7.3% | 53.4 (7.5%) | 59.9 (7.8%) | +12.1% (+0.3%pt) |
Within IAB, the company states that initiatives for regrowth are gradually yielding results, with a shift toward a full-scale recovery phase. IAB revenue grew 12% year on year to ¥409.5 bn (FY2024: ¥364.7 bn, after reclassification of discontinued operations). Semiconductor domain revenue rose 20% and secondary battery domain revenue rose 27% year on year on the capture of AI demand, and AXI (X-ray inspection systems) revenue rose 140%. Revenue from new products launched in FY2024-2025 was ¥17.0 bn in FY2025, and other domain revenue grew 6%. IAB order levels in Q4 continued an upward trend from the previous quarter, driven by the capture of AI demand, including advanced semiconductor investment and secondary battery investment for data centers.
FY2026 Forecast
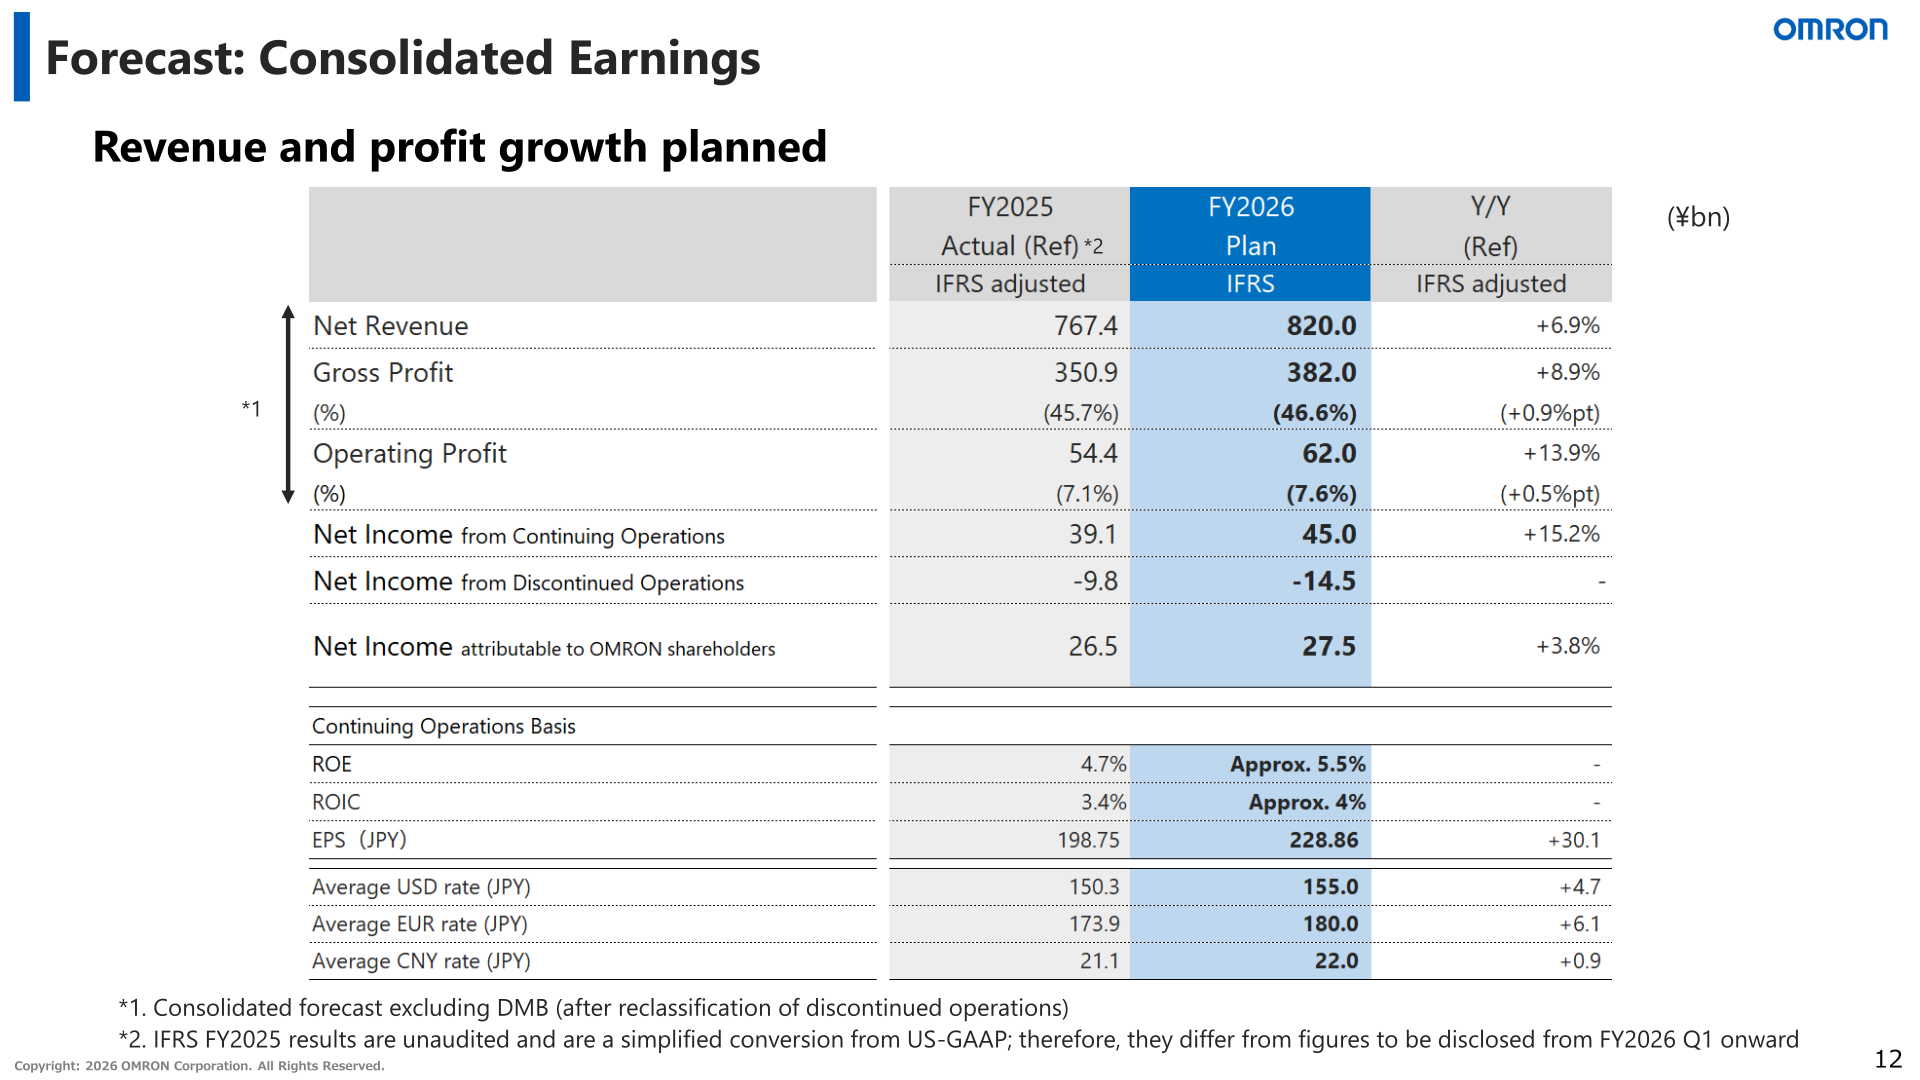
OMRON plans revenue and profit growth in FY2026 under IFRS, excluding DMB. Net revenue is planned at ¥820.0 bn (+6.9% versus the IFRS-adjusted FY2025 reference figure of ¥767.4 bn), gross profit at ¥382.0 bn (+8.9%; margin 46.6%, +0.9%pt), and operating profit at ¥62.0 bn (+13.9%; margin 7.6%, +0.5%pt). Net income from continuing operations is planned at ¥45.0 bn (+15.2%), net income from discontinued operations at -¥14.5 bn, and net income attributable to OMRON shareholders at ¥27.5 bn (+3.8%). ROE is planned at approx. 5.5% and ROIC at approx. 4% on a continuing operations basis, with EPS of ¥228.86. Exchange rate assumptions are ¥155.0 to the US dollar, ¥180.0 to the euro and ¥22.0 to the Chinese yuan. The company expects overall demand trends to be firm in each segment, but recognizes rising uncertainty in the business environment as a result of conflict in the Middle East, and a certain level of cost impact is factored into the plan.
| Item (¥bn) | FY2025 Actual (Ref, IFRS adjusted) | FY2026 Plan (IFRS) | Y/Y (Ref) |
|---|---|---|---|
| Net Revenue | 767.4 | 820.0 | +6.9% |
| Gross Profit | 350.9 | 382.0 | +8.9% |
| Gross Profit margin | 45.7% | 46.6% | +0.9%pt |
| Operating Profit | 54.4 | 62.0 | +13.9% |
| Operating Profit margin | 7.1% | 7.6% | +0.5%pt |
| Net Income from Continuing Operations | 39.1 | 45.0 | +15.2% |
| Net Income from Discontinued Operations | -9.8 | -14.5 | – |
| Net Income attributable to OMRON shareholders | 26.5 | 27.5 | +3.8% |
| ROE (continuing operations basis) | 4.7% | Approx. 5.5% | – |
| ROIC (continuing operations basis) | 3.4% | Approx. 4% | – |
| EPS (JPY, continuing operations basis) | 198.75 | 228.86 | +30.1 |
| Average USD rate (JPY) | 150.3 | 155.0 | +4.7 |
| Average EUR rate (JPY) | 173.9 | 180.0 | +6.1 |
| Average CNY rate (JPY) | 21.1 | 22.0 | +0.9 |
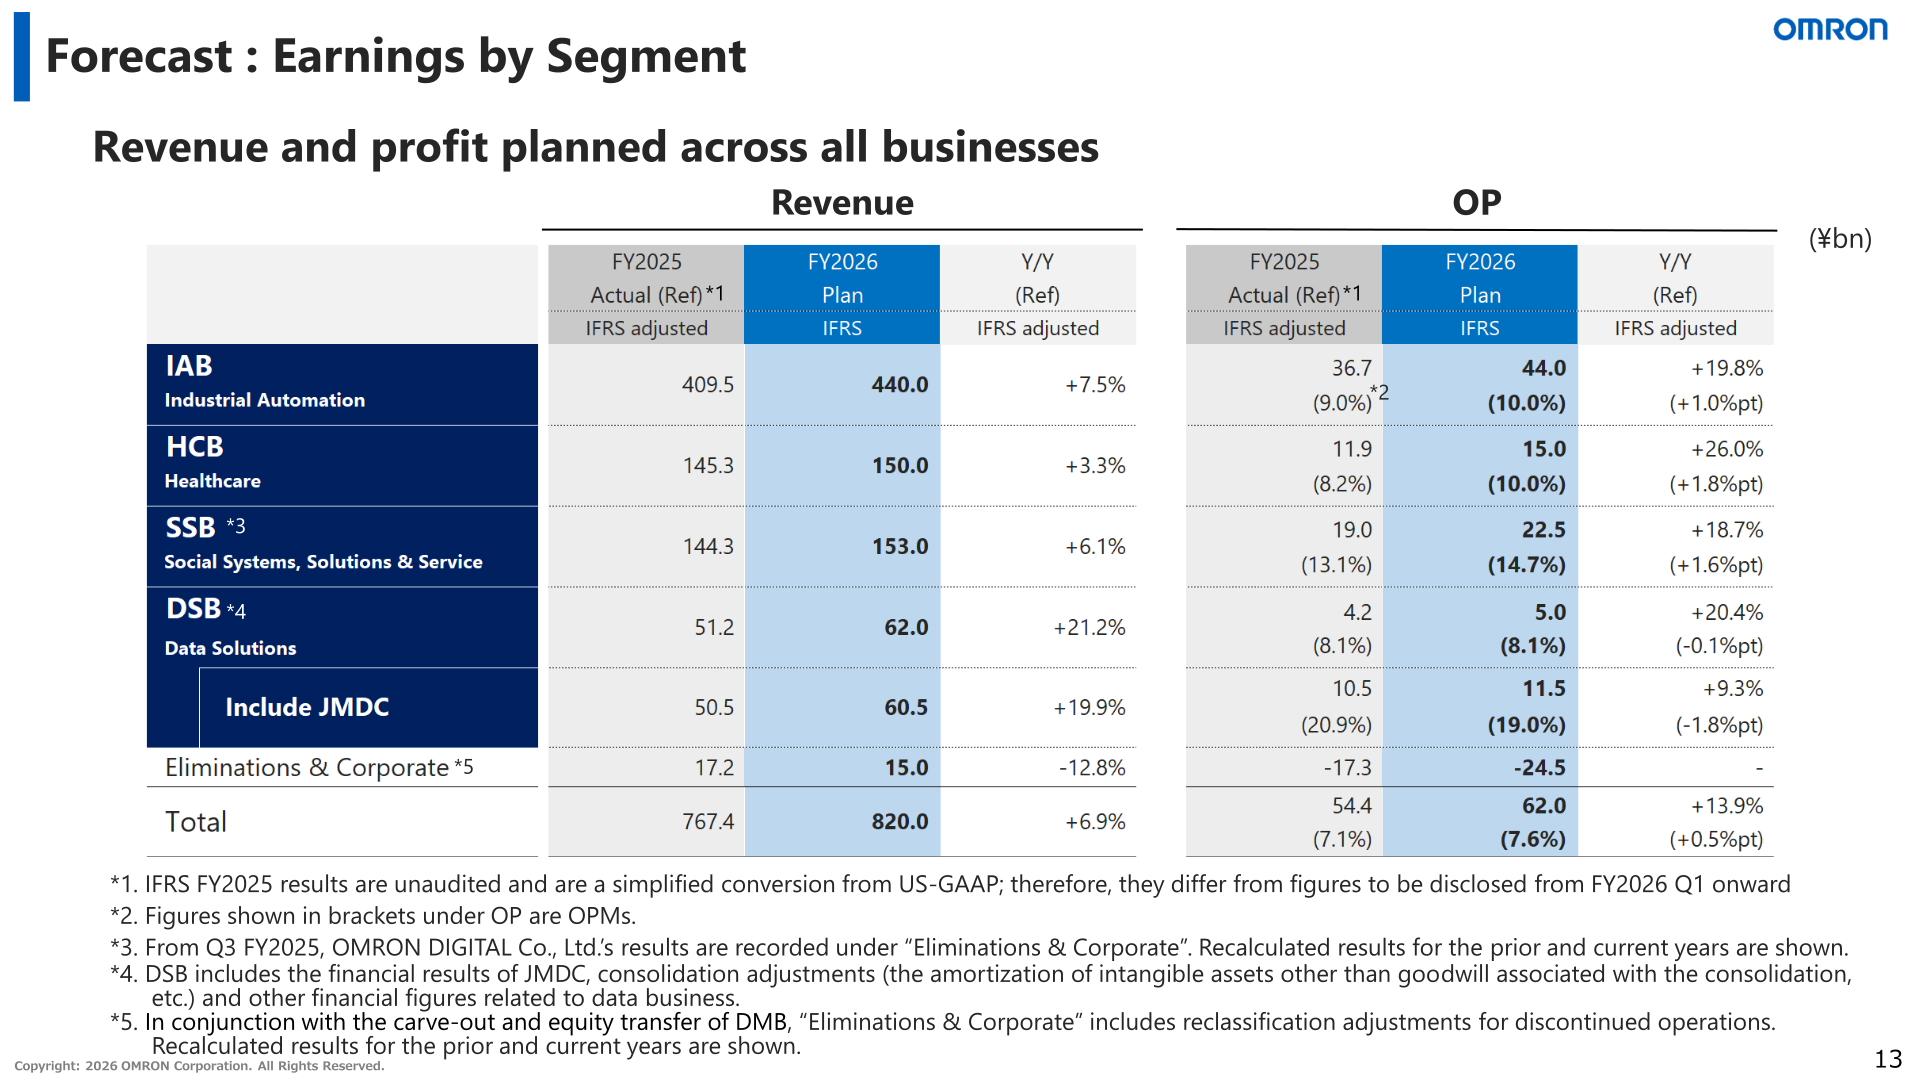
By segment, revenue and profit growth is planned across all businesses. IAB is planned at revenue of ¥440.0 bn (+7.5%) and operating profit of ¥44.0 bn (+19.8%; OPM 10.0%, +1.0%pt); the company expects IAB to achieve significant revenue and profit growth by capturing expanding investment demand through initiatives such as its solutions and new product launches. HCB is planned at revenue of ¥150.0 bn (+3.3%) and operating profit of ¥15.0 bn (+26.0%; OPM 10.0%). SSB is planned at revenue of ¥153.0 bn (+6.1%) and operating profit of ¥22.5 bn (+18.7%; OPM 14.7%). DSB is planned at revenue of ¥62.0 bn (+21.2%) and operating profit of ¥5.0 bn (+20.4%; OPM 8.1%), including JMDC at revenue of ¥60.5 bn (+19.9%) and operating profit of ¥11.5 bn (+9.3%; OPM 19.0%).
| Segment (¥bn) | Revenue FY2025 Actual (Ref, IFRS adjusted) | Revenue FY2026 Plan (IFRS) | Y/Y | OP FY2025 Actual (Ref, IFRS adjusted) (OPM) | OP FY2026 Plan (IFRS) (OPM) | Y/Y |
|---|---|---|---|---|---|---|
| IAB (Industrial Automation) | 409.5 | 440.0 | +7.5% | 36.7 (9.0%) | 44.0 (10.0%) | +19.8% (+1.0%pt) |
| HCB (Healthcare) | 145.3 | 150.0 | +3.3% | 11.9 (8.2%) | 15.0 (10.0%) | +26.0% (+1.8%pt) |
| SSB (Social Systems, Solutions & Service) | 144.3 | 153.0 | +6.1% | 19.0 (13.1%) | 22.5 (14.7%) | +18.7% (+1.6%pt) |
| DSB (Data Solutions) | 51.2 | 62.0 | +21.2% | 4.2 (8.1%) | 5.0 (8.1%) | +20.4% (-0.1%pt) |
| of which JMDC | 50.5 | 60.5 | +19.9% | 10.5 (20.9%) | 11.5 (19.0%) | +9.3% (-1.8%pt) |
| Eliminations & Corporate | 17.2 | 15.0 | -12.8% | -17.3 | -24.5 | – |
| Total | 767.4 | 820.0 | +6.9% | 54.4 (7.1%) | 62.0 (7.6%) | +13.9% (+0.5%pt) |
In the company’s analysis of the planned year-on-year change in operating profit, profit growth is expected through revenue growth and gross profit margin improvement while continuing growth investments. Operating profit is planned to rise by ¥7.6 bn from the IFRS-adjusted ¥54.4 bn to ¥62.0 bn: gross profit increase on higher revenue +¥18.8 bn, higher gross profit margin +¥5.9 bn, increased fixed costs -¥19.3 bn (labor costs -¥7.1 bn / expenses -¥12.2 bn), forex impact +¥2.1 bn, and a decrease in other expenses +¥0.1 bn. Revenue by business company is planned to change by +¥22.1 bn at IAB, +¥0.3 bn at HCB, +¥9.0 bn at SSB and +¥10.8 bn at DSB. Forex sensitivities for FY2026 (impact of a 1 yen move, full year) are approx. ¥1.1 bn on revenue and approx. ¥0.0 bn on operating profit for the US dollar, and approx. ¥0.6 bn on revenue and approx. ¥0.3 bn on operating profit for the euro; for the Chinese yuan (impact of a 0.1 yen move), approx. ¥0.6 bn on revenue and approx. ¥0.1 bn on operating profit.
Shareholder Returns
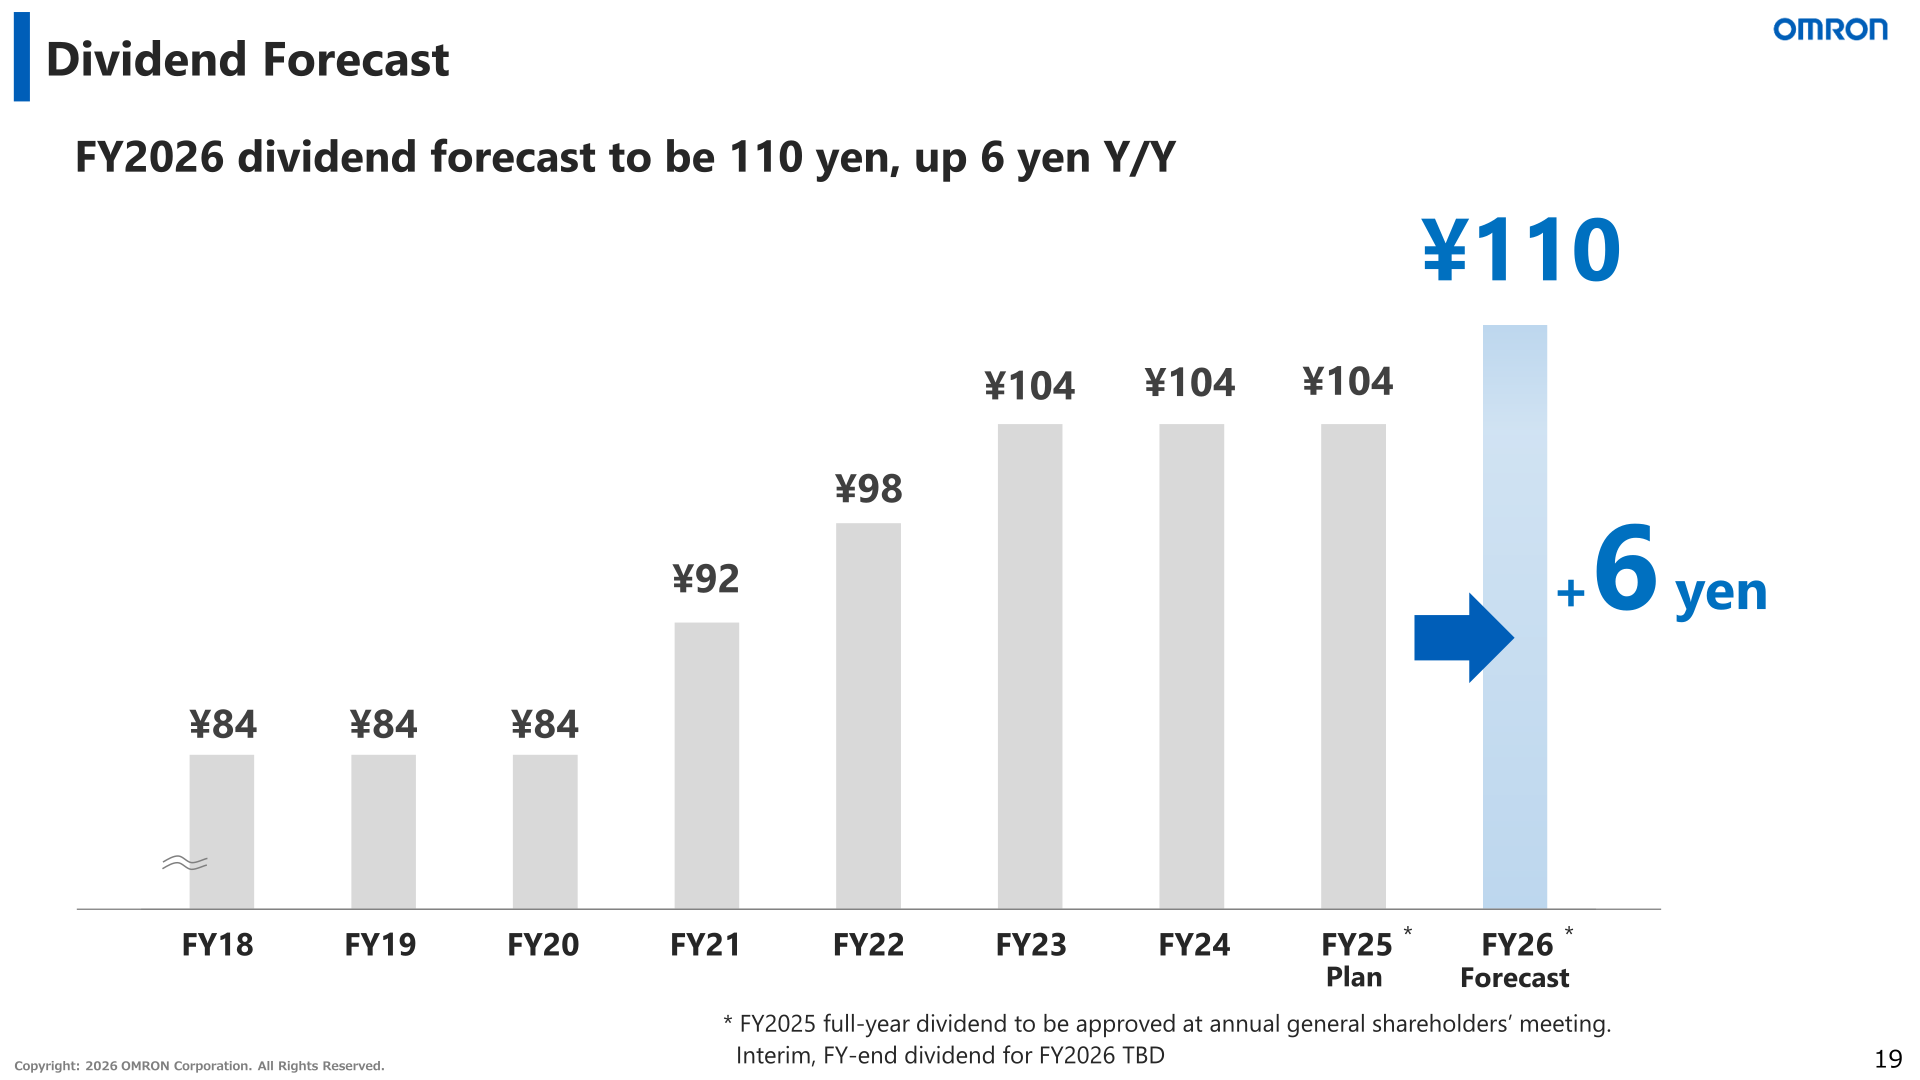
The FY2025 full-year dividend is planned at ¥104 per share, unchanged from FY2024 and FY2023, and is to be approved at the annual general shareholders’ meeting. For FY2026, OMRON forecasts a full-year dividend of ¥110, up ¥6 year on year; the split between interim and fiscal year-end dividends for FY2026 is TBD. On capital allocation, the company states that its business portfolio review enables reinvestment in high-growth, high-margin businesses, and that it will optimize allocation to shareholder returns and strategic investment subject to investment opportunities. Its criteria for share buybacks are (1) share price level, when the share price is at levels considered to be undervalued relative to intrinsic value; (2) financial soundness, when OMRON can maintain its equity ratio and financial capacity above a certain level even where the operating environment has deteriorated or risk assets are impaired; and (3) availability of investment opportunities, focusing on improving capital efficiency through buybacks when promising investment opportunities are limited. M&A will focus on IAB-related domains, with particular priority on M&A that contributes to strengthening the customer base.
Mid-Term Roadmap / Topics
The briefing marks the beginning of OMRON’s Mid-Term Roadmap, with three key messages: accelerating revenue and profit growth in IAB, progress in DSB (data health segment), and the share transfer of DMB and capital allocation. In IAB, FY2026 targets include AXI revenue growth of +30% or more year on year, FY2026 new product revenue (cumulative revenue of products released after FY2024) of ¥28 bn or more (+65% Y/Y), and Customer Base Map coverage expansion of +14% year on year (FY2025: +7%), with a plan to launch 22 new product models in FY2026. The company aims to improve IAB’s OPM by +1.0%pt from FY2025 to FY2026 and to raise OPM in a stepwise fashion from FY2027 onward, enhancing the probability of achieving its FY2030 IAB OPM goal of 16.0%.
In the data service business (data healthcare), OMRON is developing a highly accurate algorithm to predict future disease risk, with accuracy validation for some diseases completed at levels where commercialization is possible (AUC of approx. 0.9). On portfolio restructuring, OMRON will carve out and transfer the equity of the Device & Module Solutions Business (DMB) and related domestic and overseas subsidiaries, concentrating on 13 focus businesses. DMB’s FY2025 revenue was ¥100.8 bn with operating profit of ¥3.7 bn (FY2024: revenue ¥86.4 bn, operating profit ¥0.6 bn), on a discontinued operations basis. The absorption-type company split contract and equity transfer contract were dated March 30, 2026; the effective date for the absorption-type split is planned for July 1, 2026 and the effective date for the transfer of equity is planned for October 1, 2026. The transfer price is to be finalized at the time of closing.
This article is an analysis based on publicly available information and is not a recommendation to buy or sell any specific securities. Investment decisions are your own responsibility.
![[Obayashi] Investors’ Guide 2026 — The Complete 24-Article Breakdown](https://japan-equity.com/wp-content/uploads/2026/07/hub_cover-1024x1024.png)
![[Obayashi] IR & SR Policy — Feeding Dialogue Back into Management](https://japan-equity.com/wp-content/uploads/2026/07/p32_sq-1024x1024.jpg)
![[Obayashi] Domestic Civil Engineering — Resilience Spending Supports 9.6% Margin](https://japan-equity.com/wp-content/uploads/2026/07/p11_sq-1024x1024.jpg)
![[Obayashi] Overseas Construction — Orders Reach ¥1.2tn](https://japan-equity.com/wp-content/uploads/2026/07/p15_sq-1024x1024.jpg)
![[Obayashi] Share Price & External Ratings — vs TOPIX, ESG Index Inclusion](https://japan-equity.com/wp-content/uploads/2026/07/p40_sq-1024x1024.jpg)
![[Construction] ¥75.5tn Investment, Shrinking Workforce — Big-5 Market Share](https://japan-equity.com/wp-content/uploads/2026/07/p12_sq-1024x1024.jpg)



![[Obayashi] Capital Policy & Shareholder Returns — ROE 10%+, DOE ~5%, ¥100bn Buyback](https://japan-equity.com/wp-content/uploads/2026/07/p27_sq-1024x1024.jpg)
![[Obayashi] Reducing Cross-Shareholdings — ¥285.2bn Sold in Five Years](https://japan-equity.com/wp-content/uploads/2026/07/p29_sq-1024x1024.jpg)
![[Obayashi] ¥750bn Investment Plan — ¥300bn to Development, ¥190bn to Tech/DX](https://japan-equity.com/wp-content/uploads/2026/07/p30_sq-1024x1024.jpg)
![[Obayashi] MTP2022 KPIs — Operating Profit ~2x Target, ROE 14.4%](https://japan-equity.com/wp-content/uploads/2026/07/p25_sq-1024x1024.jpg)
![[Obayashi] Cash Allocation — ¥420bn Investment CF Over Five Years](https://japan-equity.com/wp-content/uploads/2026/07/p26_sq-1024x1024.jpg)
![[Obayashi] Green Energy — 44 Plants, 344MW, and the Green Hydrogen Challenge](https://japan-equity.com/wp-content/uploads/2026/07/p21_sq-1024x1024.jpg)
![[Obayashi] Tackling the Labor Shortage — Robotics Construction®](https://japan-equity.com/wp-content/uploads/2026/07/p14_sq-1024x1024.jpg)
