
This article is based on publicly available IR materials and is not a recommendation to buy or sell any specific securities.
Note: JVCKENWOOD labels the fiscal year ended March 31, 2026 as “FYE3/’26” (and the following year as “FYE3/’27”); this site classifies it as FY2025. Labels in the body, tables and figures follow the company’s materials. JVCKENWOOD Corporation (6632) released its “Results and Forecast Briefing Fiscal Year Ended March 2026 (IFRS)” on May 1, 2026, followed by a corrected version dated May 11, 2026 (the version used here). Revenue decreased 3.6% year on year to ¥356.9 billion and core operating income decreased 17.5% to ¥20.9 billion, as production and sales declined significantly due to a supply shortage of components primarily for the enterprise market in the Communications Systems Business in the Safety & Security (S&S) sector, coupled with the effect of U.S. tariff measures on the Mobility & Telematics Services (M&T) sector and the Media Business in the Entertainment Solutions (ES) sector. Profit attributable to owners of the parent fell 17.2% to ¥16.8 billion. The company describes the results as largely in line with its forecasts as a Group despite fluctuations in each sector. For FYE3/’27 it forecasts increases in both revenue (¥364.0 billion, +2.0%) and core operating income (¥23.4 billion, +12.1%), and an annual dividend of ¥20 per share, up ¥2 from ¥18.
Consolidated Results (Full-Year Actual, FYE3/’26 / IFRS)
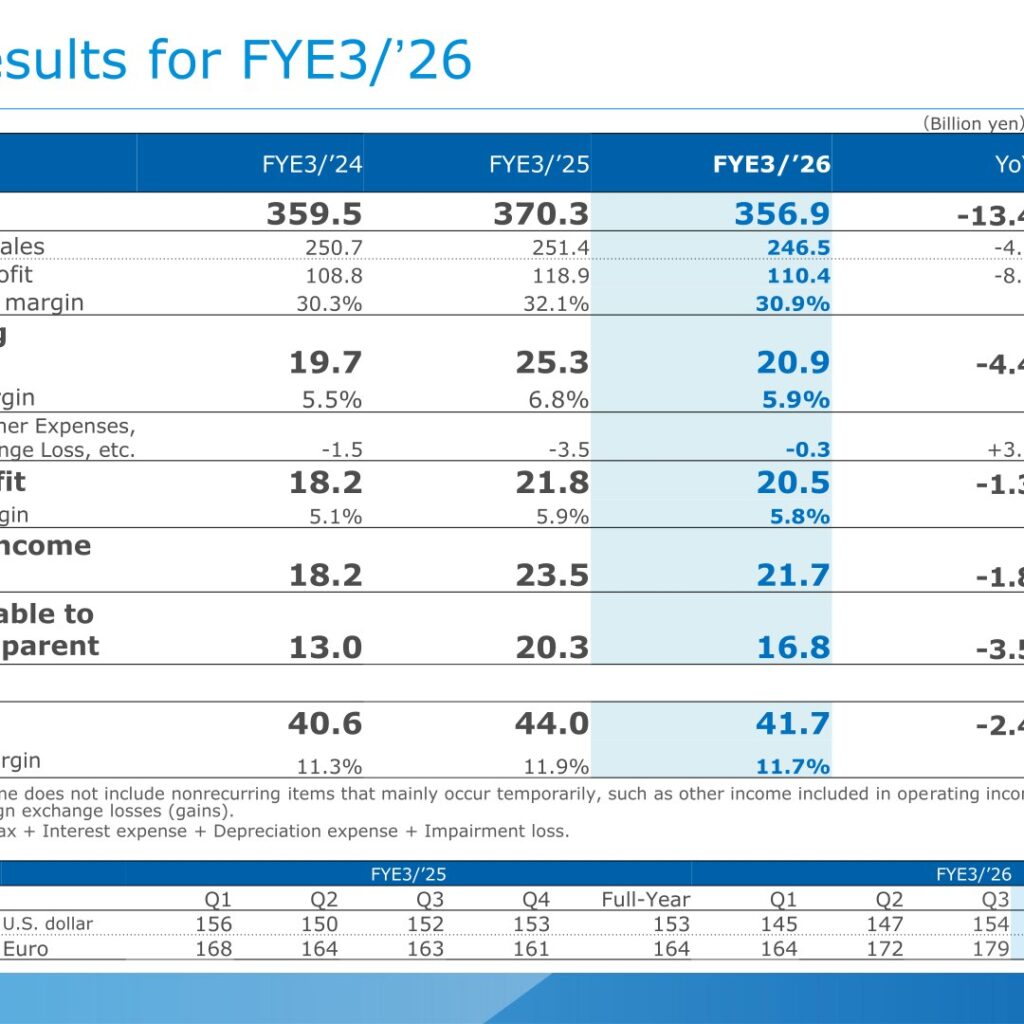
Revenue was ¥356.9 billion, down ¥13.4 billion (-3.6%) from ¥370.3 billion in FYE3/’25. Gross profit was ¥110.4 billion (-7.2%), with the gross profit margin narrowing from 32.1% to 30.9%. Core operating income, which excludes nonrecurring items such as other income, other expenses and foreign exchange losses (gains), was ¥20.9 billion, down ¥4.4 billion (-17.5%), with the margin falling from 6.8% to 5.9%. Other income, other expenses and foreign exchange loss, etc. improved by ¥3.2 billion to -¥0.3 billion, so operating profit decreased by only ¥1.3 billion (-5.7%) to ¥20.5 billion; the materials attribute the improvement to lower impairment losses on financial assets and a reduction in restructuring costs. Profit before income taxes decreased ¥1.8 billion (-7.8%) to ¥21.7 billion, mainly due to a decline in equity-method earnings, and profit attributable to owners of the parent decreased ¥3.5 billion (-17.2%) to ¥16.8 billion, despite a decrease in income tax expenses. EBITDA was ¥41.7 billion (-5.4%), an EBITDA margin of 11.7%. The average P&L exchange rates for FYE3/’26 were ¥151 to the U.S. dollar (¥153 in FYE3/’25) and ¥175 to the euro (¥164).
| Item (Billion yen) | FYE3/’24 | FYE3/’25 | FYE3/’26 | YoY | YoY % |
|---|---|---|---|---|---|
| Revenue | 359.5 | 370.3 | 356.9 | -13.4 | -3.6% |
| Gross profit | 108.8 | 118.9 | 110.4 | -8.5 | -7.2% |
| Core operating income | 19.7 | 25.3 | 20.9 | -4.4 | -17.5% |
| Core operating income margin | 5.5% | 6.8% | 5.9% | – | – |
| Operating profit | 18.2 | 21.8 | 20.5 | -1.3 | -5.7% |
| Profit before income taxes | 18.2 | 23.5 | 21.7 | -1.8 | -7.8% |
| Profit attributable to owners of the parent | 13.0 | 20.3 | 16.8 | -3.5 | -17.2% |
| EBITDA | 40.6 | 44.0 | 41.7 | -2.4 | -5.4% |
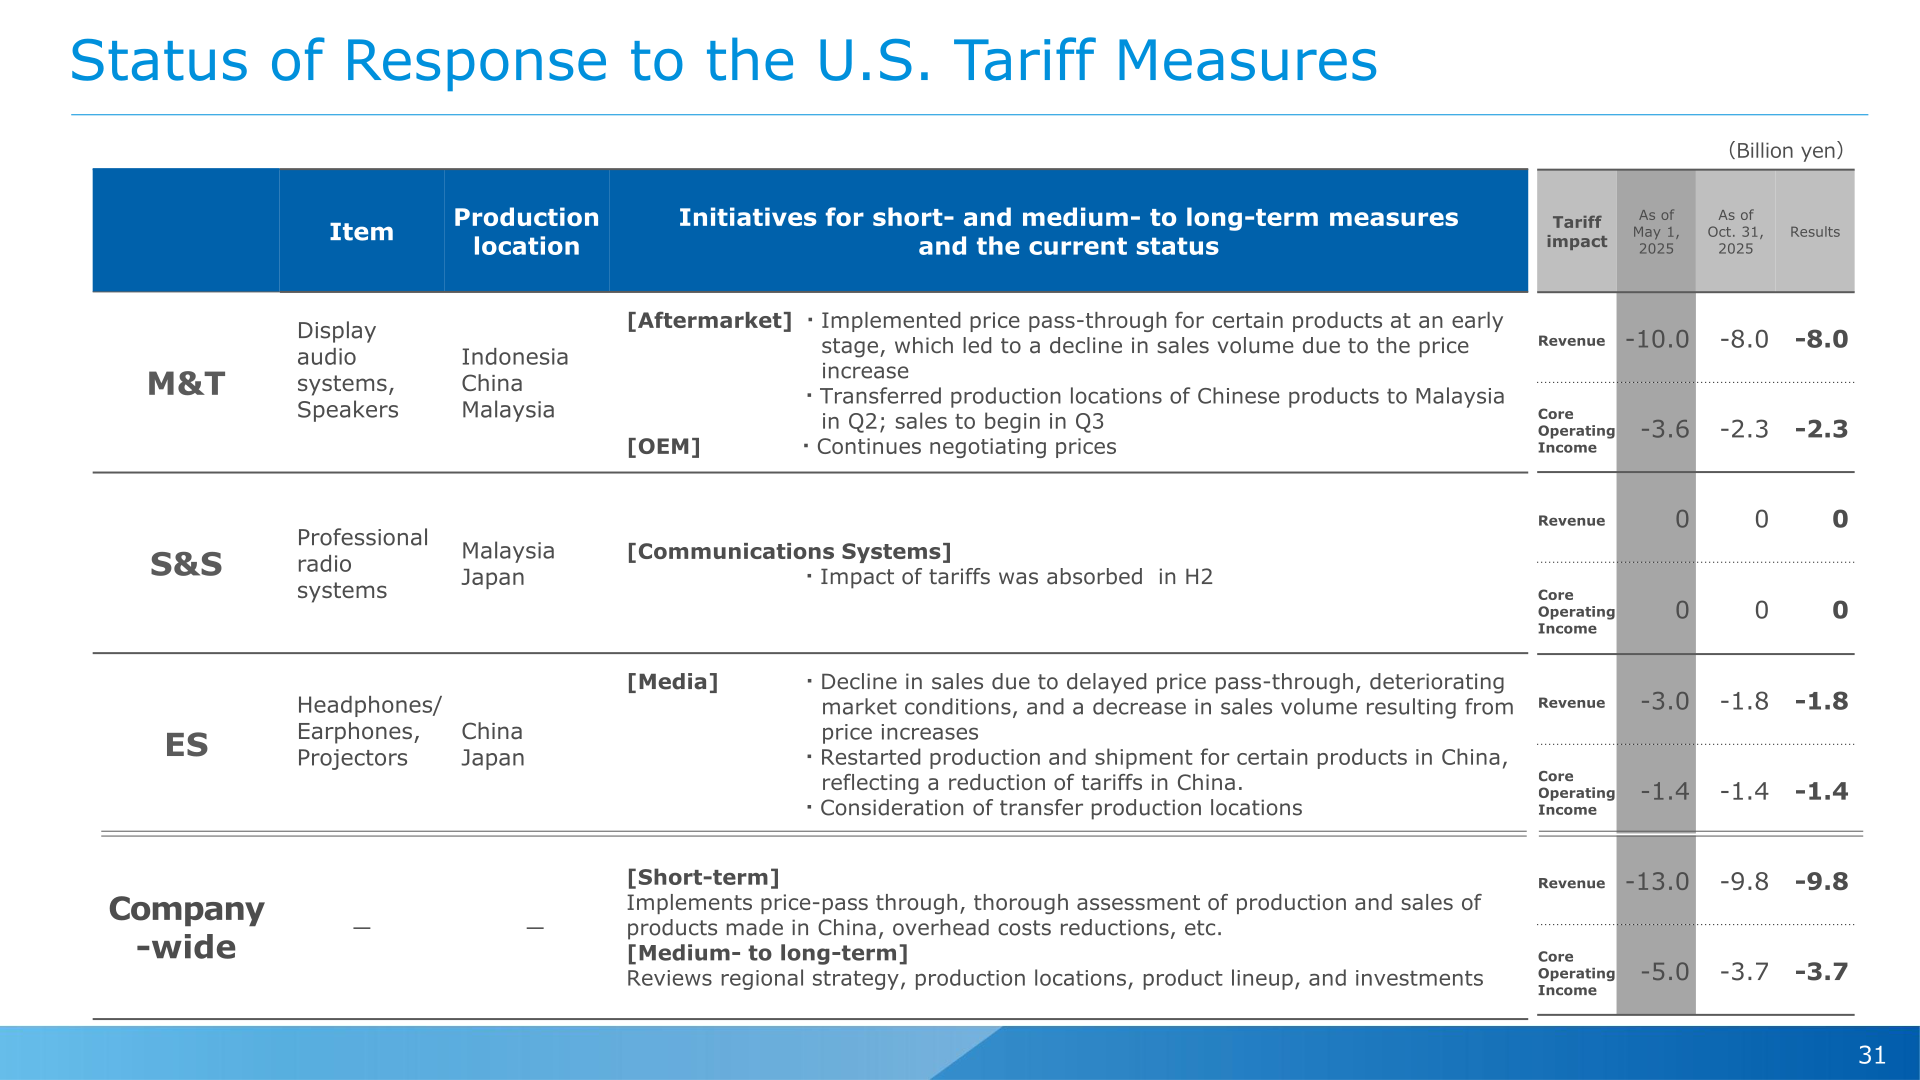
Among the factors behind the ¥4.4 billion decline in core operating income, the materials cite the impact of component supply shortages in the Communications Systems Business (a negative impact of -¥2.4 billion attributable to component supply shortages in the Wireless Systems business, according to a footnote to the bridge chart) and the U.S. tariff impact of -¥3.7 billion. The tariff-response slide shows the actual FYE3/’26 tariff impact as -¥9.8 billion on revenue and -¥3.7 billion on core operating income for the Group (M&T: revenue -¥8.0 billion / core operating income -¥2.3 billion; S&S: zero, as the impact was absorbed in H2; ES: revenue -¥1.8 billion / core operating income -¥1.4 billion), compared with the initial assumption as of May 1, 2025 of -¥13.0 billion and -¥5.0 billion. By region, revenue declined in the Americas (-¥5.6 billion) due to U.S. tariff measures and in Asia/China (-¥11.6 billion) due to the economic slowdown in China compounded by tariff effects, while Japan (+¥0.7 billion), Europe (+¥1.2 billion) and Others (+¥1.8 billion) increased.
On the balance sheet, total assets were ¥347.6 billion (+¥34.3 billion) and equity attributable to owners of the parent increased by approximately ¥18.7 billion to ¥143.8 billion, mainly due to an increase in retained earnings and other components of equity, despite dividend payments and share repurchases; the stockholders’ equity ratio rose 1.5pt to 41.4%. Interest-bearing debts increased to ¥68.6 billion (+¥18.2 billion) and net cash was -¥2.9 billion (down ¥1.1 billion), mainly due to cash outflows related to share repurchases. Cash flows from operating activities were ¥33.8 billion (+¥2.3 billion), as the decrease in working capital more than offset the decline in core operating profit; investing cash flows were -¥22.3 billion and free cash flow was ¥11.5 billion (+¥1.5 billion). Financing cash flows were +¥1.8 billion, as proceeds from the issuance of convertible bonds with share acquisition rights more than offset the increase in share repurchases.
Segment Results
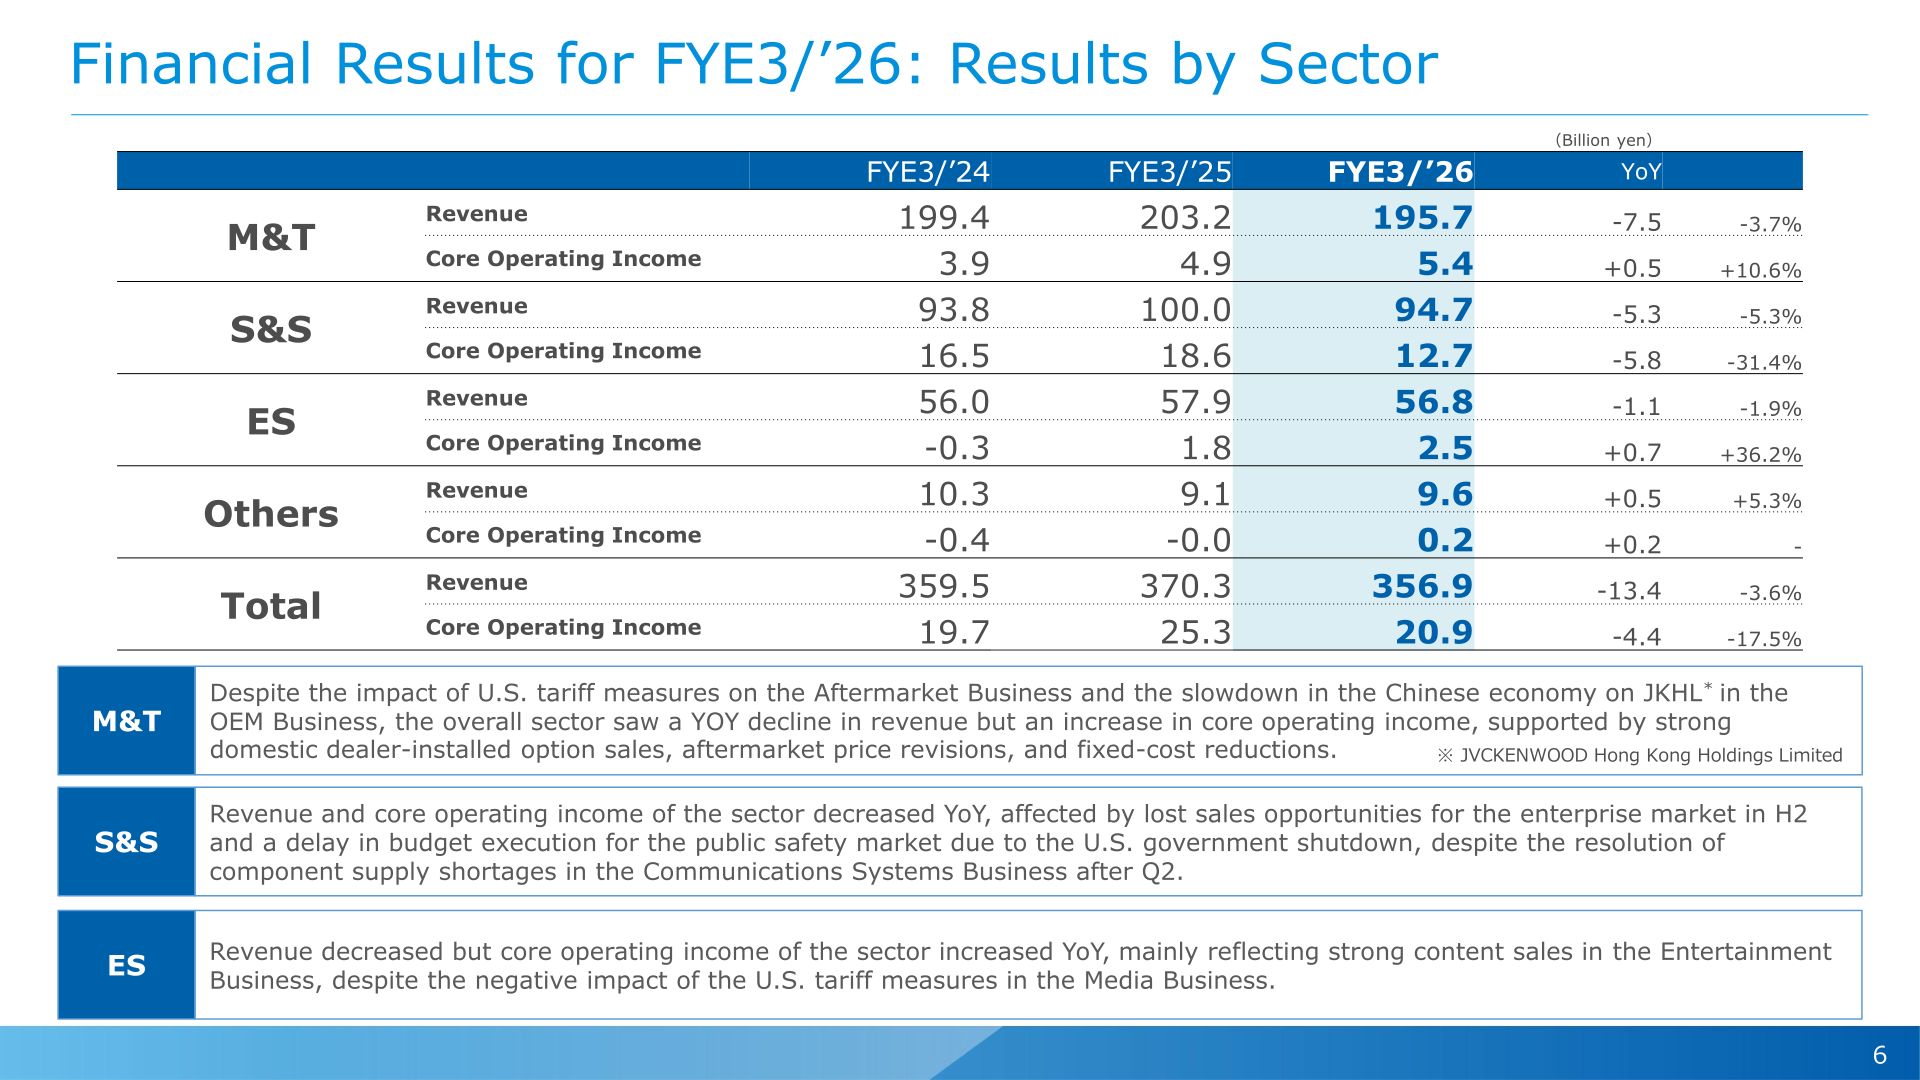
Mobility & Telematics Services (M&T): revenue decreased ¥7.5 billion (-3.7%) to ¥195.7 billion, but core operating income increased ¥0.5 billion (+10.6%) to ¥5.4 billion. Despite the impact of U.S. tariff measures on the Aftermarket Business and the slowdown in the Chinese economy on JVCKENWOOD Hong Kong Holdings (JKHL) in the OEM Business, the sector’s profit was supported by strong domestic dealer-installed option sales, aftermarket price revisions and fixed-cost reductions. Safety & Security (S&S): revenue decreased ¥5.3 billion (-5.3%) to ¥94.7 billion and core operating income decreased ¥5.8 billion (-31.4%) to ¥12.7 billion, affected by lost sales opportunities for the enterprise market in H2 and a delay in budget execution for the public safety market due to the U.S. government (Department of Homeland Security) shutdown, despite the resolution of component supply shortages in the Communications Systems Business after Q2. Entertainment Solutions (ES): revenue decreased ¥1.1 billion (-1.9%) to ¥56.8 billion, but core operating income increased ¥0.7 billion (+36.2%) to ¥2.5 billion, mainly reflecting strong content sales in the Entertainment Business, despite the negative impact of U.S. tariff measures in the Media Business. Others: revenue of ¥9.6 billion (+5.3%) and core operating income of ¥0.2 billion.
| Sector (Billion yen) | Metric | FYE3/’25 | FYE3/’26 | YoY | YoY % |
|---|---|---|---|---|---|
| M&T | Revenue | 203.2 | 195.7 | -7.5 | -3.7% |
| M&T | Core operating income | 4.9 | 5.4 | +0.5 | +10.6% |
| S&S | Revenue | 100.0 | 94.7 | -5.3 | -5.3% |
| S&S | Core operating income | 18.6 | 12.7 | -5.8 | -31.4% |
| ES | Revenue | 57.9 | 56.8 | -1.1 | -1.9% |
| ES | Core operating income | 1.8 | 2.5 | +0.7 | +36.2% |
| Others | Revenue | 9.1 | 9.6 | +0.5 | +5.3% |
| Others | Core operating income | -0.0 | 0.2 | +0.2 | – |
| Total | Revenue | 370.3 | 356.9 | -13.4 | -3.6% |
| Total | Core operating income | 25.3 | 20.9 | -4.4 | -17.5% |
In Q4 (January–March), Group revenue decreased but core operating income increased year on year, mainly reflecting strong sales in the Domestic Dealer-Installed Option Business in M&T and the Entertainment Business in ES, despite a sales decrease at ASK in M&T and the negative impact of U.S. tariff measures in the Media Business in ES. In the Communications Systems Business, the materials note that demand related to the shift from analog to digital systems and crisis management remains strong and that production has started to normalize in FYE3/’27, but orders received for the North American public safety market came to 210 million dollars against an expected 280 million dollars, as a large-scale project expected in Q4 FYE3/’26 was postponed to FYE3/’27 or later amid the U.S. government shutdown (the temporary budget for the Department of Homeland Security expired on February 14, 2026 and the partial shutdown remained in effect as of April 30, 2026).
FYE3/’27 Forecast
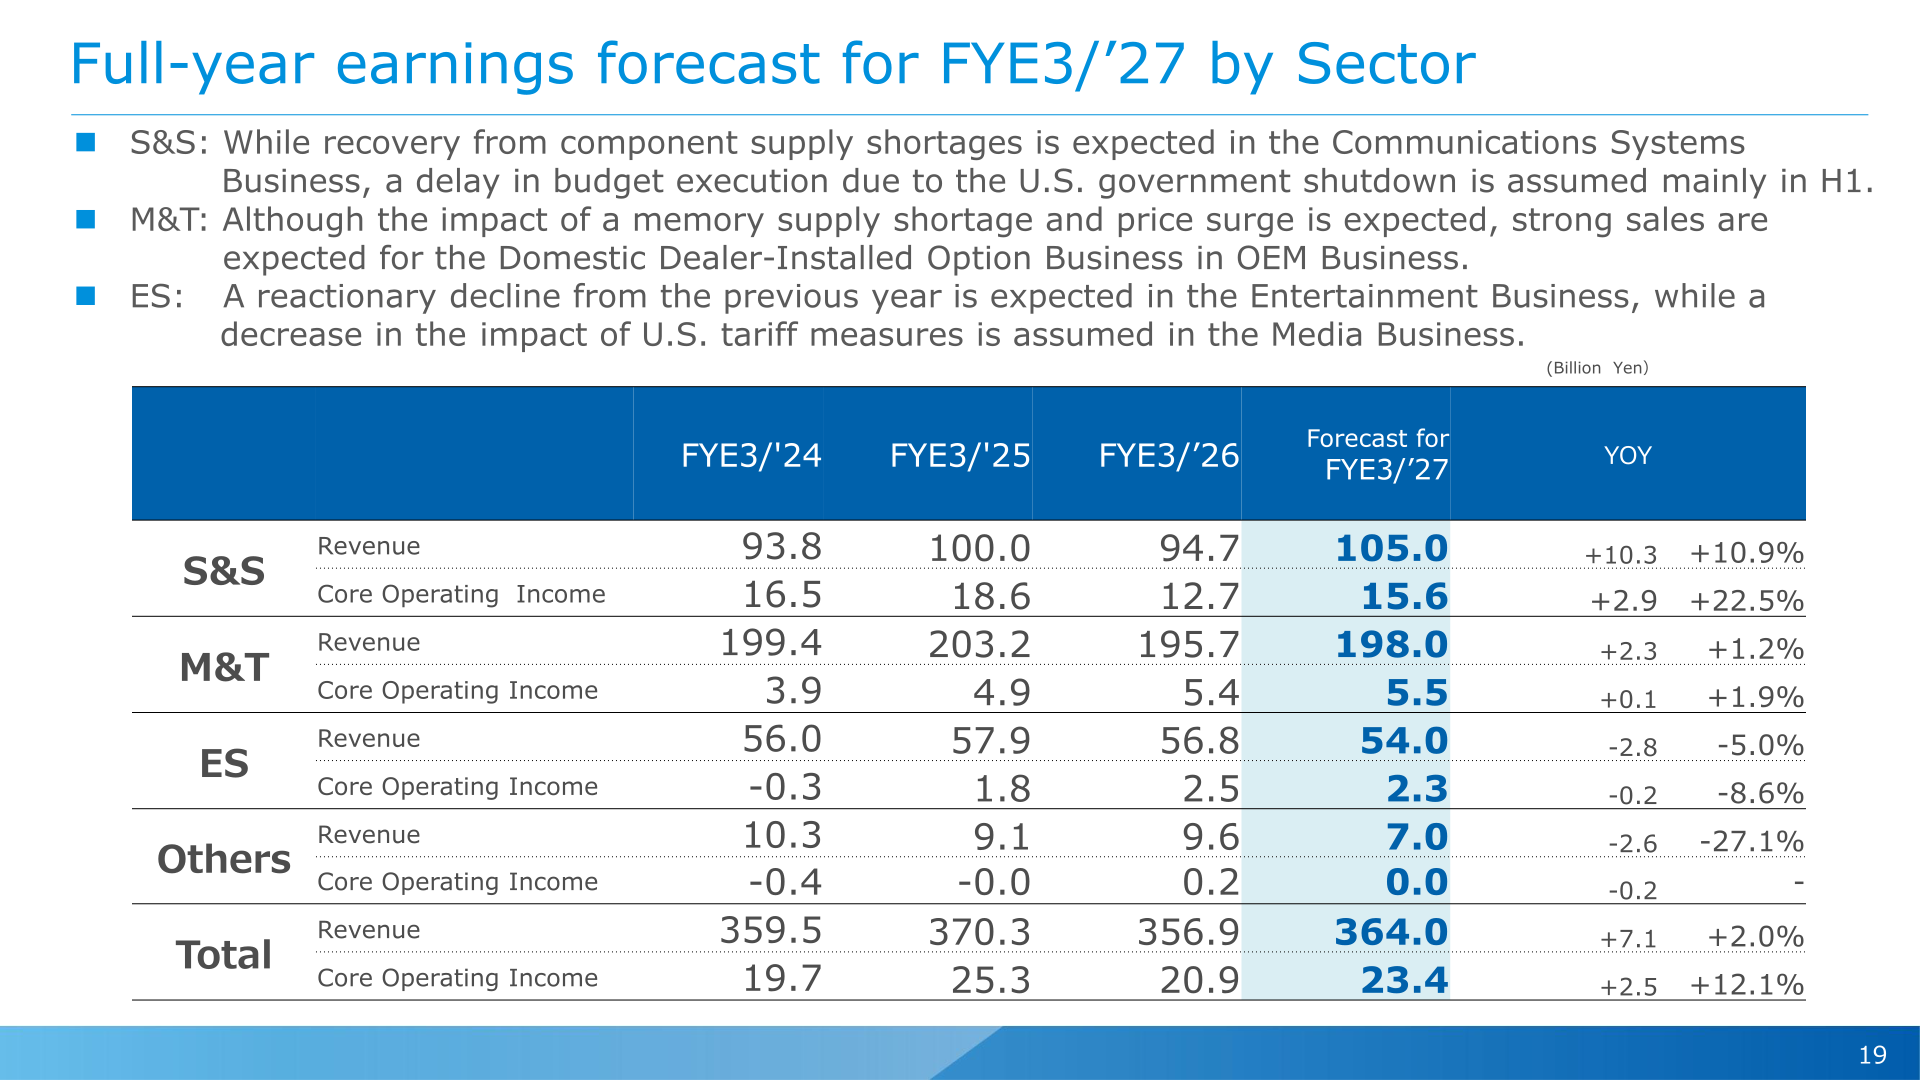
For FYE3/’27, the company expects both revenue and core operating income to increase, as it anticipates recovery of the Communications Systems Business in S&S. Revenue is forecast at ¥364.0 billion (+¥7.1 billion, +2.0%) and core operating income at ¥23.4 billion (+¥2.5 billion, +12.1%); in the core operating income bridge, the increase in revenue and improved profit margin contributes +¥8.9 billion (a figure corrected from +9.7 in the original release). Operating profit is forecast at ¥20.6 billion (+0.3%), profit before income taxes at ¥21.0 billion (-3.0%) and profit attributable to owners of the parent at ¥15.0 billion (-10.6%), as line-item profits of operating profit and below reflect reform expenses based on production grand designs. ROE is forecast at 10.1% (12.5% in FYE3/’26). The assumed exchange rates are ¥155 to the U.S. dollar and ¥180 to the euro. By sector, S&S revenue is forecast at ¥105.0 billion (+10.9%) and core operating income at ¥15.6 billion (+22.5%), with recovery from component supply shortages expected in the Communications Systems Business while a delay in budget execution due to the U.S. government shutdown is assumed mainly in H1; M&T revenue at ¥198.0 billion (+1.2%) and core operating income at ¥5.5 billion (+1.9%), with strong sales expected for the Domestic Dealer-Installed Option Business despite the impact of a memory supply shortage and price surge; and ES revenue at ¥54.0 billion (-5.0%) and core operating income at ¥2.3 billion (-8.6%), with a reactionary decline expected in the Entertainment Business and a decrease in the impact of U.S. tariff measures assumed in the Media Business. The company states it will continue to monitor growing geopolitical risks, such as the situation in the Middle East, and take appropriate measures.
| Item (Billion yen) | FYE3/’26 (Actual) | FYE3/’27 Forecast | YoY | YoY % |
|---|---|---|---|---|
| Revenue | 356.9 | 364.0 | +7.1 | +2.0% |
| Core operating income | 20.9 | 23.4 | +2.5 | +12.1% |
| Operating profit | 20.5 | 20.6 | +0.1 | +0.3% |
| Profit before income taxes | 21.7 | 21.0 | -0.7 | -3.0% |
| Profit attributable to owners of the parent | 16.8 | 15.0 | -1.8 | -10.6% |
| ROE (%) | 12.5 | 10.1 | – | – |
| S&S revenue | 94.7 | 105.0 | +10.3 | +10.9% |
| S&S core operating income | 12.7 | 15.6 | +2.9 | +22.5% |
| M&T revenue | 195.7 | 198.0 | +2.3 | +1.2% |
| M&T core operating income | 5.4 | 5.5 | +0.1 | +1.9% |
| ES revenue | 56.8 | 54.0 | -2.8 | -5.0% |
| ES core operating income | 2.5 | 2.3 | -0.2 | -8.6% |
| Annual dividend per share (yen) | 18 | 20 | +2 | – |
Shareholder Returns
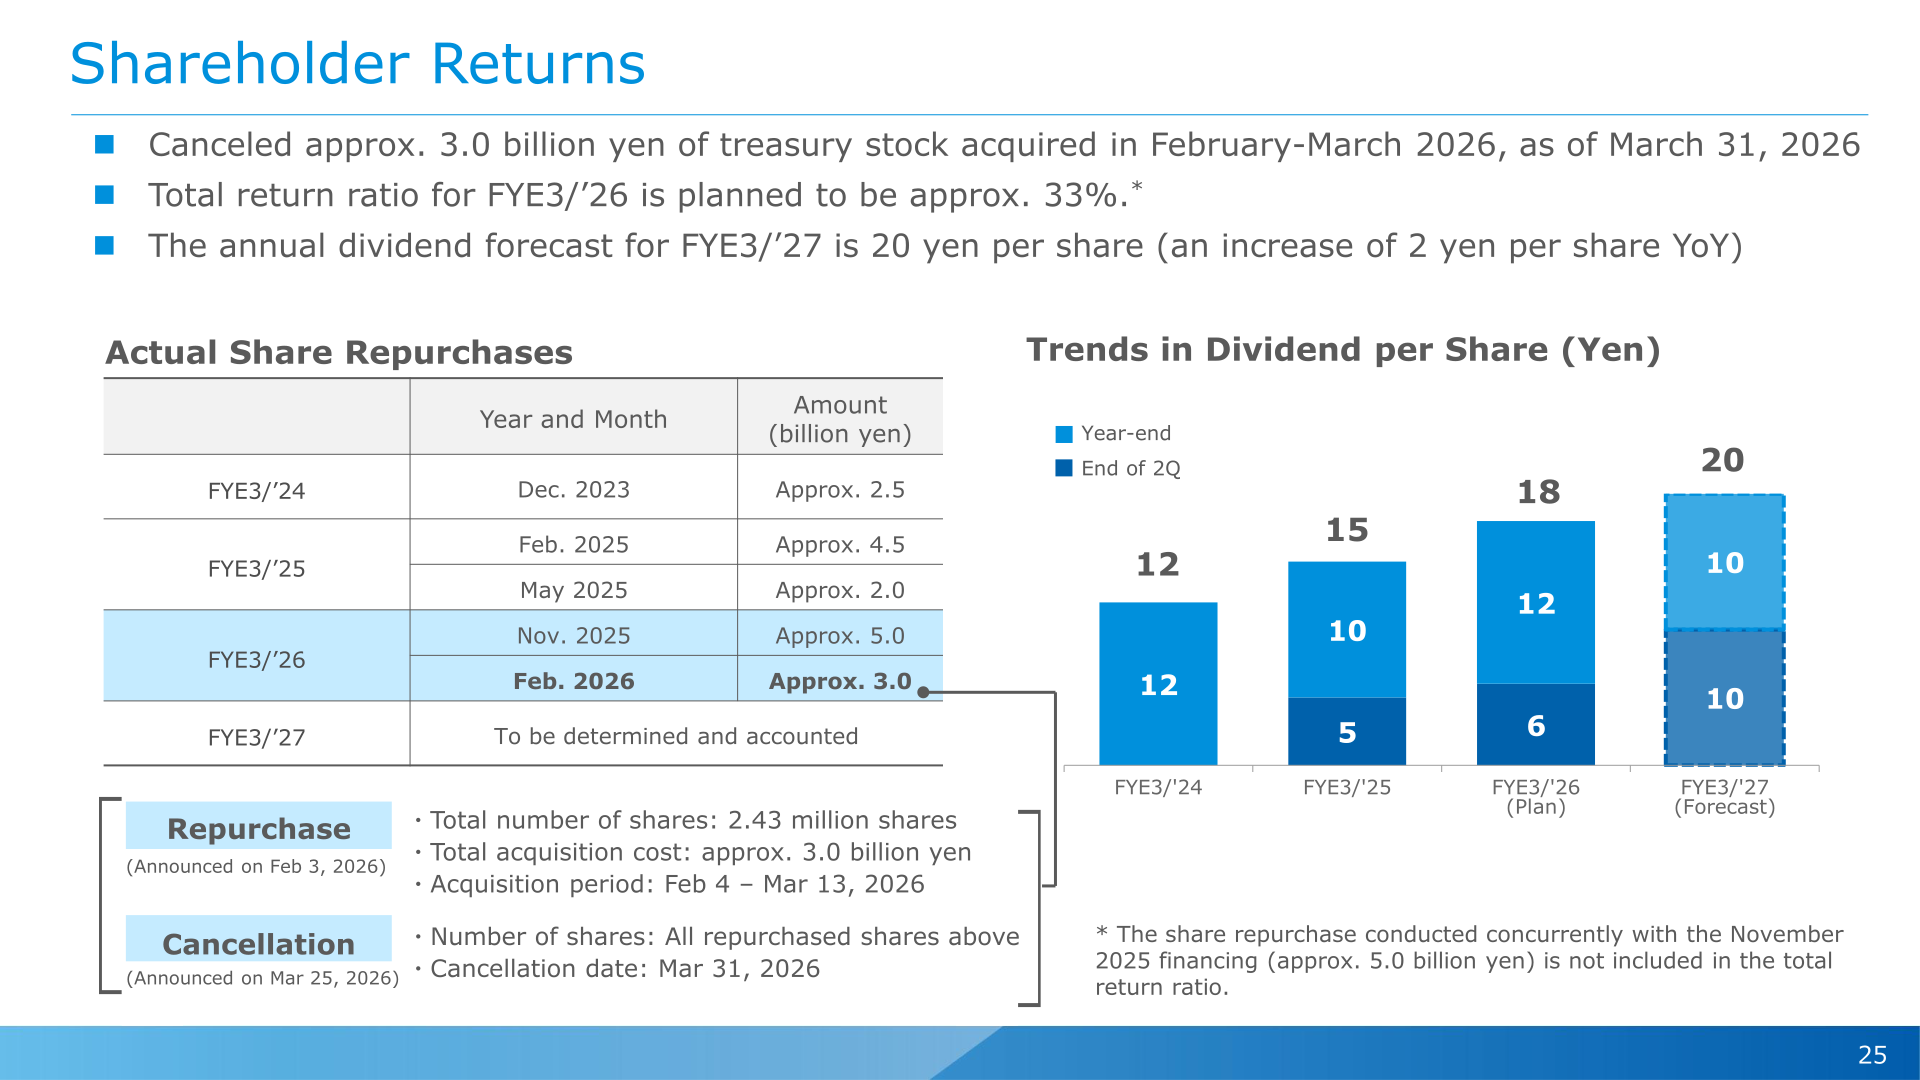
The annual dividend for FYE3/’26 was ¥18 per share (¥15 in FYE3/’25 and ¥12 in FYE3/’24), and the FYE3/’27 forecast is ¥20 per share (an interim dividend of ¥10 and a year-end dividend of ¥10), an increase of ¥2 per share. The total return ratio for FYE3/’26 is planned to be approximately 33%; the share repurchase conducted concurrently with the November 2025 financing (approx. ¥5.0 billion) is not included in the total return ratio. Actual share repurchases were approx. ¥2.5 billion in December 2023 (FYE3/’24), approx. ¥4.5 billion in February 2025 and approx. ¥2.0 billion in May 2025 (FYE3/’25), and approx. ¥5.0 billion in November 2025 and approx. ¥3.0 billion in February 2026 (FYE3/’26); repurchases for FYE3/’27 are to be determined. The repurchase announced on February 3, 2026 totaled 2.43 million shares at a total acquisition cost of approx. ¥3.0 billion over February 4 – March 13, 2026, and all of these shares were canceled on March 31, 2026 (announced on March 25, 2026). Management indices for FYE3/’26 were ROE 12.5%, ROA 5.1% (corrected from 4.8% in the original release), ROIC 8.9%, EPS ¥115.21, PBR 1.07 times and a total return ratio of 33%.
| Item | FYE3/’24 | FYE3/’25 | FYE3/’26 | FYE3/’27 (Forecast) |
|---|---|---|---|---|
| Annual dividend per share (yen) | 12 | 15 | 18 | 20 |
| Payout ratio / Total return ratio | 33% | 43% | 33% | – |
| ROE | 12.2% | 16.9% | 12.5% | 10.1% |
| EPS (yen) | 84.34 | 135.17 | 115.21 | – |
Topics
Structural reforms: the company decided to withdraw from the health care business within the business systems segment (announced February 20, 2026). Production of medical image display monitors and related products will be discontinued at the end of September 2026, sales at the end of December 2026, and maintenance and support services at the end of December 2031; the transfer of shares in Rein Medical GmbH, a German subsidiary engaged in OR video system solutions, was completed as of January 30, 2026. Together with the already discontinued professional camera business, the structural reforms of the businesses positioned for restructuring under VISION2025 have been largely completed. In the Communications Systems Business, the company exhibited an ESChat-equipped interoperability solution at IWCE 2026 (announced March 16, 2026) and launched radios equipped with the PoC app “Buddycom” (announced May 1, 2026), marking full-scale entry into the PoC service business; due to the U.S. government shutdown, CFIUS reviews are suspended and the acquisition of shares in San Luis Aviation, Inc. has been prolonged since the end of March 2026. On supply chains, the company plans price revisions as the primary measure against memory supply shortages and rising prices, and is pursuing S&OP-based management and SCM and procurement reform against heightened geopolitical risks. In governance, the company transitioned to a Company with an Audit and Supervisory Committee in June 2025, and after the June 2026 general meeting the Board is planned to be reduced from 14 to 11 directors, with the ratio of independent outside directors rising from 50% to 63% and the ratio of female directors from 14% to 27%. The company received an R&I credit rating of A- (Stable) and was included in the CDP 2025 Climate Change A List.
This article is an analysis based on publicly available information and is not a recommendation to buy or sell any specific securities. Investment decisions are your own responsibility.
![[Obayashi] Investors’ Guide 2026 — The Complete 24-Article Breakdown](https://japan-equity.com/wp-content/uploads/2026/07/hub_cover-1024x1024.png)
![[Obayashi] IR & SR Policy — Feeding Dialogue Back into Management](https://japan-equity.com/wp-content/uploads/2026/07/p32_sq-1024x1024.jpg)
![[Obayashi] Real Estate Development — 18.7% Margin, ¥287.7bn Unrealized Gains](https://japan-equity.com/wp-content/uploads/2026/07/p20_sq-1024x1024.jpg)
![[Obayashi] Domestic Civil Engineering — Resilience Spending Supports 9.6% Margin](https://japan-equity.com/wp-content/uploads/2026/07/p11_sq-1024x1024.jpg)
![[Obayashi] Share Price & External Ratings — vs TOPIX, ESG Index Inclusion](https://japan-equity.com/wp-content/uploads/2026/07/p40_sq-1024x1024.jpg)
![[Construction] ¥75.5tn Investment, Shrinking Workforce — Big-5 Market Share](https://japan-equity.com/wp-content/uploads/2026/07/p12_sq-1024x1024.jpg)



![[Obayashi] Capital Policy & Shareholder Returns — ROE 10%+, DOE ~5%, ¥100bn Buyback](https://japan-equity.com/wp-content/uploads/2026/07/p27_sq-1024x1024.jpg)
![[Obayashi] Reducing Cross-Shareholdings — ¥285.2bn Sold in Five Years](https://japan-equity.com/wp-content/uploads/2026/07/p29_sq-1024x1024.jpg)
![[Obayashi] ¥750bn Investment Plan — ¥300bn to Development, ¥190bn to Tech/DX](https://japan-equity.com/wp-content/uploads/2026/07/p30_sq-1024x1024.jpg)
![[Obayashi] MTP2022 KPIs — Operating Profit ~2x Target, ROE 14.4%](https://japan-equity.com/wp-content/uploads/2026/07/p25_sq-1024x1024.jpg)
![[Obayashi] Cash Allocation — ¥420bn Investment CF Over Five Years](https://japan-equity.com/wp-content/uploads/2026/07/p26_sq-1024x1024.jpg)
![[Obayashi] Green Energy — 44 Plants, 344MW, and the Green Hydrogen Challenge](https://japan-equity.com/wp-content/uploads/2026/07/p21_sq-1024x1024.jpg)
![[Obayashi] Tackling the Labor Shortage — Robotics Construction®](https://japan-equity.com/wp-content/uploads/2026/07/p14_sq-1024x1024.jpg)
