
This article is based on publicly available IR materials and is not a recommendation to buy or sell any specific securities.
Note: KOKUSAI ELECTRIC labels the fiscal year ended March 31, 2026 as “FY26/3” and the fiscal year ending March 31, 2027 as “FY27/3”; this article follows the company’s labels in the body and tables, while the site categorizes the completed year as FY2025. KOKUSAI ELECTRIC CORPORATION (6525) released its “Financial Briefings for the Fiscal Year Ended March 2026 (April 2025 to March 2026)” dated May 13, 2026. For FY26/3, revenue was JPY 235.1 billion (-1.6% YoY), adjusted operating profit was JPY 47.6 billion (-17.6%) and net income was JPY 30.1 billion (-16.4%), as sales of equipment for China DRAM, which had been concentrated in the previous year, normalized. Both revenue and profit exceeded the full-year forecast revised at the 2Q results, and the year-end dividend was increased by 1 yen to 19 yen, bringing the annual dividend to 37 yen. For FY27/3 the company forecasts revenue of JPY 280.0 billion (+19.1%), adjusted operating profit of JPY 60.5 billion (+27.1%) and net income of JPY 38.8 billion (+28.9%), with an annual dividend of 47 yen (+10 yen).
Consolidated Results (Full-Year Actual, FY26/3 / IFRS)
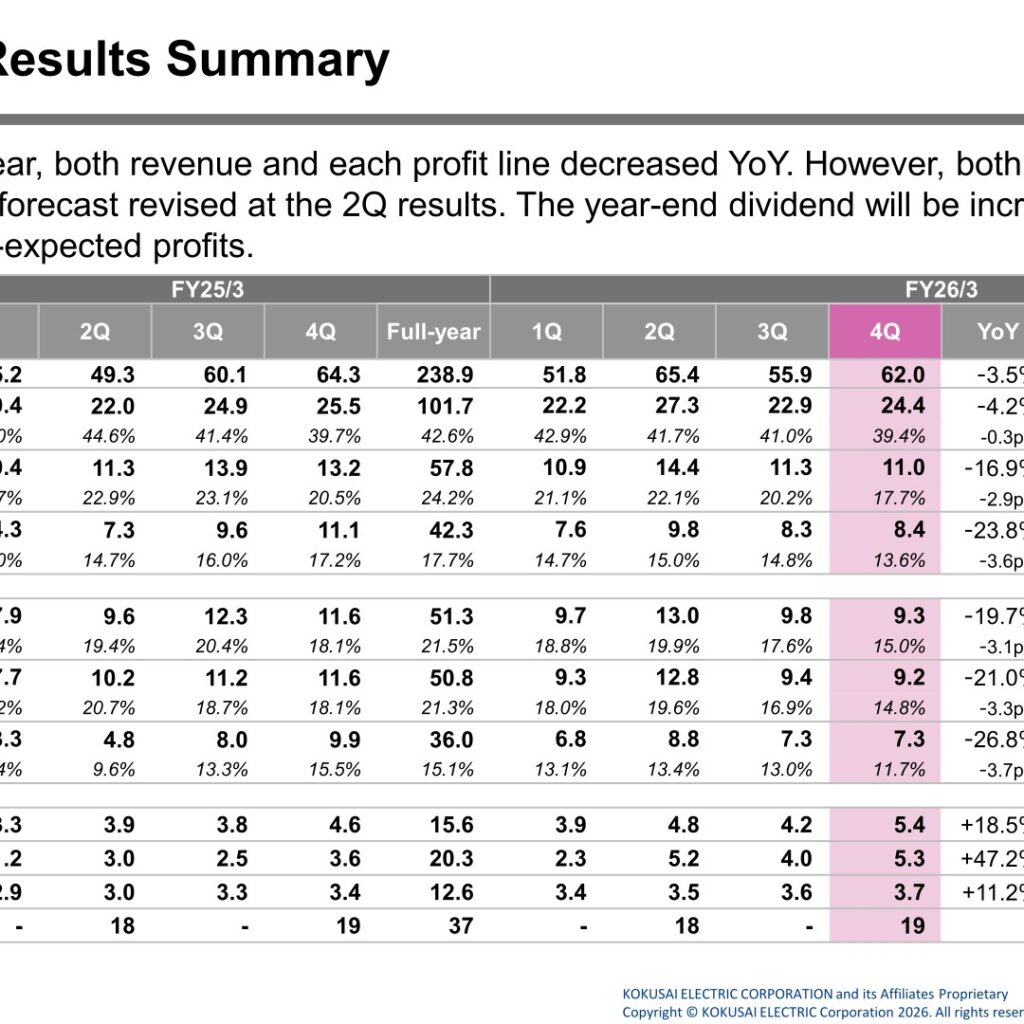
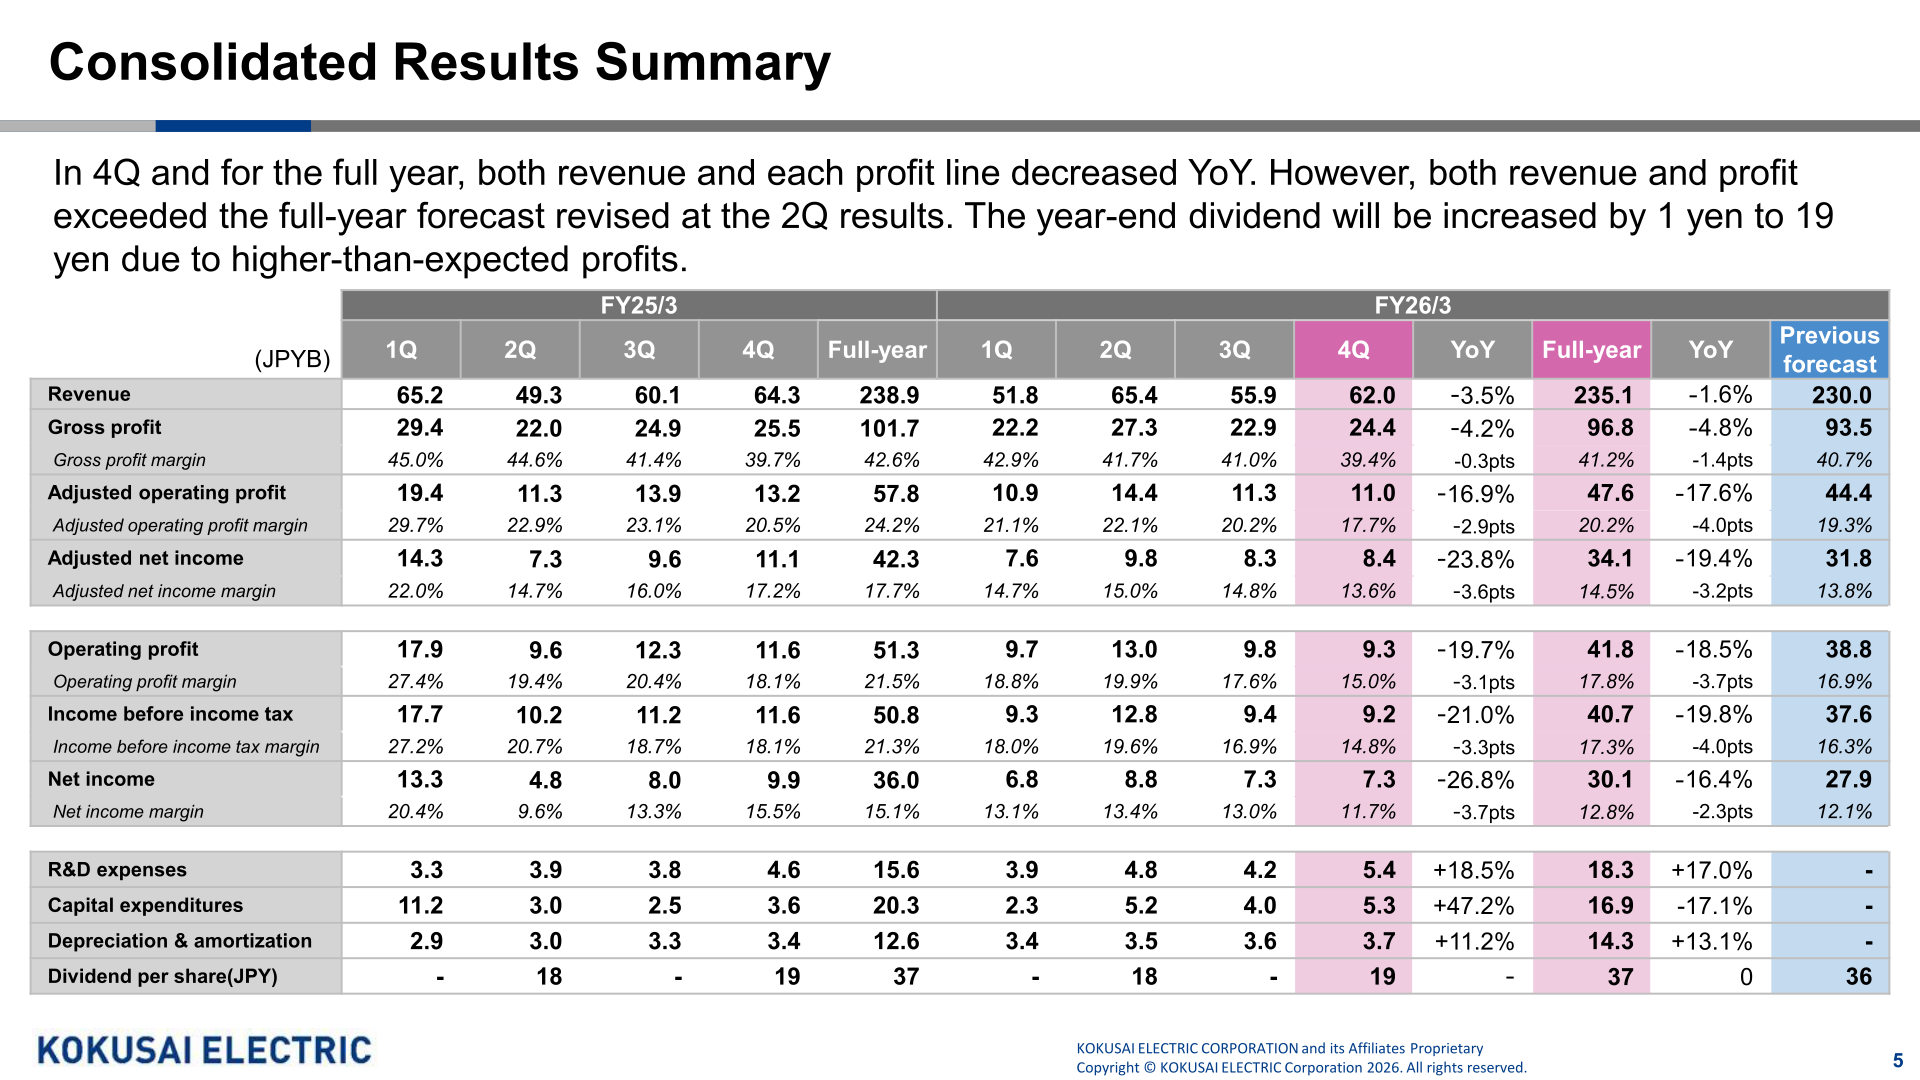
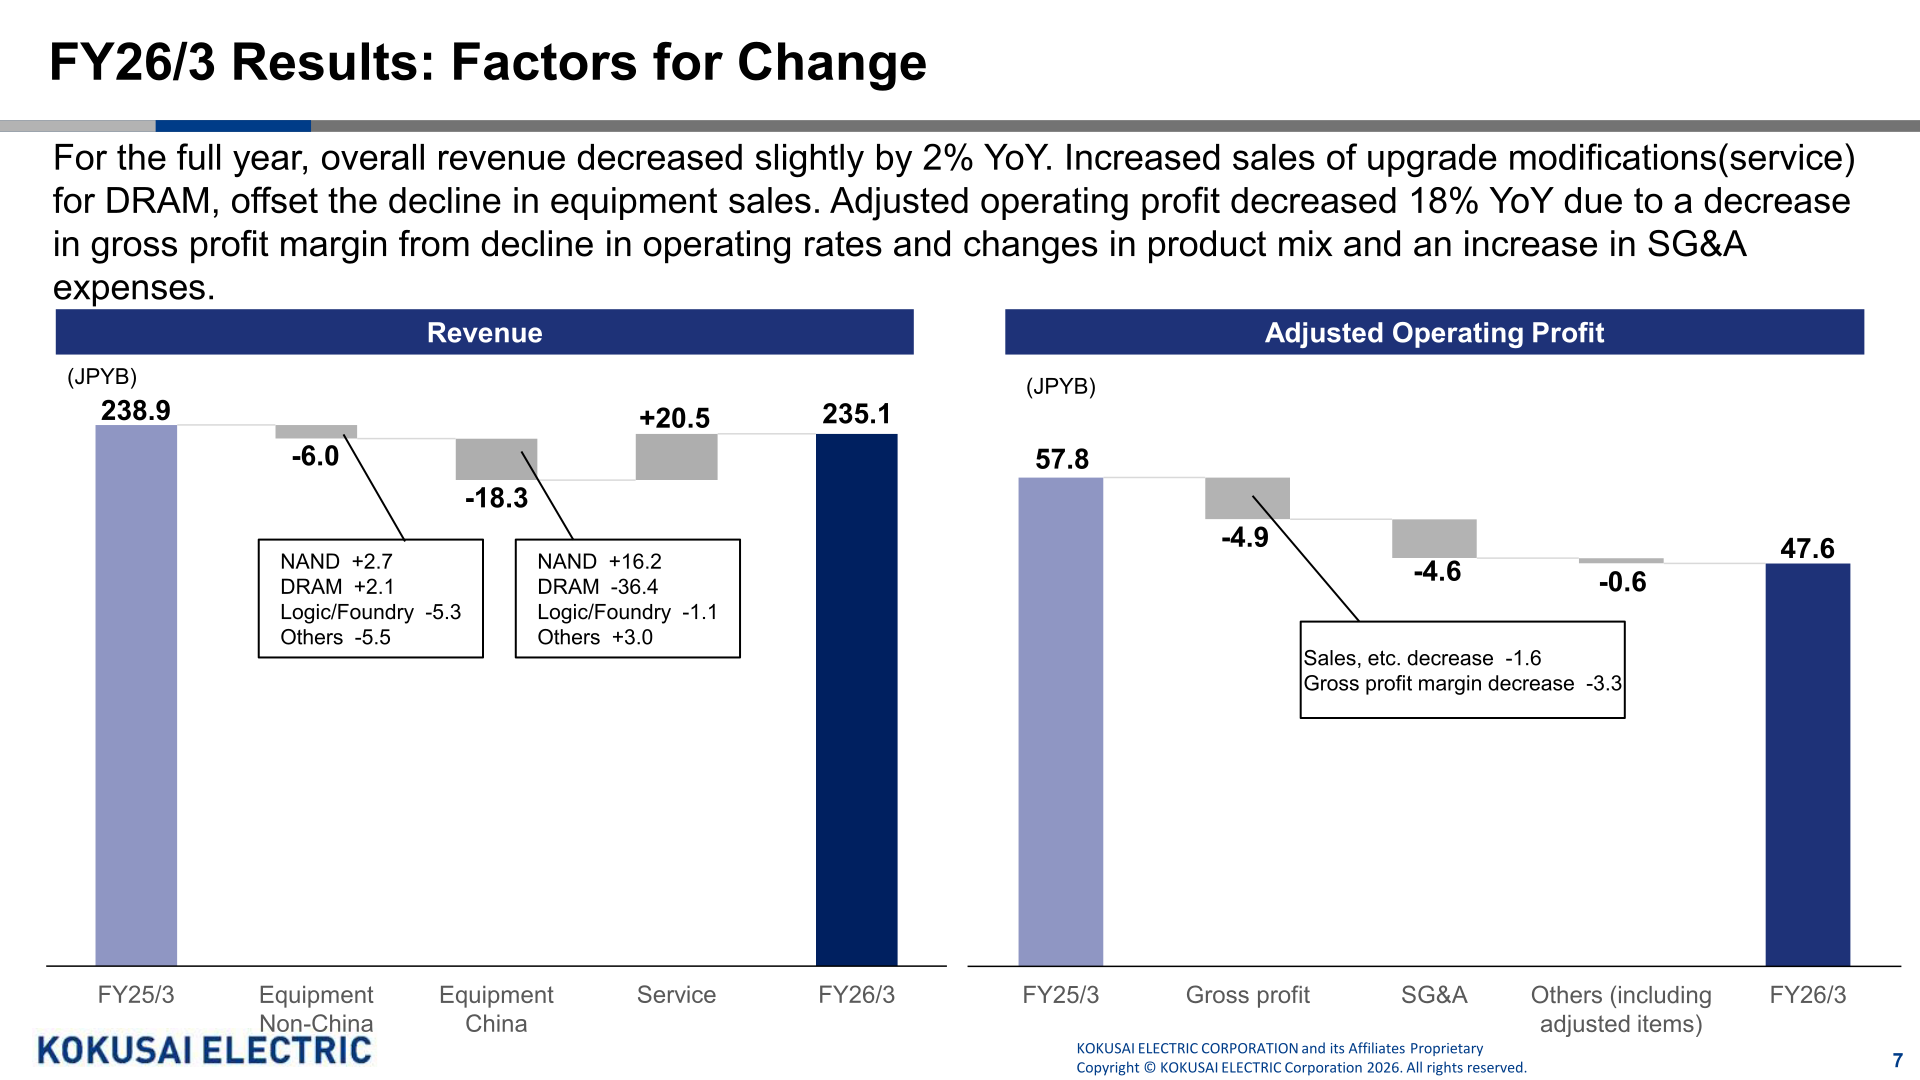
The company prepares its consolidated financial reports under IFRS and uses adjusted operating profit and adjusted net income as key performance indicators. For the full year, revenue decreased slightly by 2% YoY to JPY 235.1 billion from JPY 238.9 billion; increased sales of upgrade modifications (service) for DRAM offset the decline in equipment sales. Gross profit was JPY 96.8 billion (-4.8%) with a gross profit margin of 41.2% (-1.4pts). Adjusted operating profit decreased 18% YoY to JPY 47.6 billion (-17.6%) due to a decrease in gross profit margin from a decline in operating rates and changes in product mix, and an increase in SG&A expenses; the adjusted operating profit margin was 20.2% (-4.0pts). Operating profit was JPY 41.8 billion (-18.5%), income before income tax was JPY 40.7 billion (-19.8%), adjusted net income was JPY 34.1 billion (-19.4%) and net income was JPY 30.1 billion (-16.4%). Revenue, adjusted operating profit and net income all exceeded the previous forecast of JPY 230.0 billion, JPY 44.4 billion and JPY 27.9 billion respectively. In the revenue bridge, equipment for Non-China was -6.0, equipment for China was -18.3 and service was +20.5 (JPYB); in the adjusted operating profit bridge, gross profit was -4.6 (of which sales, etc. decrease -1.6 and gross profit margin decrease -3.3), SG&A was -4.9 and others (including adjusted items) was -0.6. R&D expenses rose 17.0% to JPY 18.3 billion, capital expenditures fell 17.1% to JPY 16.9 billion and depreciation & amortization rose 13.1% to JPY 14.3 billion.
| Item (JPYB) | FY25/3 Full-year | FY26/3 Full-year | YoY | Previous forecast |
|---|---|---|---|---|
| Revenue | 238.9 | 235.1 | -1.6% | 230.0 |
| Gross profit | 101.7 | 96.8 | -4.8% | 93.5 |
| Gross profit margin | 42.6% | 41.2% | -1.4pts | 40.7% |
| Adjusted operating profit | 57.8 | 47.6 | -17.6% | 44.4 |
| Adjusted operating profit margin | 24.2% | 20.2% | -4.0pts | 19.3% |
| Adjusted net income | 42.3 | 34.1 | -19.4% | 31.8 |
| Operating profit | 51.3 | 41.8 | -18.5% | 38.8 |
| Income before income tax | 50.8 | 40.7 | -19.8% | 37.6 |
| Net income | 36.0 | 30.1 | -16.4% | 27.9 |
| R&D expenses | 15.6 | 18.3 | +17.0% | – |
| Capital expenditures | 20.3 | 16.9 | -17.1% | – |
| Depreciation & amortization | 12.6 | 14.3 | +13.1% | – |
| Dividend per share (JPY) | 37 | 37 | 0 | 36 |
In 4Q (January to March 2026), revenue was JPY 62.0 billion (-3.5% YoY) and adjusted operating profit was JPY 11.0 billion (-16.9%); overall revenue decreased 4% YoY due to a decrease in sales of equipment for China, while revenue from upgrade modifications (service) for DRAM increased, and adjusted operating profit decreased 17% YoY. On the balance sheet, total assets increased by JPY 18.1 bn from the end of the previous fiscal year to JPY 359.7 billion, mainly due to an increase in cash and cash equivalents and an increase in property, plant and equipment resulting from investments associated with the establishment of a demo center in the U.S.; total equity increased by JPY 23.1 bn to JPY 219.3 billion, mainly due to an increase in retained earnings. The equity ratio rose to 61% at the end of FY26/3 (61.0%), and net cash at the end of the fiscal year was JPY 6.6 bn as net debt was eliminated due to an increase in cash and cash equivalents (JPY 56.5 billion) and a decrease in interest-bearing liabilities (JPY 49.9 billion) resulting from loan repayment. Cash flows from operating activities were JPY 48.8 billion and cash flows from investing activities were -17.0, resulting in free cash flow of JPY 31.8 bn; cash outflow in financing activities amounted to JPY 21.5 bn, mainly due to repayment of borrowings and payment of dividends.
Revenue Breakdown (Business, Application, Destination, Account)
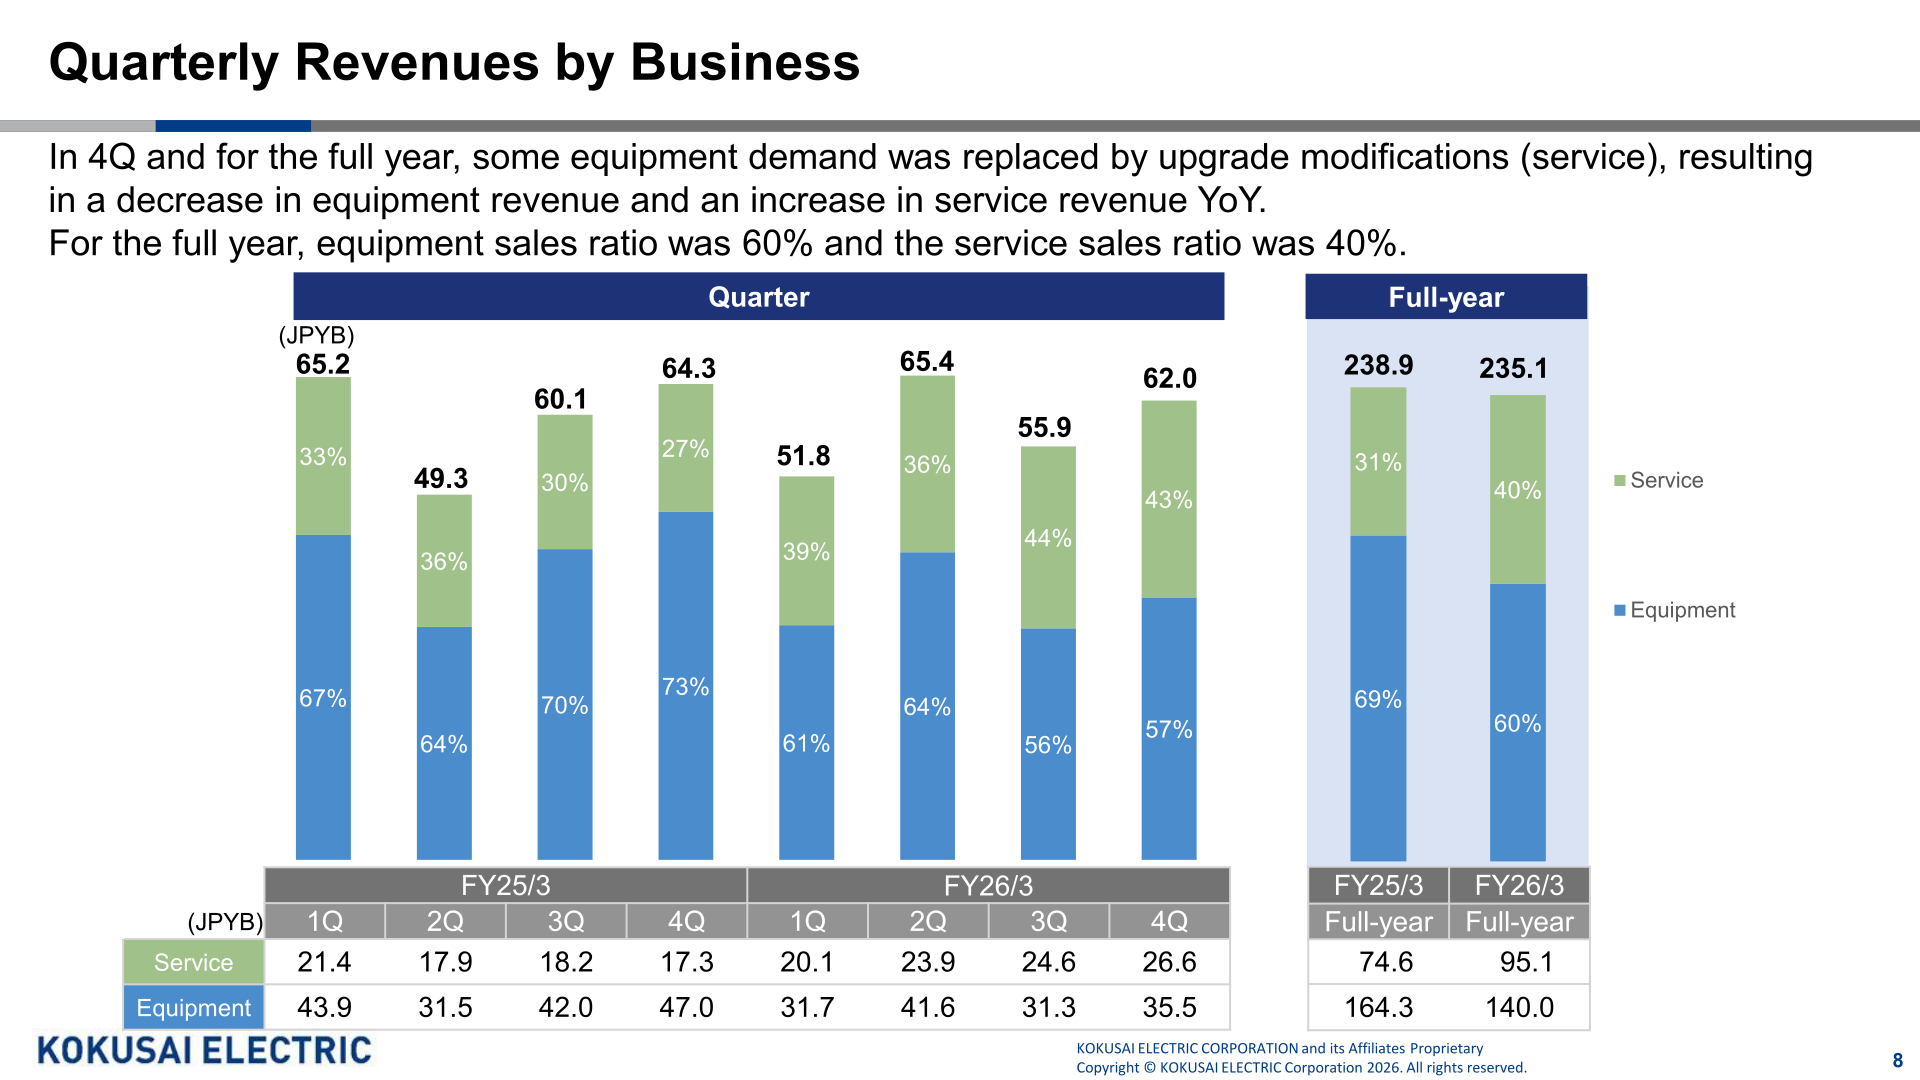
By business, full-year equipment revenue was JPY 140.0 billion (FY25/3: 164.3) and service revenue was JPY 95.1 billion (FY25/3: 74.6); in 4Q and for the full year, some equipment demand was replaced by upgrade modifications (service), resulting in a decrease in equipment revenue and an increase in service revenue YoY. For the full year, the equipment sales ratio was 60% and the service sales ratio was 40%. By application, 300mm equipment revenue was JPY 140.0 billion (FY25/3: 164.3) and 200mm or less equipment revenue was JPY 13.6 billion (FY25/3: 16.5); for the full year, revenue for NAND increased 90%, DRAM decreased 44%, and Logic/Foundry decreased 11% YoY. In 4Q, equipment sales for major applications decreased YoY, but sales for DRAM and Logic/Foundry increased QoQ. By destination, revenue for overseas was JPY 212.3 billion (FY25/3: 219.1) and revenue for Japan was JPY 22.8 billion (FY25/3: 19.9); for the full year, the ratio of revenue from the U.S. and China fell to 3% and 39%, respectively, and in 4Q, both YoY and QoQ, revenue from Taiwan and Korea increased while revenue from China decreased. By account, 4Q revenue from Non-China increased QoQ in equipment sales for all applications and service revenue, while 4Q revenue from China decreased in equipment sales for NAND and increased in DRAM and Logic/Foundry QoQ; due to growth in revenue from Non-China, the ratio of revenue from China fell to 26% in 4Q (Non-China 74%).
| Breakdown (JPYB) | Category | FY25/3 Full-year | FY26/3 Full-year |
|---|---|---|---|
| By business | Equipment | 164.3 | 140.0 |
| By business | Service | 74.6 | 95.1 |
| By application (equipment) | 300mm Equipment | 164.3 | 140.0 |
| By application (equipment) | 200mm or Less Equipment | 16.5 | 13.6 |
| By destination | For overseas | 219.1 | 212.3 |
| By destination | For Japan | 19.9 | 22.8 |
| Total | Revenue | 238.9 | 235.1 |
FY27/3 Forecast
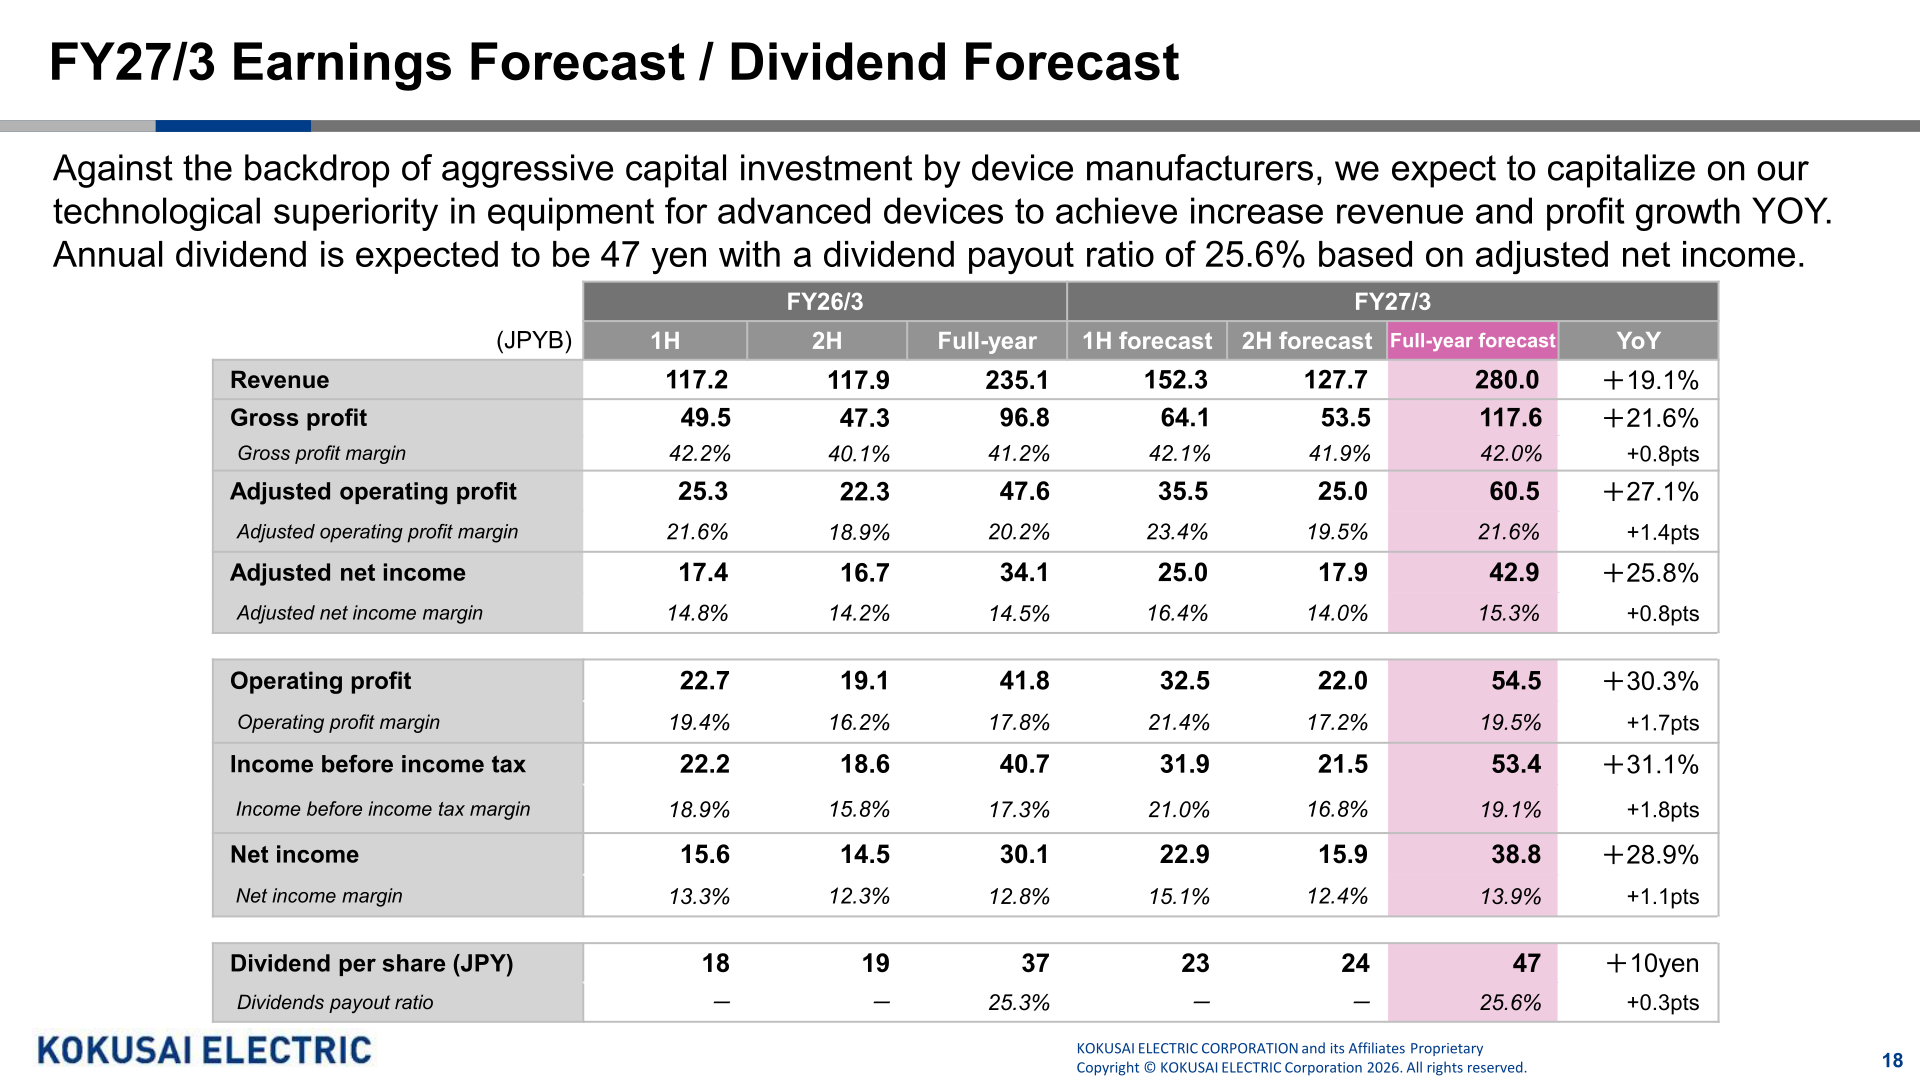
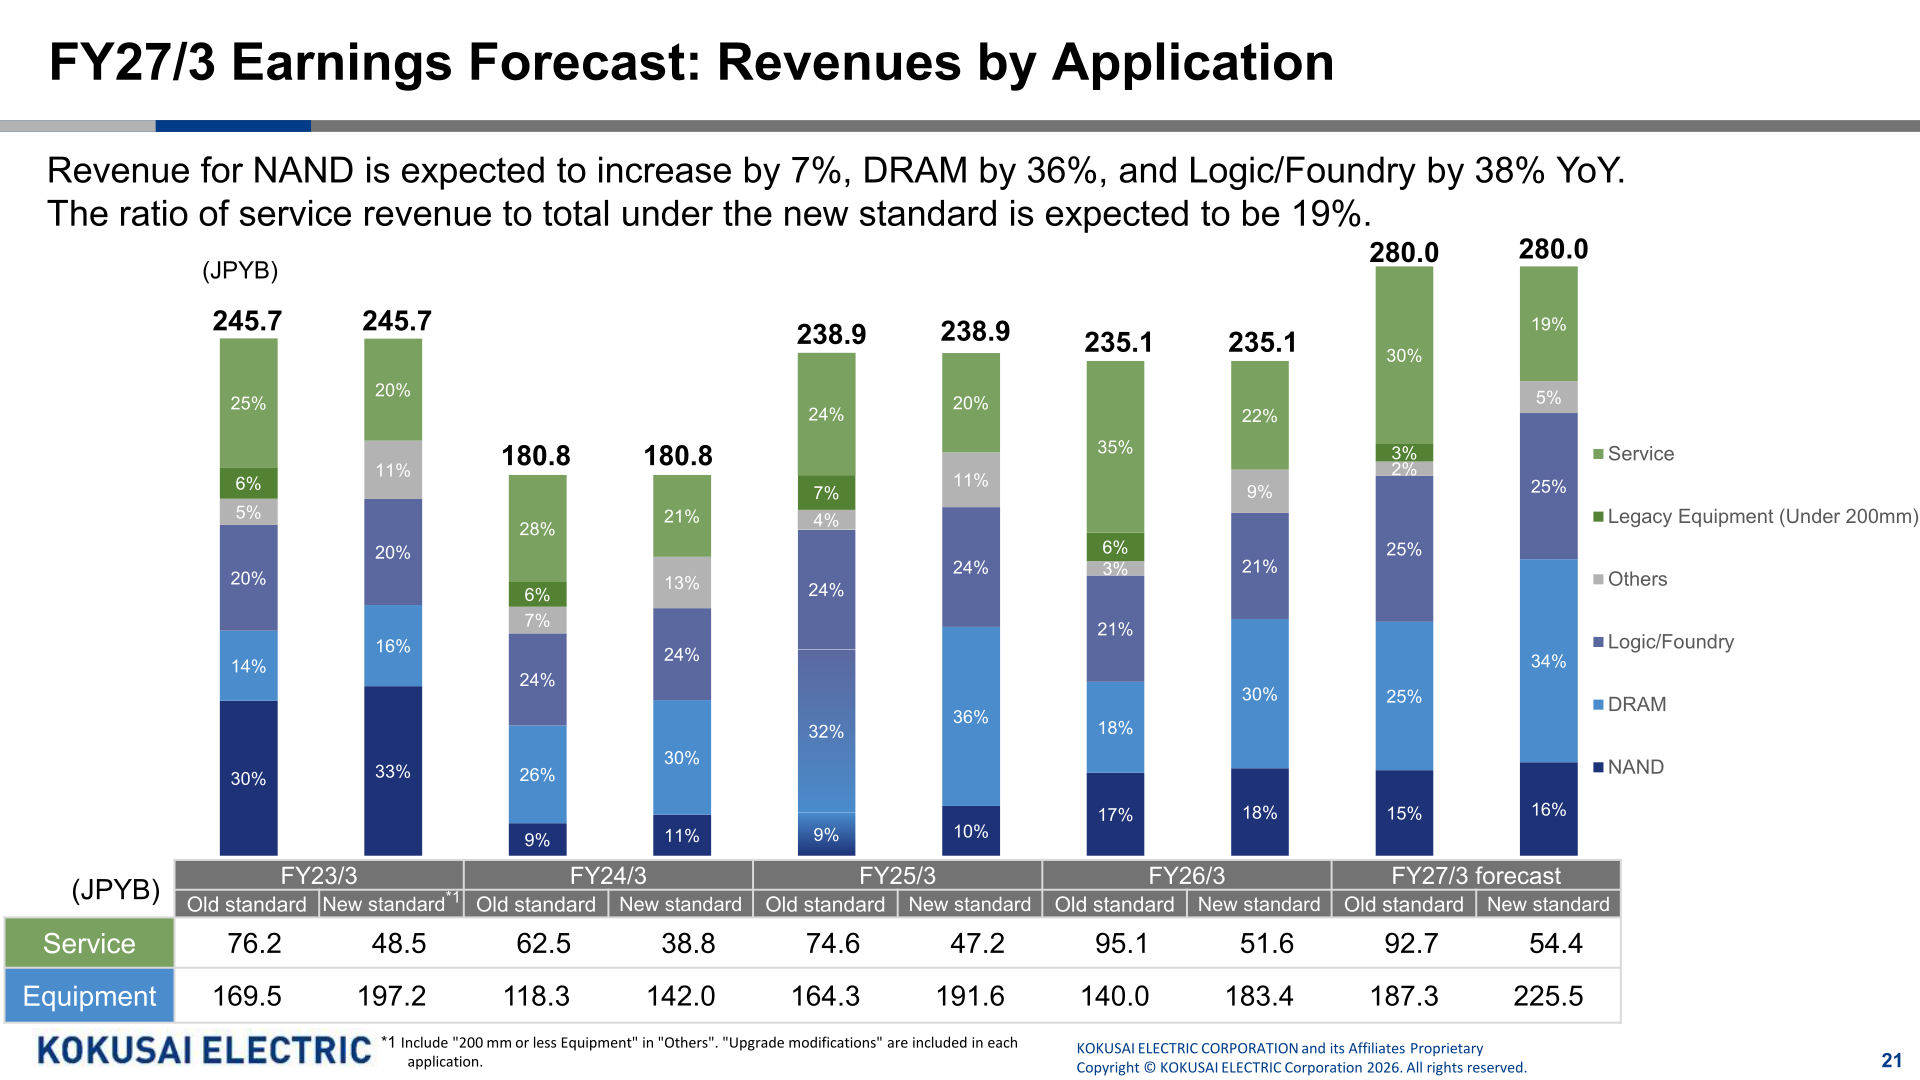
Semiconductor device manufacturers are expected to further accelerate capital investment to address generation shift and expand production capacity, especially for high-performance devices. For FY27/3, the company expects revenue and profit to increase YoY due to aggressive capital investment by device manufacturers and, utilizing its technological superiority in equipment for advanced devices, aims for growth exceeding WFE growth. The forecast calls for revenue of JPY 280.0 billion (+19.1%), gross profit of JPY 117.6 billion (+21.6%, margin 42.0%), adjusted operating profit of JPY 60.5 billion (+27.1%, margin 21.6%), adjusted net income of JPY 42.9 billion (+25.8%), operating profit of JPY 54.5 billion (+30.3%) and net income of JPY 38.8 billion (+28.9%). By half, revenue is forecast at 152.3 in 1H and 127.7 in 2H, and adjusted operating profit at 35.5 in 1H and 25.0 in 2H (JPYB). Revenue is expected to increase by 19% YoY: while sales of equipment for China will decline slightly, sales of equipment for Non-China are expected to rise significantly; adjusted operating profit is expected to increase by 27% YoY due to higher sales and an improved gross profit margin (sales, etc. increase +18.6, gross profit margin increase +2.2; SG&A -7.9). From FY27/3, the company will change its business category, transferring “Upgrade modification”, “200 mm equipment” and “Used equipment”, previously categorized as services, to the equipment business to make disclosures more aligned with the WFE market. Under the new standard, FY27/3 equipment revenue is forecast at JPY 225.5 billion (FY26/3 new standard: 183.4) and service revenue at JPY 54.4 billion (FY26/3 new standard: 51.6), with the service revenue ratio expected to be 19%. Revenue for NAND is expected to increase by 7%, DRAM by 36%, and Logic/Foundry by 38% YoY. Revenue in Non-China is expected to increase by 30% YoY, and sales in China will be down 2% YoY due to the transitional period in NAND investment, with the ratio of revenue from China declining to 29% (by account) and 34% (by destination). The ratio of high value-added products is expected to be 71%.
| Item (JPYB) | FY26/3 Full-year | FY27/3 Full-year forecast | YoY |
|---|---|---|---|
| Revenue | 235.1 | 280.0 | +19.1% |
| Gross profit | 96.8 | 117.6 | +21.6% |
| Gross profit margin | 41.2% | 42.0% | +0.8pts |
| Adjusted operating profit | 47.6 | 60.5 | +27.1% |
| Adjusted operating profit margin | 20.2% | 21.6% | +1.4pts |
| Adjusted net income | 34.1 | 42.9 | +25.8% |
| Operating profit | 41.8 | 54.5 | +30.3% |
| Income before income tax | 40.7 | 53.4 | +31.1% |
| Net income | 30.1 | 38.8 | +28.9% |
| Dividend per share (JPY) | 37 | 47 | +10yen |
| Dividends payout ratio | 25.3% | 25.6% | +0.3pts |
Shareholder Returns
The year-end dividend for FY26/3 was increased by 1 yen to 19 yen due to higher-than-expected profits, bringing the annual dividend to 37 yen (interim 18 yen, year-end 19 yen), unchanged from FY25/3 (37 yen) and above the previous forecast of 36 yen; the dividend payout ratio was 25.3%. For FY27/3, the annual dividend is expected to be 47 yen (interim 23 yen, year-end 24 yen; +10yen) with a dividend payout ratio of 25.6% based on adjusted net income.
Mid-term Objectives and Topics
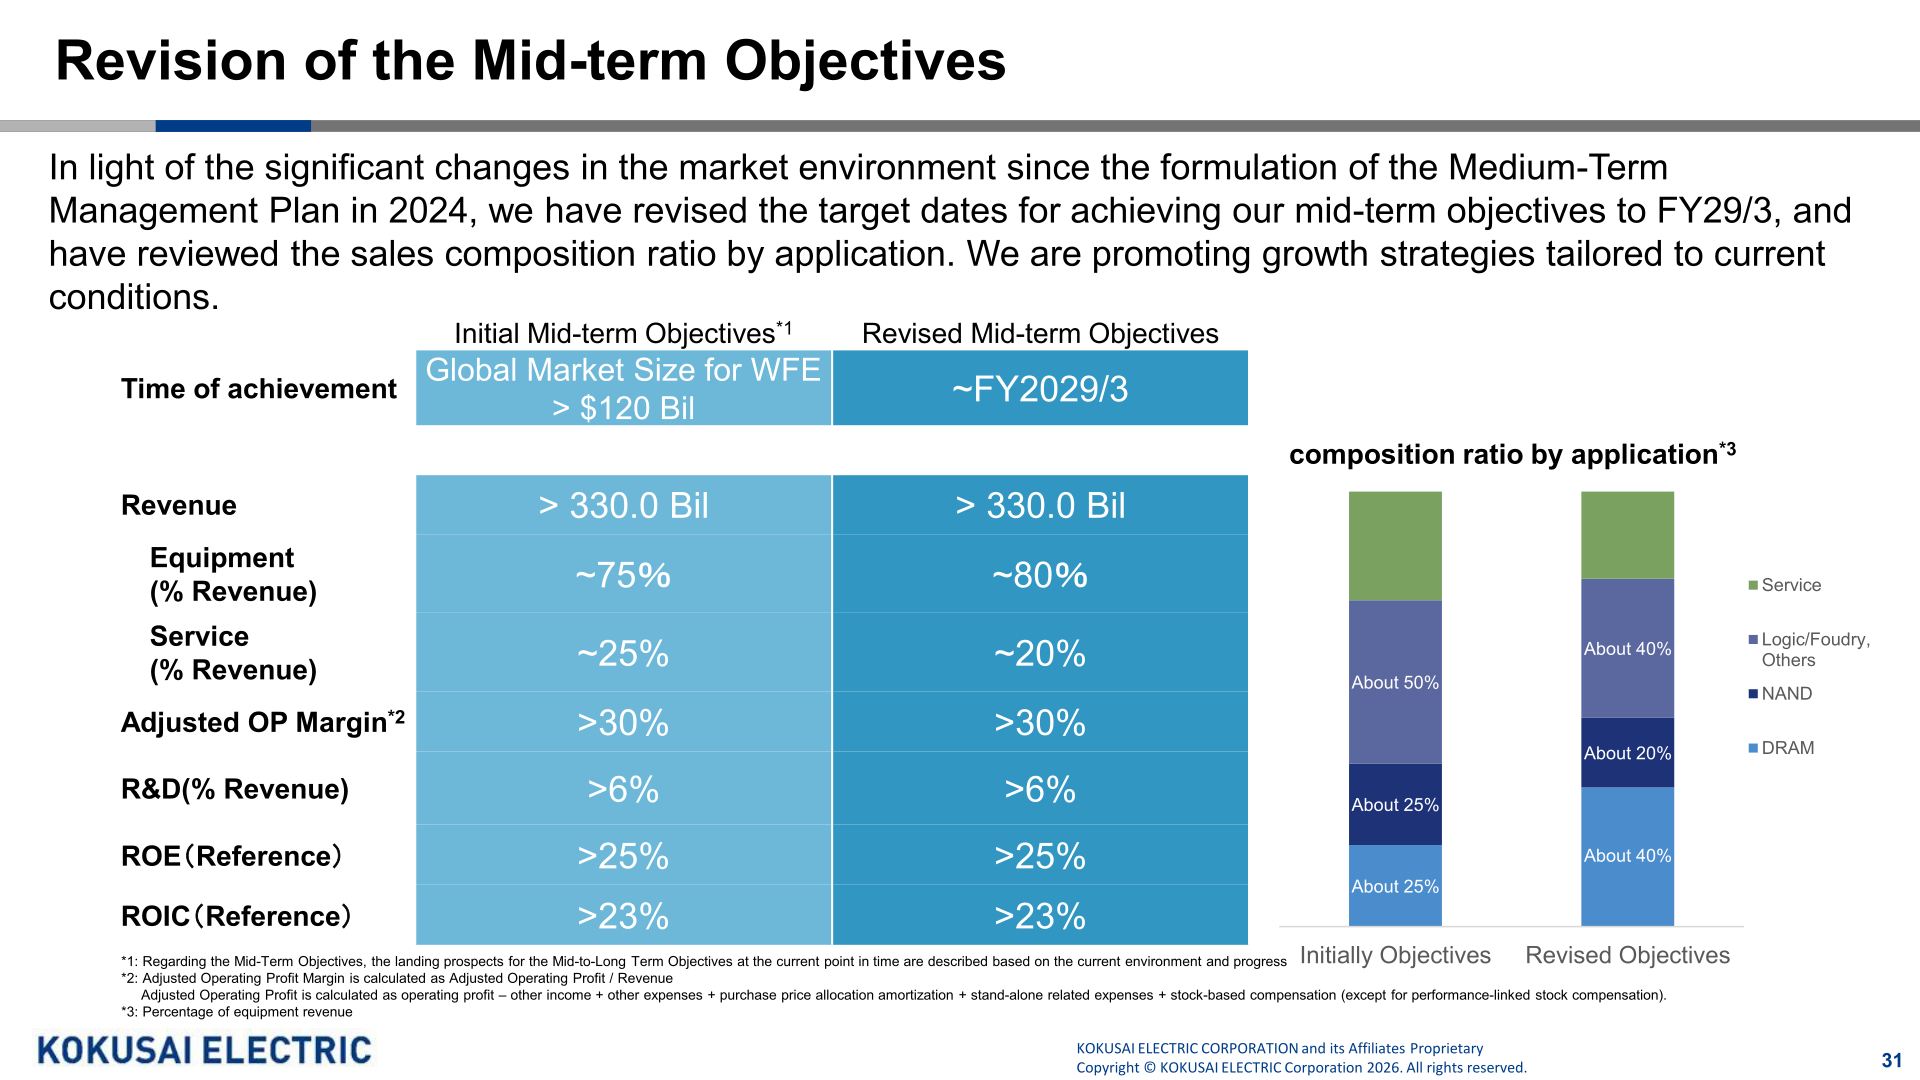
In light of the significant changes in the market environment since the formulation of the Medium-Term Management Plan in 2024, the company has revised the target dates for achieving its mid-term objectives to FY29/3 and reviewed the sales composition ratio by application. The revised mid-term objectives are revenue of > 330.0 Bil (unchanged), equipment ~80% of revenue (initially ~75%) and service ~20% (initially ~25%), adjusted OP margin >30%, R&D >6% of revenue, ROE (reference) >25% and ROIC (reference) >23%, against a global WFE market size of > $120 Bil. In CY25, the company achieved the top market share in the batch deposition equipment market, its market share of batch ALD compatible deposition equipment reached 80%, and it also captured the top market share in single-wafer treatment equipment (Plasma Gate Modification Tools). Regarding the business environment, WFE is expected to grow around +15% YoY in CY26 and to around US$190B by CY2030. The company also decided to newly acquire a property adjacent to its Tonami Manufacturing Center (site area approx. 43,000 ㎡, acquisition cost approx. 1.0 billion yen) in anticipation of further market expansion after 2031, and revamped its business operations structure effective April 1.
This article is an analysis based on publicly available information and is not a recommendation to buy or sell any specific securities. Investment decisions are your own responsibility.
![[Obayashi] Investors’ Guide 2026 — The Complete 24-Article Breakdown](https://japan-equity.com/wp-content/uploads/2026/07/hub_cover-1024x1024.png)
![[Obayashi] IR & SR Policy — Feeding Dialogue Back into Management](https://japan-equity.com/wp-content/uploads/2026/07/p32_sq-1024x1024.jpg)
![[Obayashi] Real Estate Development — 18.7% Margin, ¥287.7bn Unrealized Gains](https://japan-equity.com/wp-content/uploads/2026/07/p20_sq-1024x1024.jpg)
![[Obayashi] Domestic Civil Engineering — Resilience Spending Supports 9.6% Margin](https://japan-equity.com/wp-content/uploads/2026/07/p11_sq-1024x1024.jpg)
![[Obayashi] Share Price & External Ratings — vs TOPIX, ESG Index Inclusion](https://japan-equity.com/wp-content/uploads/2026/07/p40_sq-1024x1024.jpg)
![[Construction] ¥75.5tn Investment, Shrinking Workforce — Big-5 Market Share](https://japan-equity.com/wp-content/uploads/2026/07/p12_sq-1024x1024.jpg)



![[Obayashi] Capital Policy & Shareholder Returns — ROE 10%+, DOE ~5%, ¥100bn Buyback](https://japan-equity.com/wp-content/uploads/2026/07/p27_sq-1024x1024.jpg)
![[Obayashi] Reducing Cross-Shareholdings — ¥285.2bn Sold in Five Years](https://japan-equity.com/wp-content/uploads/2026/07/p29_sq-1024x1024.jpg)
![[Obayashi] ¥750bn Investment Plan — ¥300bn to Development, ¥190bn to Tech/DX](https://japan-equity.com/wp-content/uploads/2026/07/p30_sq-1024x1024.jpg)
![[Obayashi] MTP2022 KPIs — Operating Profit ~2x Target, ROE 14.4%](https://japan-equity.com/wp-content/uploads/2026/07/p25_sq-1024x1024.jpg)
![[Obayashi] Cash Allocation — ¥420bn Investment CF Over Five Years](https://japan-equity.com/wp-content/uploads/2026/07/p26_sq-1024x1024.jpg)
![[Obayashi] Green Energy — 44 Plants, 344MW, and the Green Hydrogen Challenge](https://japan-equity.com/wp-content/uploads/2026/07/p21_sq-1024x1024.jpg)
![[Obayashi] Tackling the Labor Shortage — Robotics Construction®](https://japan-equity.com/wp-content/uploads/2026/07/p14_sq-1024x1024.jpg)
