
This article is based on publicly available IR materials and is not a recommendation to buy or sell any specific securities.
JTEKT CORPORATION (6473) released its “Financial results of fiscal year ended March 2026 (FY2025)” presentation dated May 20, 2026. Unless otherwise noted, amounts below are stated in the unit used by the presentation, 100 million yen. Consolidated revenue rose 2.2% year on year to 19,249, business profit increased 16.5% to 756 as sales recovery and cost improvement activities such as the North America Task Force Team (TFT) offset the impact of U.S. tariffs and inflation, while profit for the period (profit attributable to owners of the parent company) decreased 12.7% to 119 due to restructuring costs in Europe and the U.S. For FY2026 the company aims for record-high business profit of JPY 90 billion, operating profit of JPY 75 billion and profit for the period of JPY 50 billion. The annual dividend for FY2025 is 60 yen per share (DOE 2.5%) and the expected dividend for FY2026 is 70 yen (+10 yen, DOE 2.8%).
Consolidated Results (Full-Year Actual, FY2025)
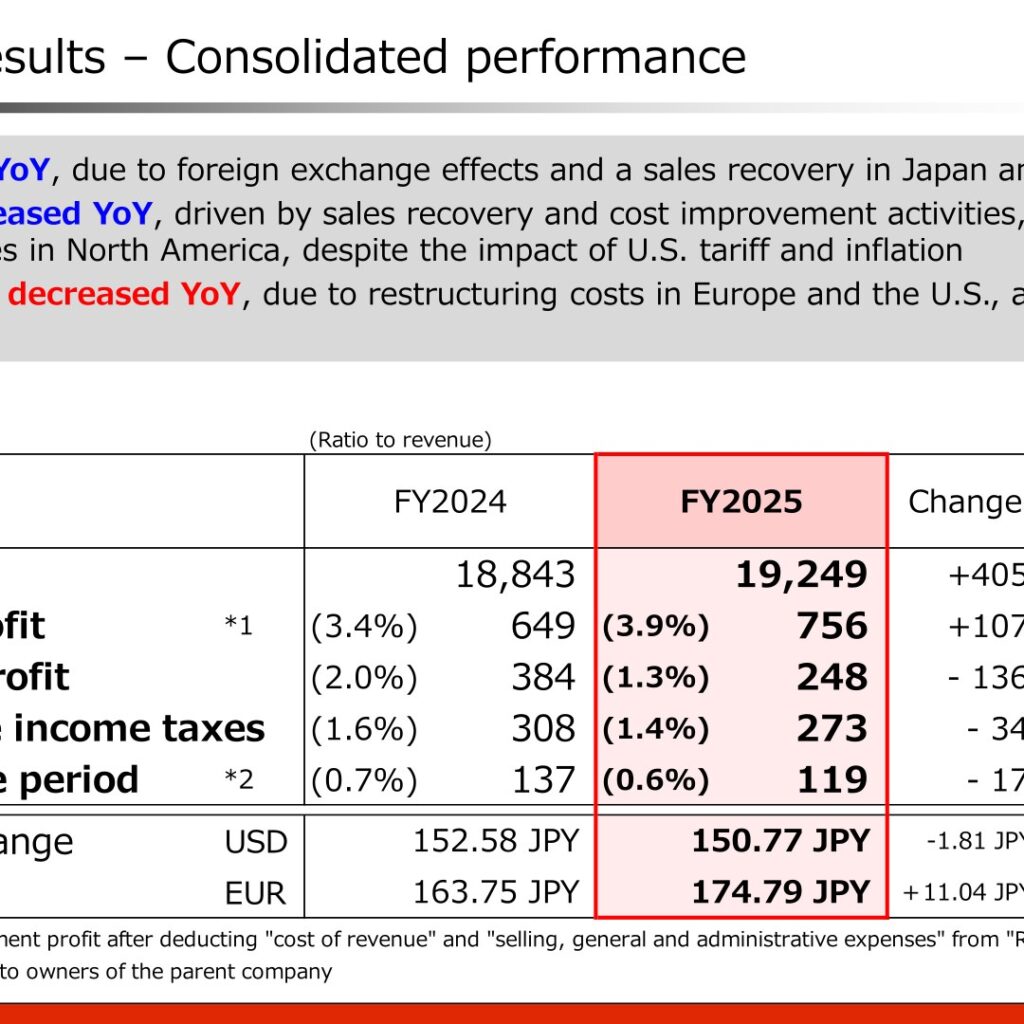
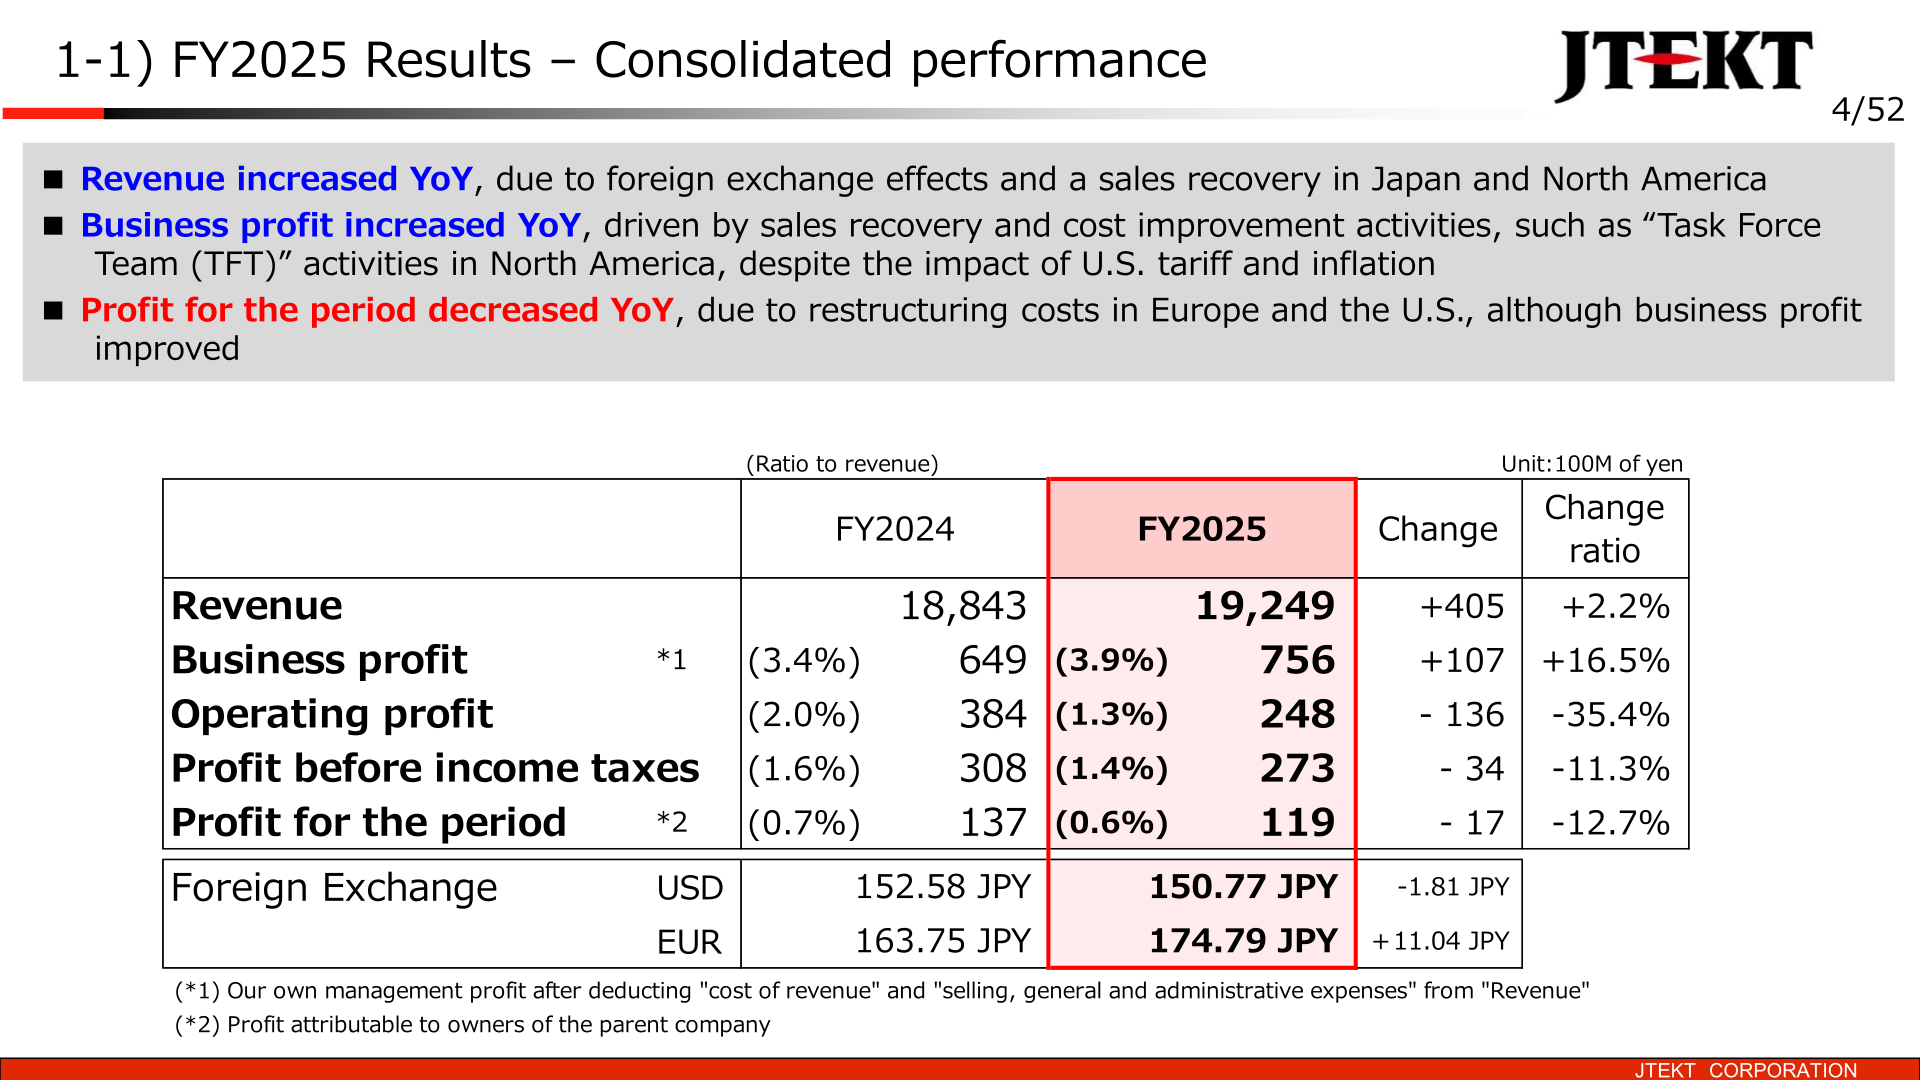
Revenue was 19,249 (100 million yen), up 405 (+2.2%) from 18,843 in FY2024, due to foreign exchange effects and a sales recovery in Japan and North America. Business profit, the company’s own management profit after deducting cost of revenue and selling, general and administrative expenses from revenue, rose 107 (+16.5%) to 756, with the ratio to revenue improving from 3.4% to 3.9%. Operating profit fell 136 (-35.4%) to 248 and profit before income taxes fell 34 (-11.3%) to 273, as other income/other expenses worsened from -264 to -508. Profit for the period decreased 17 (-12.7%) to 119 (ratio to revenue 0.6%). The average exchange rates were 150.77 JPY per USD (FY2024: 152.58 JPY, -1.81 JPY) and 174.79 JPY per EUR (FY2024: 163.75 JPY, +11.04 JPY).
| Item (100 million yen) | FY2024 | FY2025 | Change | Change ratio |
|---|---|---|---|---|
| Revenue | 18,843 | 19,249 | +405 | +2.2% |
| Business profit (ratio to revenue) | 649 (3.4%) | 756 (3.9%) | +107 | +16.5% |
| Operating profit (ratio to revenue) | 384 (2.0%) | 248 (1.3%) | -136 | -35.4% |
| Profit before income taxes (ratio to revenue) | 308 (1.6%) | 273 (1.4%) | -34 | -11.3% |
| Profit for the period (ratio to revenue) | 137 (0.7%) | 119 (0.6%) | -17 | -12.7% |
| Foreign exchange USD | 152.58 JPY | 150.77 JPY | -1.81 JPY | – |
| Foreign exchange EUR | 163.75 JPY | 174.79 JPY | +11.04 JPY | – |
In the business profit analysis, the company states that business profit increased despite timing differences in customer recoveries for U.S. tariffs and inflation, driven by cost improvement activities (including North America TFT) and realization of structural reform effects in Europe and North America. The U.S. tariff impact was -233, against which internal efforts for recovery such as sales price increases contributed +191; inflation costs were -105, with recovery of +85. Separately, the company cites a profit impact from U.S. tariffs of -4.2 billion yen for FY2025. Structural reform effects refer to the sale of the NRB (needle roller bearing) business in Europe and the transfer of TRB (tapered roller bearing) production in North America.
Cash flows from operating activities were 1,084 (FY2024: 802, +282) and cash flows from investing activities were -527 (FY2024: -759, +232), resulting in free cash flows of 557 (FY2024: 43, +514). Cash and cash equivalents at year-end were 1,375 (+184). Interest-bearing debt declined from 2,404 to 2,171, the net DE ratio was 0.10 (FY2024: 0.16), inventories decreased from 2,577 to 2,444, and equity attributable to owners of the parent company increased from 7,450 to 7,902; total assets were 15,776 (+123).
Results by Region and by Business Unit
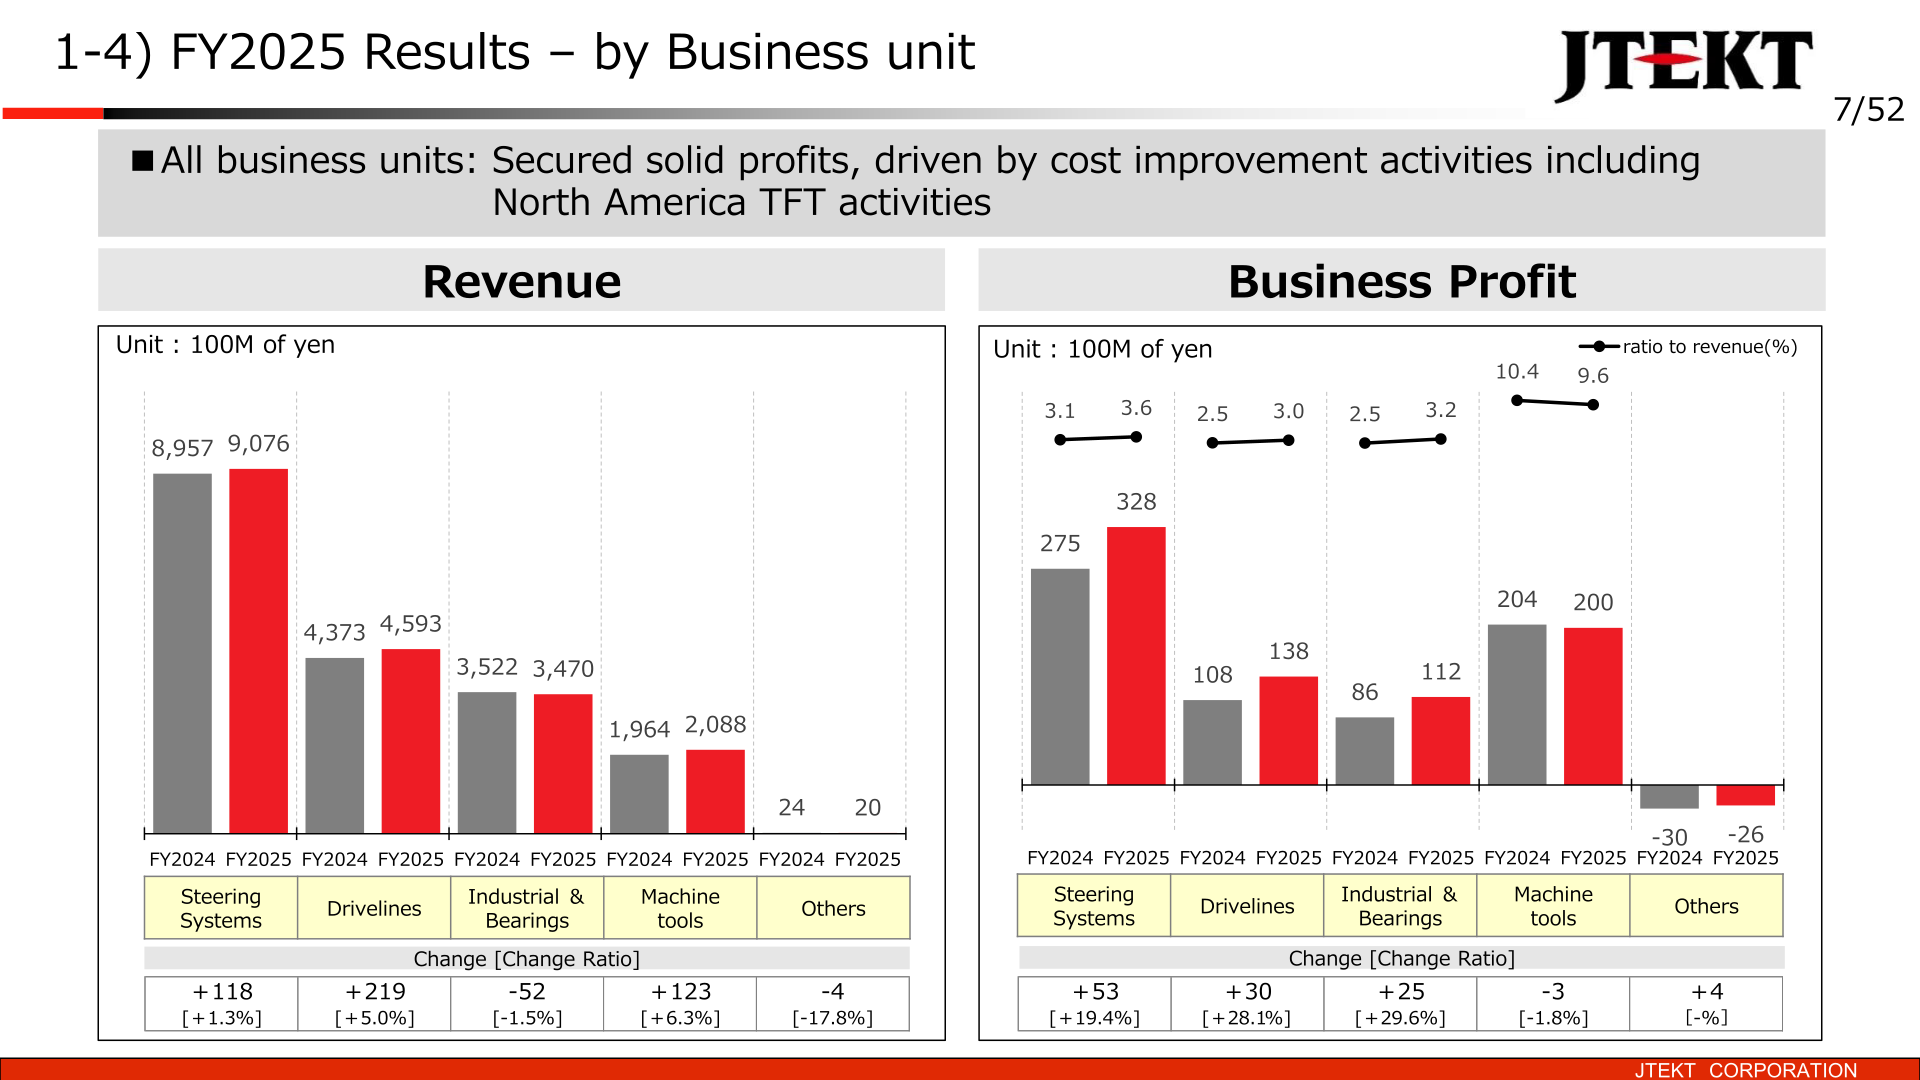
By region, North America posted a significant profit increase on higher revenue and TFT effects (revenue 5,254, +8.2%; business profit 175, up from 57), while Europe and China recorded decreased revenue and profit in a challenging market environment. Japan’s revenue rose 2.8% to 7,599 with business profit of 289 (+10.4%), and Asia & Others grew revenue 5.2% to 2,992 with business profit of 313 (+23.8%). By business unit, all units secured solid profits driven by cost improvement activities including North America TFT activities: Steering Systems business profit rose 19.4% to 328, Drivelines 28.1% to 138 and Industrial & Bearings 29.6% to 112, while Machine tools edged down 1.8% to 200 on revenue growth of 6.3%.
| Region (100 million yen) | Revenue FY2024 | Revenue FY2025 | Change [Change ratio] | Business profit FY2024 | Business profit FY2025 | Change [Change ratio] |
|---|---|---|---|---|---|---|
| Japan | 7,390 | 7,599 | +209 [+2.8%] | 262 | 289 | +27 [+10.4%] |
| North America | 4,853 | 5,254 | +400 [+8.2%] | 57 | 175 | +117 [+203.7%] |
| Europe | 2,151 | 2,006 | -145 [-6.8%] | -67 | -105 | -37 [-%] |
| China | 1,603 | 1,396 | -207 [-12.9%] | 122 | 99 | -23 [-19.0%] |
| Asia & Others | 2,844 | 2,992 | +148 [+5.2%] | 253 | 313 | +60 [+23.8%] |
| Elimination | – | – | – | 21 | -16 | -37 [-%] |
| Total | 18,843 | 19,249 | +405 [+2.2%] | 649 | 756 | +107 [+16.5%] |
| Business unit (100 million yen) | Revenue FY2024 | Revenue FY2025 | Change [Change ratio] | Business profit FY2024 | Business profit FY2025 | Change [Change ratio] |
|---|---|---|---|---|---|---|
| Steering Systems | 8,957 | 9,076 | +118 [+1.3%] | 275 | 328 | +53 [+19.4%] |
| Drivelines | 4,373 | 4,593 | +219 [+5.0%] | 108 | 138 | +30 [+28.1%] |
| Industrial & Bearings | 3,522 | 3,470 | -52 [-1.5%] | 86 | 112 | +25 [+29.6%] |
| Machine tools | 1,964 | 2,088 | +123 [+6.3%] | 204 | 200 | -3 [-1.8%] |
| Others | 24 | 20 | -4 [-17.8%] | -30 | -26 | +4 [-%] |
| Elimination | – | – | – | 5 | 3 | -2 [-42.0%] |
| Total | 18,843 | 19,249 | +405 [+2.2%] | 649 | 756 | +107 [+16.5%] |
FY2026 Forecast
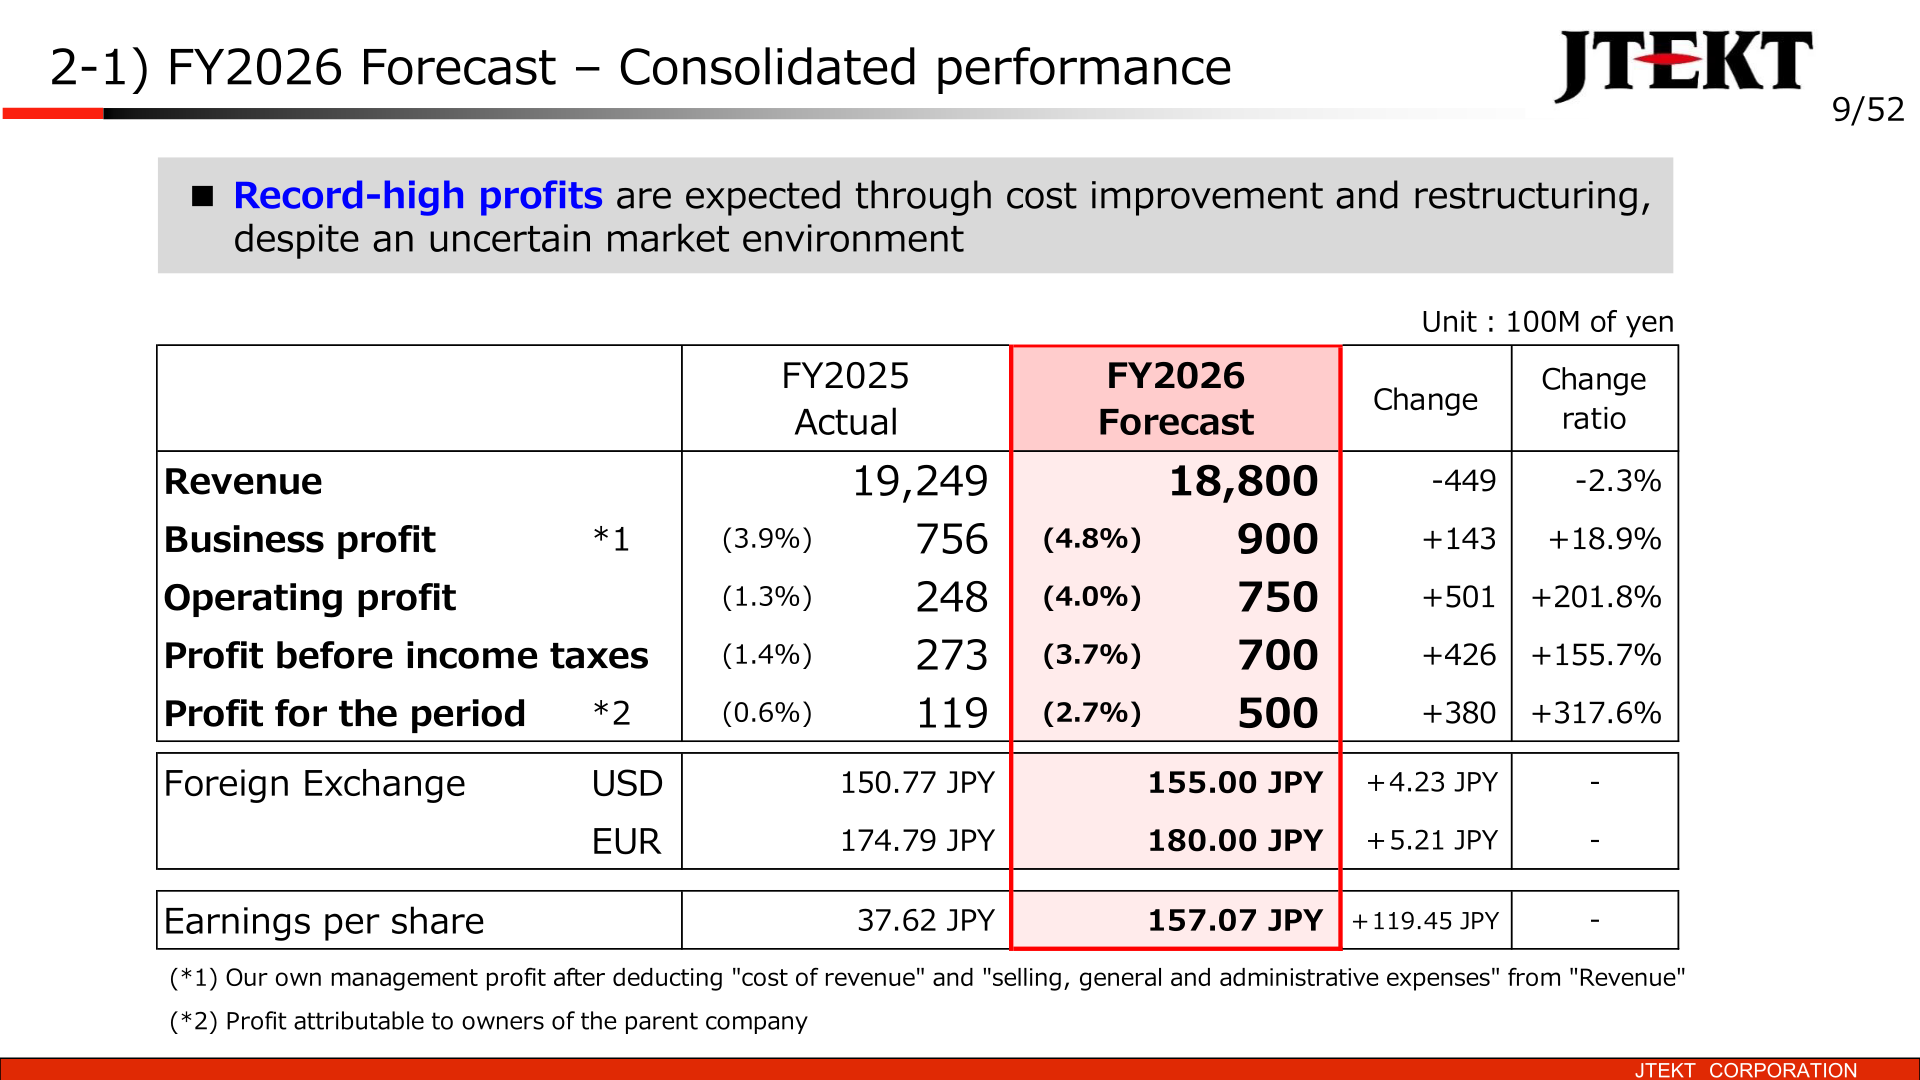
For FY2026 (fiscal year ending March 2027), JTEKT forecasts revenue of 18,800 (100 million yen), down 449 (-2.3%), but business profit of 900 (+143, +18.9%; ratio to revenue 4.8%), operating profit of 750 (+501, +201.8%), profit before income taxes of 700 (+426, +155.7%) and profit for the period of 500 (+380, +317.6%), all record-high profits, through cost improvement and restructuring despite an uncertain market environment. Business profit is expected to increase while the company steadily executes investments for future growth including R&D, production preparation and ADC expansion, combined with continued TFT activities, productivity-driven cost improvements and further realization of structural reform effects in Europe and North America. Assumed exchange rates are 155.00 JPY per USD and 180.00 JPY per EUR; earnings per share are forecast at 157.07 JPY (FY2025: 37.62 JPY). By region, North America is expected to further expand profitability (business profit 257, +46.4%), while Europe expects decreased revenue (1,450, -27.7%) and increased profit (-80, +25) due to the transfer of the Auto business with European customers as part of structural reforms. By business unit, profit increases are expected in all businesses, particularly in Steering Systems (402, +22.7%), driven by significant impacts from North America TFT activities and structural reforms in Europe.
| Item (100 million yen) | FY2025 Actual | FY2026 Forecast | Change | Change ratio |
|---|---|---|---|---|
| Revenue | 19,249 | 18,800 | -449 | -2.3% |
| Business profit (ratio to revenue) | 756 (3.9%) | 900 (4.8%) | +143 | +18.9% |
| Operating profit (ratio to revenue) | 248 (1.3%) | 750 (4.0%) | +501 | +201.8% |
| Profit before income taxes (ratio to revenue) | 273 (1.4%) | 700 (3.7%) | +426 | +155.7% |
| Profit for the period (ratio to revenue) | 119 (0.6%) | 500 (2.7%) | +380 | +317.6% |
| Foreign exchange USD | 150.77 JPY | 155.00 JPY | +4.23 JPY | – |
| Foreign exchange EUR | 174.79 JPY | 180.00 JPY | +5.21 JPY | – |
| Earnings per share | 37.62 JPY | 157.07 JPY | +119.45 JPY | – |
| Region / Business unit (100 million yen) | Revenue FY2025 | Revenue FY2026 Forecast | Change [Change ratio] | Business profit FY2025 | Business profit FY2026 Forecast | Change [Change ratio] |
|---|---|---|---|---|---|---|
| Japan | 7,599 | 7,165 | -434 [-5.7%] | 289 | 290 | +0 [+0.1%] |
| North America | 5,254 | 5,525 | +270 [+5.2%] | 175 | 257 | +81 [+46.4%] |
| Europe | 2,006 | 1,450 | -556 [-27.7%] | -105 | -80 | +25 [-%] |
| China | 1,396 | 1,310 | -86 [-6.2%] | 99 | 85 | -14 [-14.2%] |
| Asia & Others | 2,992 | 3,350 | +357 [+11.9%] | 313 | 348 | +34 [+10.9%] |
| Steering Systems | 9,076 | 8,635 | -441 [-4.9%] | 328 | 402 | +74 [+22.7%] |
| Drivelines | 4,593 | 4,535 | -58 [-1.3%] | 138 | 146 | +8 [+5.9%] |
| Industrial & Bearings | 3,470 | 3,435 | -35 [-1.0%] | 112 | 159 | +47 [+42.3%] |
| Machine tools | 2,088 | 2,175 | +86 [+4.2%] | 200 | 210 | +9 [+4.7%] |
| Others | 20 | 20 | -0 [-2.5%] | -26 | -19 | +6 [-%] |
Shareholder Returns
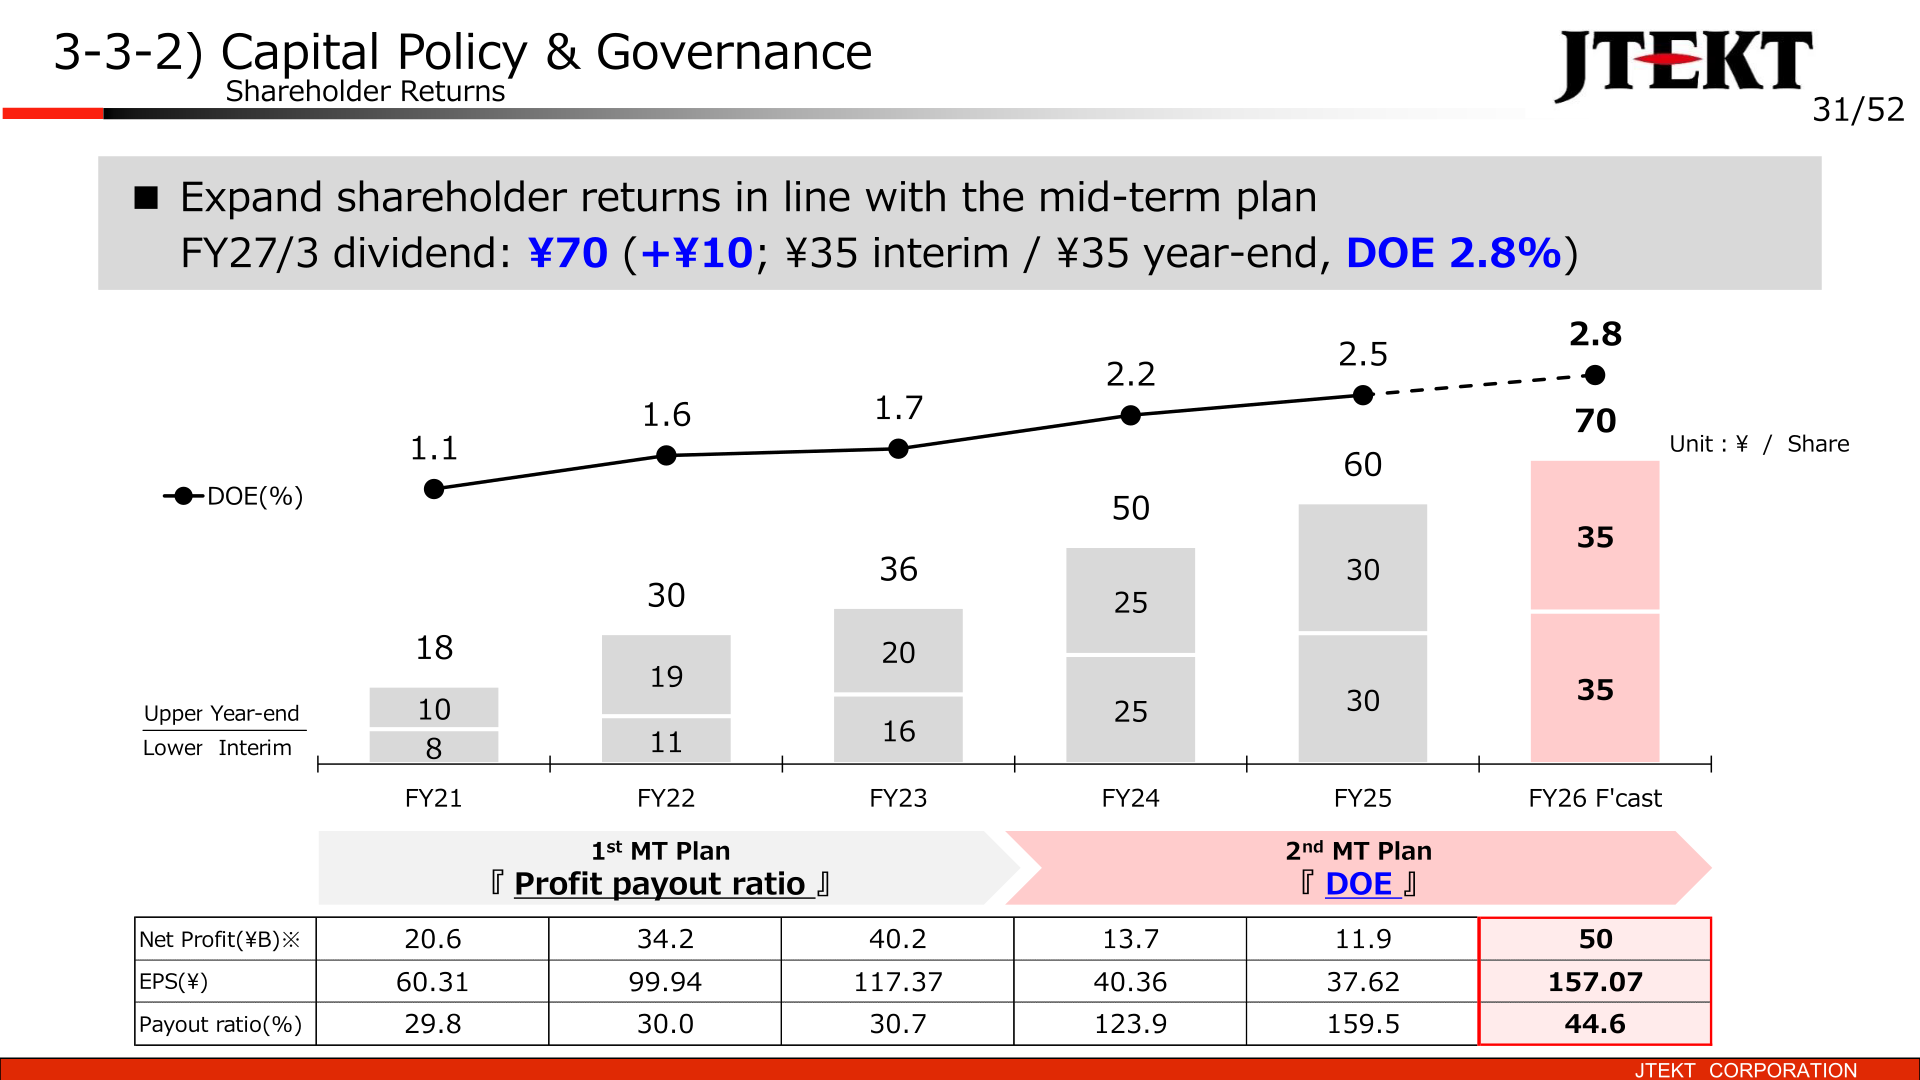
The dividend per share for FY2025 is 60 yen (interim 30 yen and year-end 30 yen; DOE 2.5%), up from 50 yen in FY2024, and the expected dividend per share for FY2026 is 70 yen (+10 yen YoY; interim 35 yen and year-end 35 yen; DOE 2.8%). Under the 2nd period of the Mid-Term Plan the company adopts a DOE-based dividend policy, replacing the profit payout ratio basis of the 1st period, and states it will expand shareholder returns in line with the mid-term plan. Net profit was 11.9 billion yen in FY25 (FY24: 13.7 billion yen; FY26 forecast: 50 billion yen), EPS was 37.62 yen (FY24: 40.36 yen; FY26 forecast: 157.07 yen), and the payout ratio was 159.5% (FY24: 123.9%; FY26 forecast: 44.6%). The company also refers to enhanced shareholder returns through DOE dividends, a higher payout and its 1st buyback during the 2nd Mid-Term Plan.
| Item | FY21 | FY22 | FY23 | FY24 | FY25 | FY26 Forecast |
|---|---|---|---|---|---|---|
| Annual dividend per share (yen) | 18 | 30 | 36 | 50 | 60 | 70 |
| DOE (%) | 1.1 | 1.6 | 1.7 | 2.2 | 2.5 | 2.8 |
| Net profit (billion yen) | 20.6 | 34.2 | 40.2 | 13.7 | 11.9 | 50 |
| EPS (yen) | 60.31 | 99.94 | 117.37 | 40.36 | 37.62 | 157.07 |
| Payout ratio (%) | 29.8 | 30.0 | 30.7 | 123.9 | 159.5 | 44.6 |
Progress of the 2nd Period of the Mid-Term Plan
FY2026 is the final year of the 2nd period of the Mid-Term Plan, and the company states it executed planned initiatives over the two years and will fully complete all measures in the final year, while driving future initiatives in parallel to prepare for the value creation phase of the 3rd period. Key achievements cited are profitability improvement in North America (loss cost reduction through TFT activities), execution of structural reforms in Europe (transfer of the NRB business and transfer of the Auto business for European customers), streamlining of invested capital, and the launch of SbW (Steer by Wire) and Pairdriver. Since the plan’s formulation, a sales decline in China, increased competition in the industrial machinery market and geopolitical risks (U.S. tariffs, the Middle East) have turned into headwinds; China revenue fell from 1,803 in FY2022 to 1,396 in FY2025, while the business profit margin was maintained in the 7% range (7.1% in FY2025) through proactive fixed cost reductions.
On the Group numerical targets, the company says that despite weaker sales due to changes in the business environment, ROE and business profit remain within reach of targets and are expected to be achieved ahead of schedule. In Europe, a basic agreement for the European automotive business transfer was reached in February 2026 with a closing target by the end of August, and the European business is expected to turn profitable by FY2027. On invested capital, an inventory reduction of ¥30B was achieved in FY25 excluding the impact of FX (13) and tariffs (4), and the reduction of cross-shareholdings from 77 in FY19 to zero is on track for full reduction in FY26. Business profit progressed from ¥64.9B (3.4%) in FY24 to ¥75.6B (3.9%) in FY25 and ¥90.0B (4.8%) in the FY26 forecast, with ROE moving from 1.8% to 1.6% and a forecast 6.2%; the company aims to complete the reforms in the Mid-Term Plan by FY27.
| Group numerical target | FY2025 Result | FY2026 Target | FY2026 Forecast |
|---|---|---|---|
| ROE | 1.4% | 7-8% | 6.2% |
| Business profit ratio | 3.9% | 5-6% | 4.8% |
| Revenue | 1.92 trillion yen | 2 trillion yen | 1.88 trillion yen |
| PBR | x 0.66 | x 1.0 | – |
| CO2 reduction goal (from FY2013) | -45% | -45% | – |
| Employee engagement (eNPS) | -63 | -55 | – |
Initiatives toward the 3rd Period of the Mid-Term Plan and Capital Policy
JTEKT announced Syncusteer as a new steer-by-wire brand on May 7, 2026 and is pursuing a de facto standardization strategy for SbW, for which demand is expected to increase rapidly from around 2030 alongside the spread of autonomous driving and BEVs. Other initiatives include flexible, volume-adaptive production line design, continued proactive investment in the North America FA business (ADC), including logistics center expansion and automation (FY2024: 13 million USD; FY2025: 39 million USD), and the rollout of “Factory Solutions” in FY2026 integrating equipment, automation processes, factory management (IoE) and CN solutions. Capital expenditures were 822 in FY2025 (FY2024: 969; FY2026 forecast: 730), depreciation and amortization 711 (FY2024: 717; FY2026 forecast: 720) and R&D expenses 564, 2.9% of revenue (FY2024: 558; FY2026 forecast: 610, 3.2%). Starting from FY2026, the Mid-Term Plan KPIs of ROE, CO2 reduction and employee engagement have been incorporated into performance-linked executive compensation, and the compensation design has been newly disclosed. Preparation for the 3rd period of the Mid-Term Plan is underway, with an announcement planned for early 2027.
This article is an analysis based on publicly available information and is not a recommendation to buy or sell any specific securities. Investment decisions are your own responsibility.
![[Obayashi] Investors’ Guide 2026 — The Complete 24-Article Breakdown](https://japan-equity.com/wp-content/uploads/2026/07/hub_cover-1024x1024.png)
![[Obayashi] IR & SR Policy — Feeding Dialogue Back into Management](https://japan-equity.com/wp-content/uploads/2026/07/p32_sq-1024x1024.jpg)
![[Obayashi] Real Estate Development — 18.7% Margin, ¥287.7bn Unrealized Gains](https://japan-equity.com/wp-content/uploads/2026/07/p20_sq-1024x1024.jpg)
![[Obayashi] Domestic Civil Engineering — Resilience Spending Supports 9.6% Margin](https://japan-equity.com/wp-content/uploads/2026/07/p11_sq-1024x1024.jpg)
![[Obayashi] Share Price & External Ratings — vs TOPIX, ESG Index Inclusion](https://japan-equity.com/wp-content/uploads/2026/07/p40_sq-1024x1024.jpg)
![[Construction] ¥75.5tn Investment, Shrinking Workforce — Big-5 Market Share](https://japan-equity.com/wp-content/uploads/2026/07/p12_sq-1024x1024.jpg)



![[Obayashi] Capital Policy & Shareholder Returns — ROE 10%+, DOE ~5%, ¥100bn Buyback](https://japan-equity.com/wp-content/uploads/2026/07/p27_sq-1024x1024.jpg)
![[Obayashi] Reducing Cross-Shareholdings — ¥285.2bn Sold in Five Years](https://japan-equity.com/wp-content/uploads/2026/07/p29_sq-1024x1024.jpg)
![[Obayashi] ¥750bn Investment Plan — ¥300bn to Development, ¥190bn to Tech/DX](https://japan-equity.com/wp-content/uploads/2026/07/p30_sq-1024x1024.jpg)
![[Obayashi] MTP2022 KPIs — Operating Profit ~2x Target, ROE 14.4%](https://japan-equity.com/wp-content/uploads/2026/07/p25_sq-1024x1024.jpg)
![[Obayashi] Cash Allocation — ¥420bn Investment CF Over Five Years](https://japan-equity.com/wp-content/uploads/2026/07/p26_sq-1024x1024.jpg)
![[Obayashi] Green Energy — 44 Plants, 344MW, and the Green Hydrogen Challenge](https://japan-equity.com/wp-content/uploads/2026/07/p21_sq-1024x1024.jpg)
![[Obayashi] Tackling the Labor Shortage — Robotics Construction®](https://japan-equity.com/wp-content/uploads/2026/07/p14_sq-1024x1024.jpg)
