
This article is based on publicly available IR materials and is not a recommendation to buy or sell any specific securities.
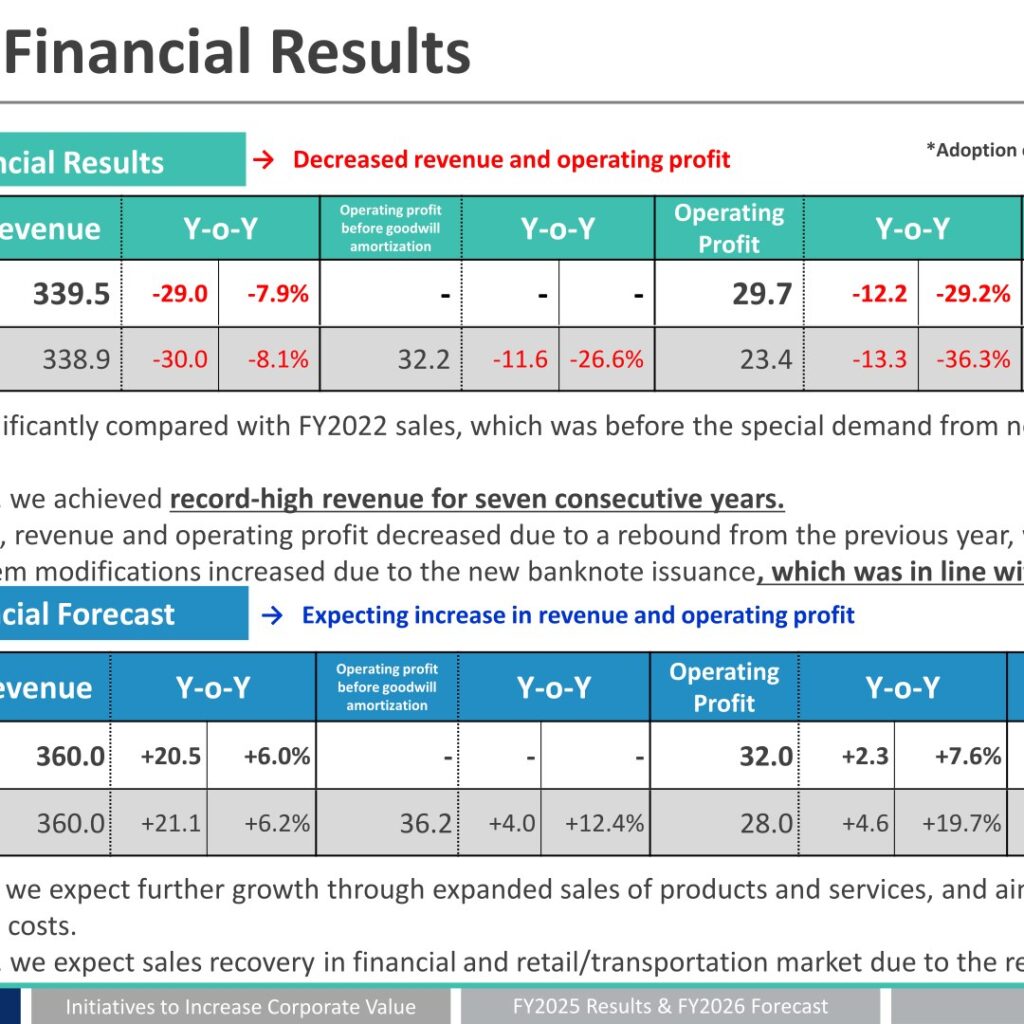
GLORY LTD. (6457) released its “FY2025 Consolidated Financial Results” presentation dated May 15, 2026, covering the fiscal year ended March 31, 2026 (the company’s “FY2025”). The company adopted IFRS from the FY2025 full-year results, and certain historical trend analyses in the materials are presented under Japanese GAAP (J-GAAP). On an IFRS basis, revenue decreased 7.9% year on year to ¥339.5 billion, operating profit fell 29.2% to ¥29.7 billion and profit attributable to owners of parent declined 37.2% to ¥15.3 billion, as the special demand from the new banknote issuance in Japan ended and domestic revenue and profit fell back, in line with expectations. The overseas market achieved record-high revenue for the seventh consecutive year. For FY2026 the company forecasts revenue of ¥360.0 billion (+6.0%), operating profit of ¥32.0 billion (+7.6%) and profit of ¥20.0 billion (+30.0%). The FY2025 total return ratio was 126% (136% as of the completion of the share buyback on May 13, 2026), the annual dividend was ¥112 per share, and the FY2026 annual dividend is planned at ¥154 under a revised DOE target of 4.0% or more.
Consolidated Results (Full-Year Actual, FY2025 / IFRS)
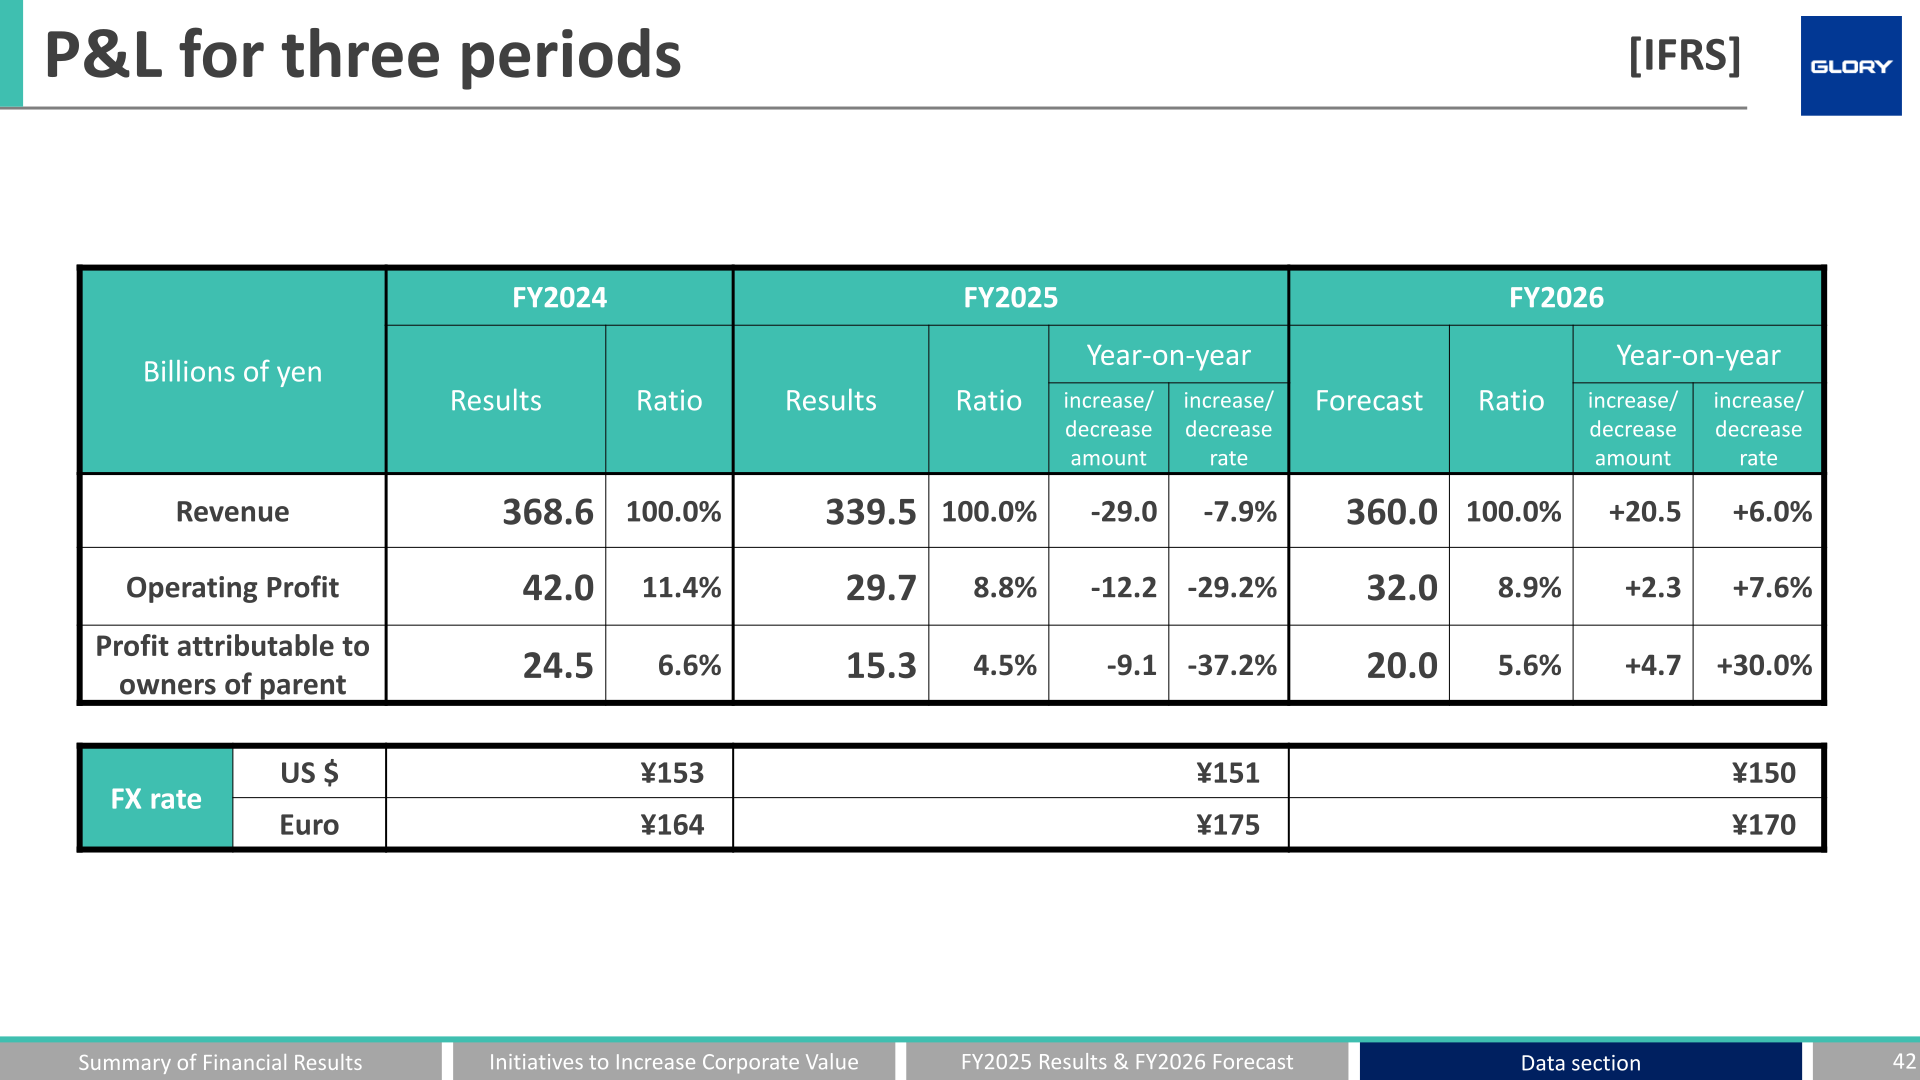
Revenue was ¥339.5 billion, down ¥29.0 billion (-7.9%) from ¥368.6 billion in FY2024. Operating profit was ¥29.7 billion, down ¥12.2 billion (-29.2%), with the operating margin falling from 11.4% to 8.8%. Profit attributable to owners of parent was ¥15.3 billion, down ¥9.1 billion (-37.2%). The average FX rates were ¥151 to the US dollar (¥153 in FY2024) and ¥175 to the euro (¥164). According to the operating profit bridge, the decrease in revenue reduced operating profit by ¥13.0 billion, mainly because domestic market sales fell with the termination of demand for hardware replacements and system modifications associated with the new banknote issuance; a lower cost of goods ratio (maintenance costs improved in the U.S.) added ¥2.5 billion, higher SG&A expenses at overseas subsidiaries subtracted ¥2.5 billion, and increased other income added ¥0.7 billion. The materials attribute the FY2025 decline in operating profit to the decline in domestic sales, while the overseas market saw growth and both overseas revenue and operating profit reached record highs.
| Item (Billions of yen, IFRS) | FY2024 Results | FY2025 Results | YoY Change | YoY % |
|---|---|---|---|---|
| Revenue | 368.6 | 339.5 | -29.0 | -7.9% |
| Operating Profit | 42.0 | 29.7 | -12.2 | -29.2% |
| Operating Margin | 11.4% | 8.8% | – | – |
| Profit attributable to owners of parent | 24.5 | 15.3 | -9.1 | -37.2% |
| FX rate: US$ | ¥153 | ¥151 | – | – |
| FX rate: Euro | ¥164 | ¥175 | – | – |
For reference, the materials also show approximate J-GAAP figures for FY2025: net sales of ¥338.9 billion (-8.1%), operating income before goodwill amortization of ¥32.2 billion (-26.6%), operating income of ¥23.4 billion (-36.3%) and profit of ¥9.4 billion (-45.2%). The company notes that the impact of the transition from J-GAAP to IFRS on revenue is immaterial; the difference in FY2025 operating profit (J-GAAP operating income of approx. ¥23.5 billion versus IFRS operating profit of ¥29.7 billion) is attributed mainly to goodwill amortization (approx. +¥8.7 billion), retirement benefit provision expense (approx. -¥3.0 billion) and others (approx. +¥0.5 billion). On a J-GAAP basis, recurring revenue accounted for 43% of revenue in FY2025 (40% in FY2024), and the new business domain accounted for 15% of revenue (¥50.7 billion) versus 14% (¥51.4 billion) in FY2024.
Segment Results
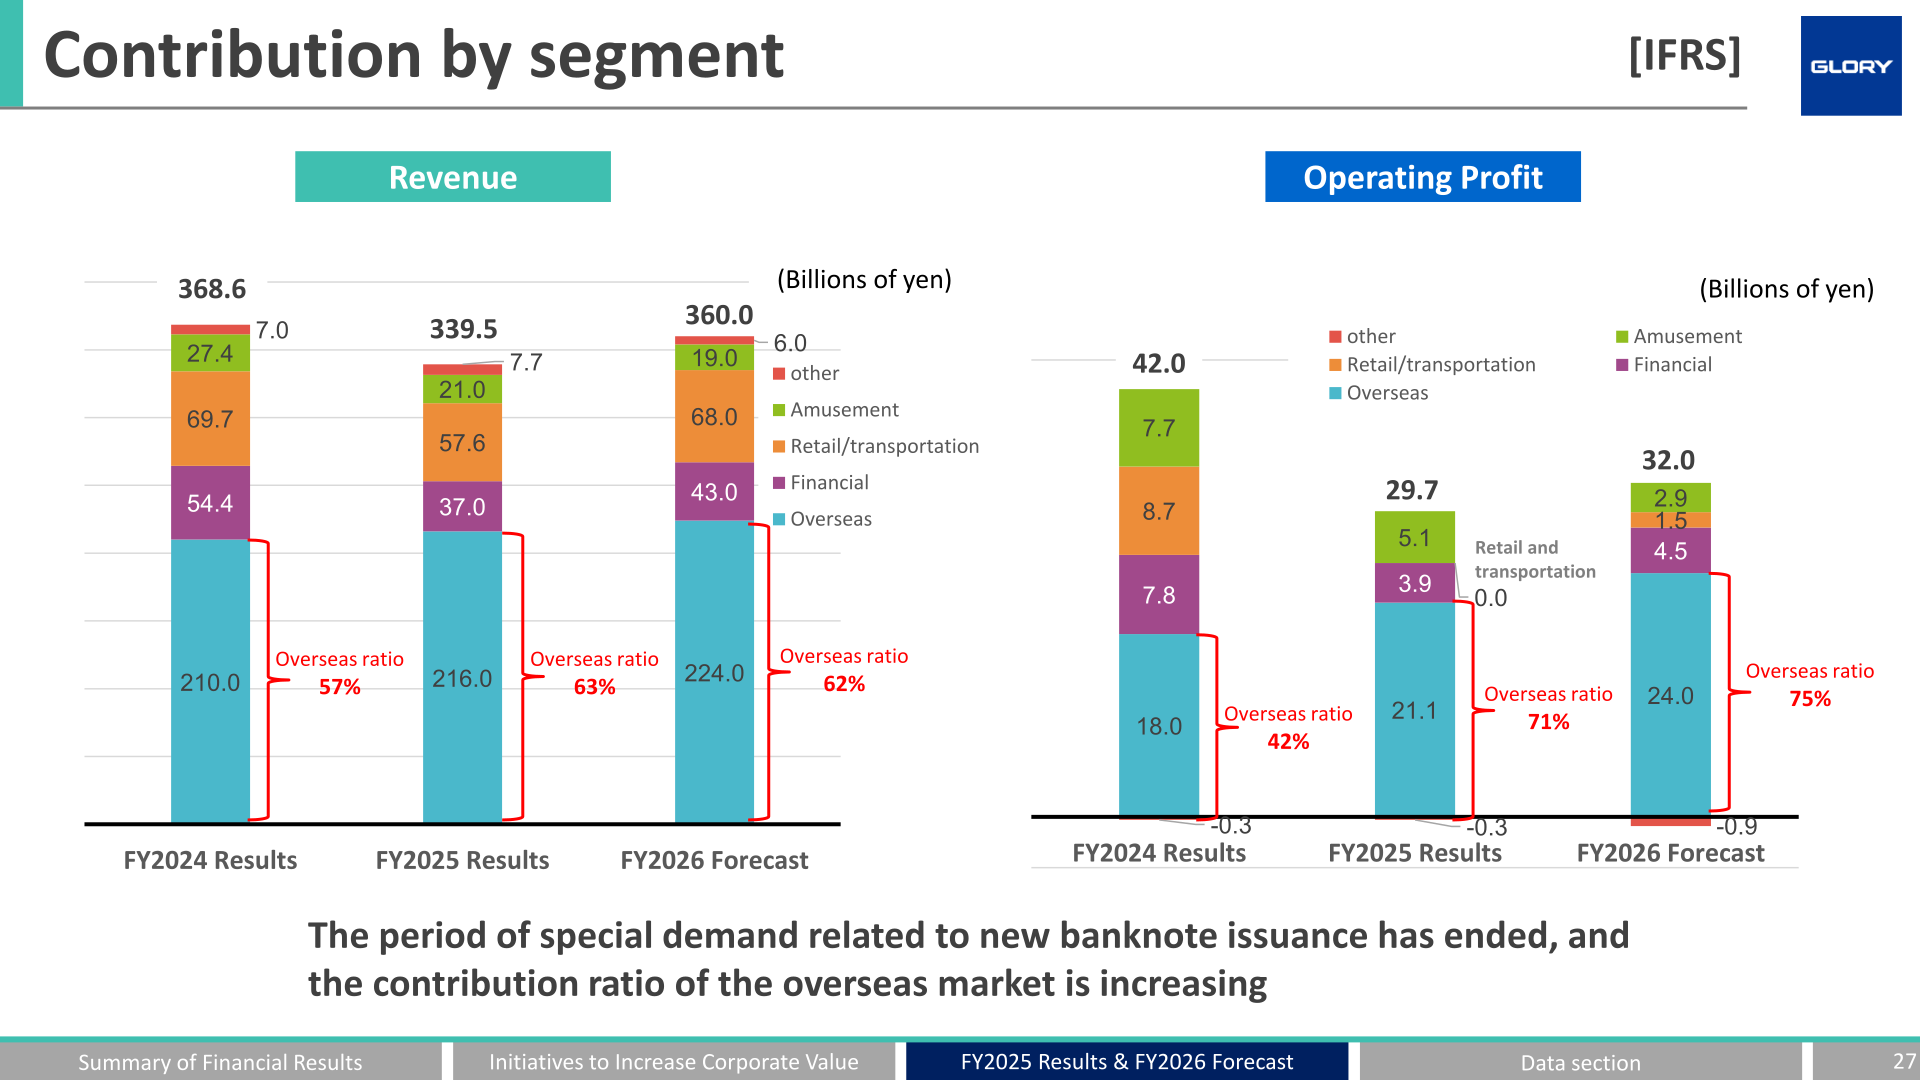
Overseas Market: revenue increased ¥6.0 billion (+2.9%) to ¥216.0 billion and operating profit increased ¥3.1 billion (+17.2%) to ¥21.1 billion (operating margin 9.8%, up from 8.6%). Driven by demand for self-service, sales of products and services were steady in Europe and the Americas; although some markets and customers delayed investment decisions due to geopolitical uncertainty, demand for cash handling machines remained firm and both revenue and operating profit reached record highs. By region, the Americas fell 1.9% to ¥98.9 billion (a slight decrease due to lower maintenance revenue), EMEA rose 11.1% to a record ¥100.0 billion (driven by updates of coin and banknote recyclers for retailers in Germany and robust sales for financial institutions in Italy), and Asia fell 11.0% to ¥17.0 billion as sales of Acrelec fell short of expectations. By company, Glory Global Solutions (GGS) posted ¥152.6 billion (+3.0%), Sitrade ¥20.0 billion (+20.5%), Acrelec ¥32.7 billion (-1.5%) and Flooid ¥10.7 billion (-11.6%). The overseas market accounted for 71% of consolidated operating profit in FY2025.
Financial Market: revenue decreased ¥17.4 billion (-32.0%) to ¥37.0 billion and operating profit decreased ¥3.9 billion (-50.0%) to ¥3.9 billion. Compared with FY2024, which had large orders, sales of the key products (open teller systems and coin and banknote recyclers for tellers) declined; cost reductions secured an operating margin of 10.5%. Retail and Transportation Market: revenue decreased ¥12.1 billion (-17.4%) to ¥57.6 billion and operating profit fell ¥8.7 billion to ¥0.0 billion, due to the reactionary decline in new-banknote demand, upfront investment in the new business domain, and impairment losses at group companies that were made subsidiaries. Amusement Market: revenue decreased ¥6.7 billion (-24.2%) to ¥21.0 billion and operating profit decreased ¥2.6 billion (-33.8%) to ¥5.1 billion (operating margin 24.3%), as sales of card systems and peripheral devices and maintenance revenue decreased from the high demand level of FY2024 and the introduction of smart amusement machines slowed. Others: revenue of ¥7.7 billion (+10.0%) and an operating loss of ¥0.3 billion.
| Segment (Billions of yen, IFRS) | Metric | FY2024 Results | FY2025 Results | YoY Change | YoY % |
|---|---|---|---|---|---|
| Overseas Market | Revenue | 210.0 | 216.0 | +6.0 | +2.9% |
| Overseas Market | Operating profit | 18.0 | 21.1 | +3.1 | +17.2% |
| Financial Market | Revenue | 54.4 | 37.0 | -17.4 | -32.0% |
| Financial Market | Operating profit | 7.8 | 3.9 | -3.9 | -50.0% |
| Retail & Transportation Market | Revenue | 69.7 | 57.6 | -12.1 | -17.4% |
| Retail & Transportation Market | Operating profit | 8.7 | 0.0 | -8.7 | – |
| Amusement Market | Revenue | 27.7 | 21.0 | -6.7 | -24.2% |
| Amusement Market | Operating profit | 7.7 | 5.1 | -2.6 | -33.8% |
| Others | Revenue | 7.0 | 7.7 | +0.7 | +10.0% |
| Others | Operating profit | -0.3 | -0.3 | 0.0 | – |
Within the new business domain, Acrelec posted revenue of ¥32.7 billion (Americas ¥5.1 billion, Europe ¥25.6 billion, Asia ¥1.9 billion) with an operating margin of 1.5% (4.5% in FY2024), as revenue fell short of the initial forecast due to some customers delaying investment decisions; the company made Acrelec a 100% subsidiary and replaced top management to strengthen governance. Flooid posted revenue of ¥10.7 billion (Americas ¥4.9 billion, Europe ¥5.7 billion) with an operating margin of 6.5% (22.3% in FY2024), as the acquisition of new customers lagged and revenue in the Americas decreased due to the rebound from the previous term’s lump-sum software sales.
FY2026 Forecast
For FY2026 (the fiscal year ending March 2027), the company forecasts revenue of ¥360.0 billion (+¥20.5 billion, +6.0%), operating profit of ¥32.0 billion (+¥2.3 billion, +7.6%; operating margin 8.9%) and profit attributable to owners of parent of ¥20.0 billion (+¥4.7 billion, +30.0%), assuming ¥150 to the US dollar and ¥170 to the euro. The company expects revenue to increase by capturing new and replacement demand in the domestic and overseas markets (+¥9.3 billion effect on operating profit), while SG&A expenses are expected to increase due to soaring labor costs and sales expenses (-¥7.2 billion), with other income adding ¥0.2 billion. In the domestic market, a sales recovery is expected in the financial and retail/transportation markets due to the rebound of special demand; in the overseas market, further growth is expected through expanded sales of products and services, with profit margins to be improved by optimizing operating costs. By segment, the overseas market is forecast at revenue of ¥224.0 billion (+3.7%) and operating profit of ¥24.0 billion (+13.7%), the financial market at ¥43.0 billion (+16.2%) and ¥4.5 billion (+15.4%), the retail & transportation market at ¥68.0 billion (+18.1%) and ¥1.5 billion, the amusement market at ¥19.0 billion (-9.5%) and ¥2.9 billion (-43.1%), and others at ¥6.0 billion (-22.1%) and an operating loss of ¥0.9 billion. The company states that the forecasts DO NOT reflect the impact of uncertainties such as developments in U.S. trade policy and rising geopolitical risks in the Middle East, as the amount of impact is currently difficult to reasonably estimate.
| Item (Billions of yen, IFRS) | FY2026 Forecast | FY2025 Results | YoY Change | YoY % |
|---|---|---|---|---|
| Revenue | 360.0 | 339.5 | +20.5 | +6.0% |
| Operating Profit | 32.0 | 29.7 | +2.3 | +7.6% |
| Operating Margin | 8.9% | 8.8% | – | – |
| Profit attributable to owners of parent | 20.0 | 15.3 | +4.7 | +30.0% |
| Overseas Market: Revenue / Operating profit | 224.0 / 24.0 | 216.0 / 21.1 | +8.0 / +2.9 | +3.7% / +13.7% |
| Financial Market: Revenue / Operating profit | 43.0 / 4.5 | 37.0 / 3.9 | +6.0 / +0.6 | +16.2% / +15.4% |
| Retail & Transportation Market: Revenue / Operating profit | 68.0 / 1.5 | 57.6 / 0.0 | +10.4 / +1.5 | +18.1% / – |
| Amusement Market: Revenue / Operating profit | 19.0 / 2.9 | 21.0 / 5.1 | -2.0 / -2.2 | -9.5% / -43.1% |
| Others: Revenue / Operating profit | 6.0 / -0.9 | 7.7 / -0.3 | -1.7 / -0.6 | -22.1% / – |
| FX rate: US$ / Euro | ¥150 / ¥170 | ¥151 / ¥175 | – | – |
Shareholder Returns
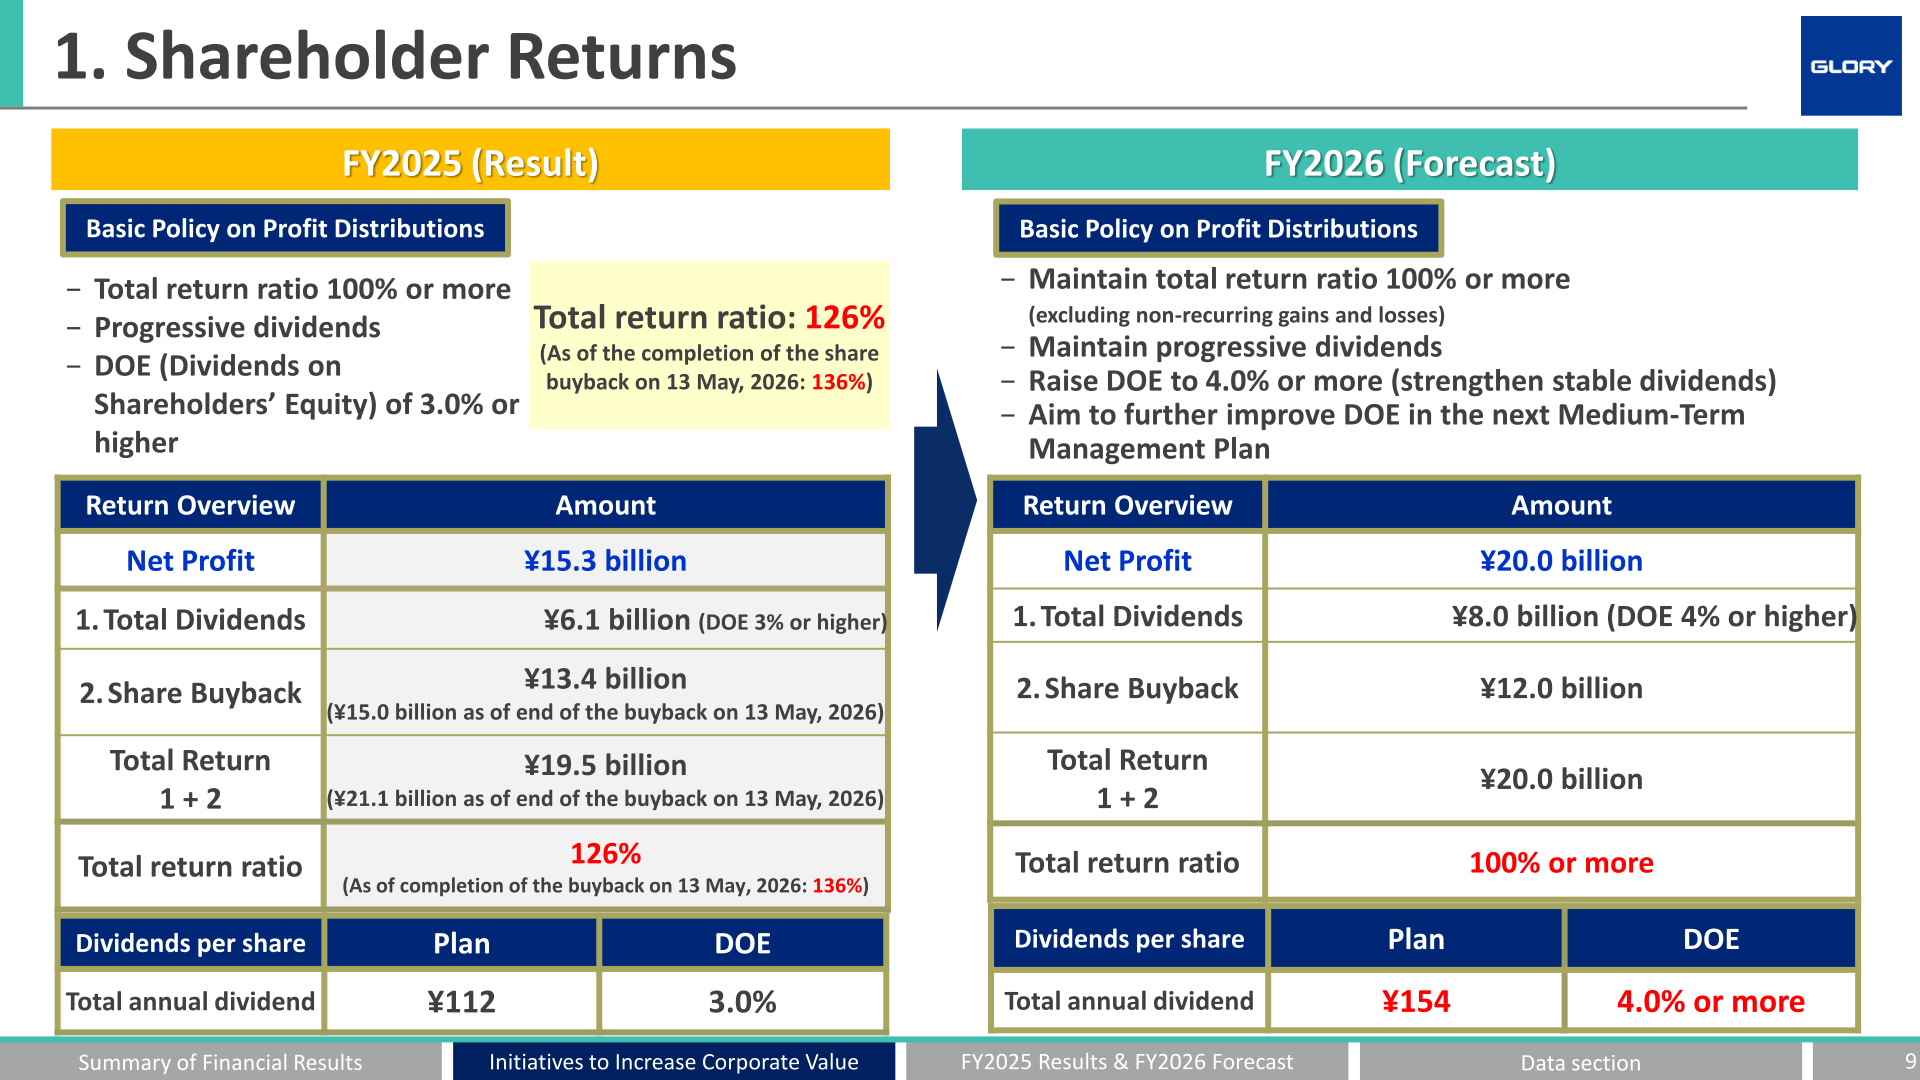
Under the FY2025 basic policy (total return ratio of 100% or more, progressive dividends, and DOE of 3.0% or higher), total dividends were ¥6.1 billion (DOE 3% or higher; total annual dividend of ¥112 per share, DOE 3.0%) and the share buyback was ¥13.4 billion (¥15.0 billion as of the end of the buyback on May 13, 2026), for a total return of ¥19.5 billion (¥21.1 billion) against net profit of ¥15.3 billion; the total return ratio was 126% (136% as of the completion of the buyback). For FY2026, the company will maintain a total return ratio of 100% or more (excluding non-recurring gains and losses), maintain progressive dividends, and raise DOE to 4.0% or more to strengthen stable dividends, aiming to further improve DOE in the next Medium-Term Management Plan. The FY2026 plan is a total annual dividend of ¥154 per share (DOE 4.0% or more), total dividends of ¥8.0 billion, a share buyback of ¥12.0 billion (maximum) and a total return of ¥20.0 billion against forecast net profit of ¥20.0 billion. Total return ratios over the past years were 35.4% (FY2021), 16.0% (FY2023), 37.6% (FY2024) and 126.4% (FY2025). As of the end of March 2026, the equity ratio was 48.1% and the D/E ratio was 0.41x, against 2026 MTP target levels of around 50% and 0.6 or less, respectively.
| Item | FY2025 (Result) | FY2026 (Forecast) |
|---|---|---|
| Net Profit | ¥15.3 billion | ¥20.0 billion |
| Total Dividends | ¥6.1 billion (DOE 3% or higher) | ¥8.0 billion (DOE 4% or higher) |
| Share Buyback | ¥13.4 billion (¥15.0 billion as of end of the buyback on 13 May, 2026) | ¥12.0 billion |
| Total Return | ¥19.5 billion (¥21.1 billion as of end of the buyback on 13 May, 2026) | ¥20.0 billion |
| Total return ratio | 126% (136% as of completion of the buyback) | 100% or more |
| Total annual dividend per share | ¥112 (DOE 3.0%) | ¥154 (DOE 4.0% or more) |
Medium-Term Plan / Topics
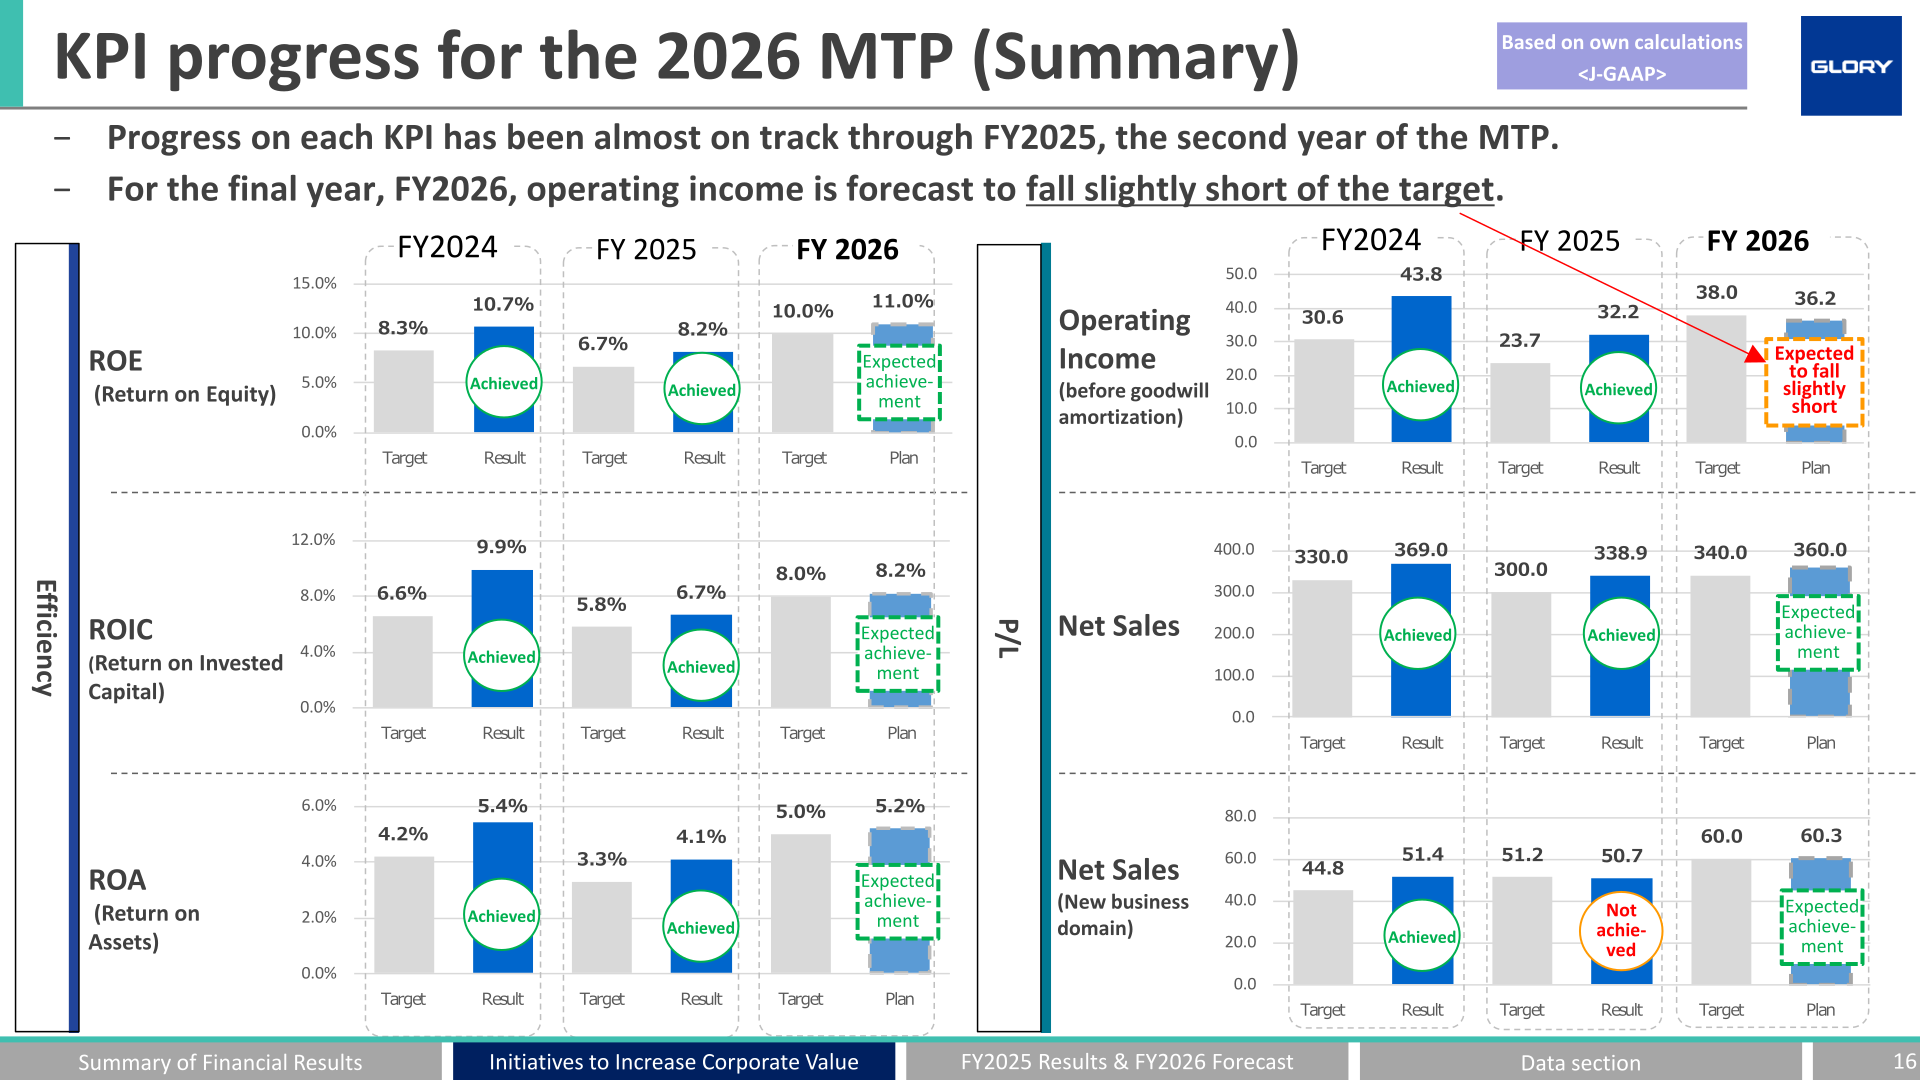
The company states that progress on each KPI of the 2026 Medium-Term Management Plan has been almost on track through FY2025, the second year of the plan, while for the final year, FY2026, operating income is forecast to fall slightly short of the target. On a J-GAAP basis, FY2025 results versus targets were: net sales ¥338.9 billion (target ¥300.0 billion), operating income before goodwill amortization ¥32.2 billion (target ¥23.7 billion), new business domain net sales ¥50.7 billion (target ¥51.2 billion, not achieved), ROE 8.2% (target 6.7%), ROIC 6.7% (target 5.8%) and ROA 4.1% (target 3.3%). For FY2026, the plan is net sales of ¥360.0 billion (target ¥340.0 billion), operating income before goodwill amortization of ¥36.2 billion (target ¥38.0 billion, expected to fall slightly short), new business domain net sales of ¥60.3 billion (target ¥60.0 billion), ROE 11.0% (target 10.0%), ROIC 8.2% (target 8.0%) and ROA 5.2% (target 5.0%); these efficiency KPIs are calculated before goodwill amortization. The MTP cash allocation (FY2024 to FY2026, approx. ¥140.0 billion in total) is described as broadly in line with plan. In business portfolio optimization, the company decided to withdraw from the Robot SI business and the China business (liquidation of the local sales subsidiary completed in August 2025), formulated an improvement scheme for the payment business, and is expanding the biometric image recognition business and pivoting the domestic DX business. Among the key points, business size exceeded ¥350.0 billion in net sales even without the special demand from new banknote issuance, overseas sales reached ¥215.2 billion (J-GAAP) in FY2025, and the company aims to expand income levels from an average of ¥20.0 billion to over ¥35.0 billion with overseas income exceeding 70% of consolidated operating income in FY2026.
This article is an analysis based on publicly available information and is not a recommendation to buy or sell any specific securities. Investment decisions are your own responsibility.
![[Obayashi] Investors’ Guide 2026 — The Complete 24-Article Breakdown](https://japan-equity.com/wp-content/uploads/2026/07/hub_cover-1024x1024.png)
![[Obayashi] IR & SR Policy — Feeding Dialogue Back into Management](https://japan-equity.com/wp-content/uploads/2026/07/p32_sq-1024x1024.jpg)
![[Obayashi] Domestic Civil Engineering — Resilience Spending Supports 9.6% Margin](https://japan-equity.com/wp-content/uploads/2026/07/p11_sq-1024x1024.jpg)
![[Obayashi] Overseas Construction — Orders Reach ¥1.2tn](https://japan-equity.com/wp-content/uploads/2026/07/p15_sq-1024x1024.jpg)
![[Obayashi] Share Price & External Ratings — vs TOPIX, ESG Index Inclusion](https://japan-equity.com/wp-content/uploads/2026/07/p40_sq-1024x1024.jpg)
![[Construction] ¥75.5tn Investment, Shrinking Workforce — Big-5 Market Share](https://japan-equity.com/wp-content/uploads/2026/07/p12_sq-1024x1024.jpg)



![[Obayashi] Capital Policy & Shareholder Returns — ROE 10%+, DOE ~5%, ¥100bn Buyback](https://japan-equity.com/wp-content/uploads/2026/07/p27_sq-1024x1024.jpg)
![[Obayashi] Reducing Cross-Shareholdings — ¥285.2bn Sold in Five Years](https://japan-equity.com/wp-content/uploads/2026/07/p29_sq-1024x1024.jpg)
![[Obayashi] ¥750bn Investment Plan — ¥300bn to Development, ¥190bn to Tech/DX](https://japan-equity.com/wp-content/uploads/2026/07/p30_sq-1024x1024.jpg)
![[Obayashi] MTP2022 KPIs — Operating Profit ~2x Target, ROE 14.4%](https://japan-equity.com/wp-content/uploads/2026/07/p25_sq-1024x1024.jpg)
![[Obayashi] Cash Allocation — ¥420bn Investment CF Over Five Years](https://japan-equity.com/wp-content/uploads/2026/07/p26_sq-1024x1024.jpg)
![[Obayashi] Green Energy — 44 Plants, 344MW, and the Green Hydrogen Challenge](https://japan-equity.com/wp-content/uploads/2026/07/p21_sq-1024x1024.jpg)
![[Obayashi] Tackling the Labor Shortage — Robotics Construction®](https://japan-equity.com/wp-content/uploads/2026/07/p14_sq-1024x1024.jpg)
