
This article is based on publicly available IR materials and is not a recommendation to buy or sell any specific securities.
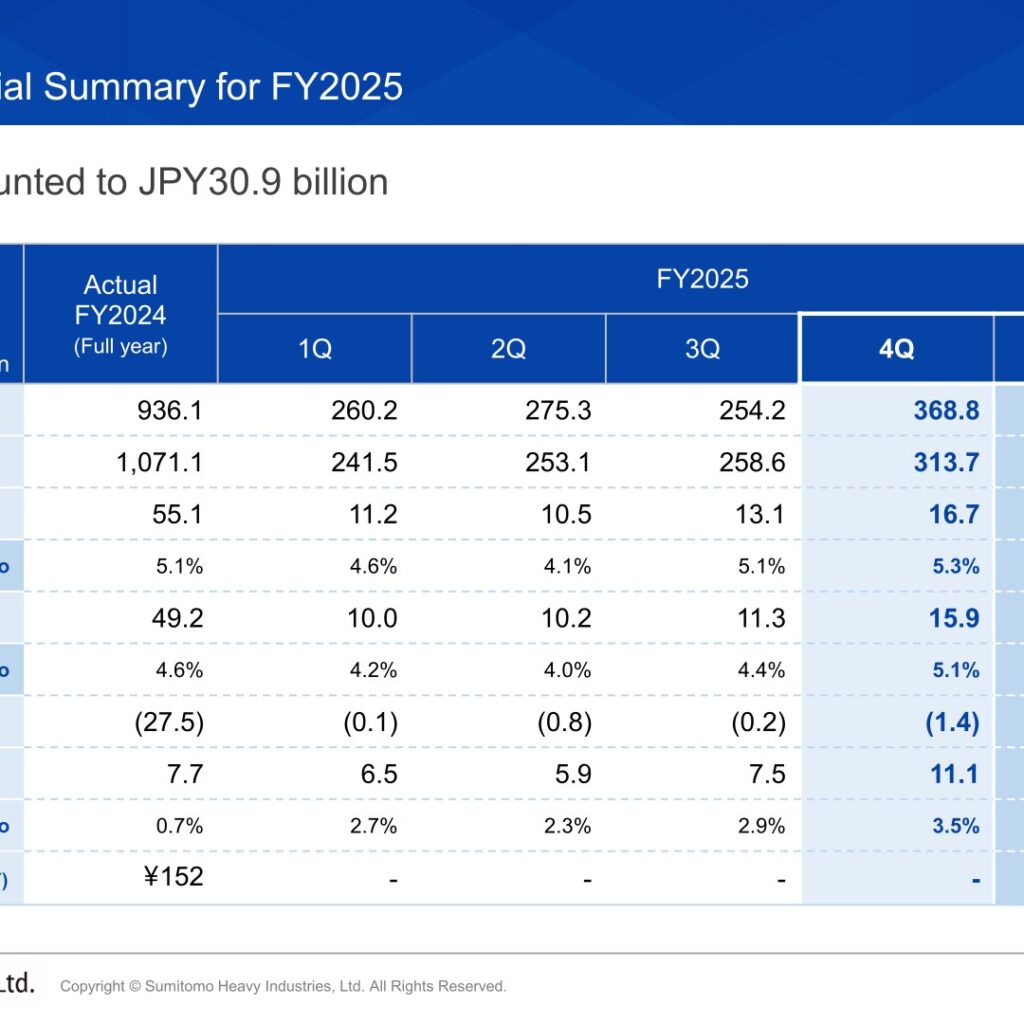
Sumitomo Heavy Industries, Ltd. (6302) released its “Financial Summary for FY2025, Performance Forecast for FY2026 and Progress of ‘Medium-Term Management Plan 2026′” dated February 10, 2026. The company’s fiscal year ends in December, so FY2025 is the year ended December 2025. For FY2025, orders rose to JPY1,158.4 billion from JPY936.1 billion (a change of 222.3 billion) as a general recovery in demand lifted orders across all segments, while net sales slipped to JPY1,066.9 billion from JPY1,071.1 billion ((4.2) billion) and operating profit declined to JPY51.5 billion from JPY55.1 billion ((3.6) billion), partly reflecting lower sales in the Industrial Machinery and Logistics & Construction segments. Current profit amounted to JPY30.9 billion, up 23.2 billion from JPY7.7 billion, as the extraordinary loss narrowed to (2.5) billion from (27.5) billion. For FY2026 the company forecasts orders of JPY1,120.0 billion, net sales of JPY1,090.0 billion, operating profit of JPY60.0 billion and a dividend of JPY145 per share, and it announced structural reorganization of its core businesses, including personnel measures.
Consolidated Results (FY2025 Actual)
The operating profit ratio was 4.8% versus 5.1% in FY2024 ((0.3pt)). Ordinary profit was JPY47.3 billion against JPY49.2 billion ((1.9) billion), for an ordinary profit ratio of 4.4% (FY2024: 4.6%). The current profit ratio improved to 2.9% from 0.7% (2.2pt). ROIC was 4.2% versus 4.8% ((0.6) pt). The average USD/JPY exchange rate was ¥150, compared with ¥152 in FY2024. By quarter, orders were 260.2, 275.3, 254.2 and 368.8 billion yen in 1Q through 4Q, and operating profit was 11.2, 10.5, 13.1 and 16.7 billion yen. The analysis of changes in operating profit from FY2024 to FY2025 shows the effect of sales increases/decreases at (4.2) billion yen (Mechatronics 4.2, Industrial Machinery (8.2), Logistics & Construction (0.7), Energy & Lifeline 0.5), the effect of exchange rates at (0.4), selling & administrative expenses at (6.9) and others at 7.9, taking operating profit from 55.1 to 51.5 billion yen. The company describes the market environment as a gradual recovery in Japan, a robust US economy, and signs of recovery beginning to appear in China and Europe, where economic stagnation had been persistent.
| Item (JPY billion) | FY2024 Actual | FY2025 Actual | Change |
|---|---|---|---|
| Orders | 936.1 | 1,158.4 | 222.3 |
| Net sales | 1,071.1 | 1,066.9 | (4.2) |
| Operating profit | 55.1 | 51.5 | (3.6) |
| Operating profit ratio | 5.1% | 4.8% | (0.3pt) |
| Ordinary profit | 49.2 | 47.3 | (1.9) |
| Ordinary profit ratio | 4.6% | 4.4% | (0.2pt) |
| Extraordinary loss | (27.5) | (2.5) | 25.0 |
| Current profit | 7.7 | 30.9 | 23.2 |
| Current profit ratio | 0.7% | 2.9% | 2.2pt |
| Currency exchange rate (USD/JPY) | ¥152 | ¥150 | – |
On the balance sheet, total assets stood at JPY1,320.5 billion at December 2025, up 60.3 billion from JPY1,260.2 billion at December 2024, with non-current assets rising 58.0 billion to 533.7 billion (property, plant and equipment 373.2 billion, up 25.2 billion; investments and other assets 127.4 billion, up 27.9 billion). Interest-bearing debts rose 14.1 billion to 252.7 billion. Net assets were 686.2 billion (up 39.8 billion), shareholders’ equity was 488.4 billion (up 14.7 billion), the net interest-bearing debts ratio was 10.7% (up 0.6pt) and the shareholders’ equity ratio was 51.6% (up 0.8pt). Cash flows from operating activities were 63.7 billion yen (FY2024: 12.8 billion), with the working capital burden easing to (6.0) billion from (53.7) billion; investing activities were (59.4) billion, giving free cash flows of 4.3 billion versus (36.7) billion in FY2024. Financing activities were (7.1) billion, and cash and cash equivalents at the end of the period were 107.6 billion. The debt repayment term was 4.0 years (FY2024: 18.7 years) and the interest coverage ratio was 16.8 times (FY2024: 3.4 times).
Segment Results
Orders increased in all four segments. Mechatronics posted orders of JPY275.3 billion (+33.2 billion), net sales of JPY271.2 billion (+14.8 billion) and operating profit of JPY19.0 billion (+7.3 billion), with a 7.0% operating profit ratio; demand for gear reducers recovered in Japan and overseas, customers in Europe completed inventory adjustments for motors & inverters, and cryocoolers saw increased demand for semiconductor-related products. Industrial Machinery orders rose to JPY225.1 billion (+19.1 billion), partly due to a last-minute surge in plastics machinery orders ahead of a price revision and higher advanced medical device orders, but net sales fell to JPY222.6 billion (-11.4 billion) on a smaller backlog of orders for semiconductor manufacturing equipment, and operating profit dropped to JPY4.2 billion (-8.1 billion), a 1.9% ratio. Logistics & Construction orders grew to JPY399.1 billion (+59.3 billion) on a last-minute surge in hydraulic excavator orders ahead of a price revision in Japan and on industrial crane demand from shipbuilding and steel product applications; net sales were JPY388.9 billion (-3.6 billion) and operating profit declined to JPY14.0 billion (-11.3 billion), a 3.6% ratio, due to a drop in hydraulic excavator sales, a decline in highly profitable industrial crane projects, and an increase in the allowance for doubtful accounts. Energy & Lifeline orders jumped to JPY252.7 billion (+110.9 billion), driven by biomass power generation facility orders in Japan and Europe and orders for water treatment equipment and marine structures; net sales were JPY177.6 billion (-4.3 billion) on a smaller backlog for biomass power generation plants, while operating profit rose to JPY12.1 billion (+8.3 billion), a 6.8% ratio, partly due to improved project profitability and lower development expenses for the Liquid Air Energy Storage (LAES).
| Segment (JPY billion) | Orders FY2024 | Orders FY2025 | Net sales FY2024 | Net sales FY2025 | Operating profit FY2024 (ratio) | Operating profit FY2025 (ratio) |
|---|---|---|---|---|---|---|
| Mechatronics | 242.0 | 275.3 | 256.4 | 271.2 | 11.7 (4.6%) | 19.0 (7.0%) |
| Industrial Machinery | 206.0 | 225.1 | 234.0 | 222.6 | 12.3 (5.2%) | 4.2 (1.9%) |
| Logistics & Construction | 339.7 | 399.1 | 392.5 | 388.9 | 25.3 (6.4%) | 14.0 (3.6%) |
| Energy & Lifeline | 141.8 | 252.7 | 182.0 | 177.6 | 3.8 (2.1%) | 12.1 (6.8%) |
| Others | 6.5 | 6.3 | 6.2 | 6.5 | 2.0 | 2.1 |
| Total | 936.1 | 1,158.4 | 1,071.1 | 1,066.9 | 55.1 (5.1%) | 51.5 (4.8%) |
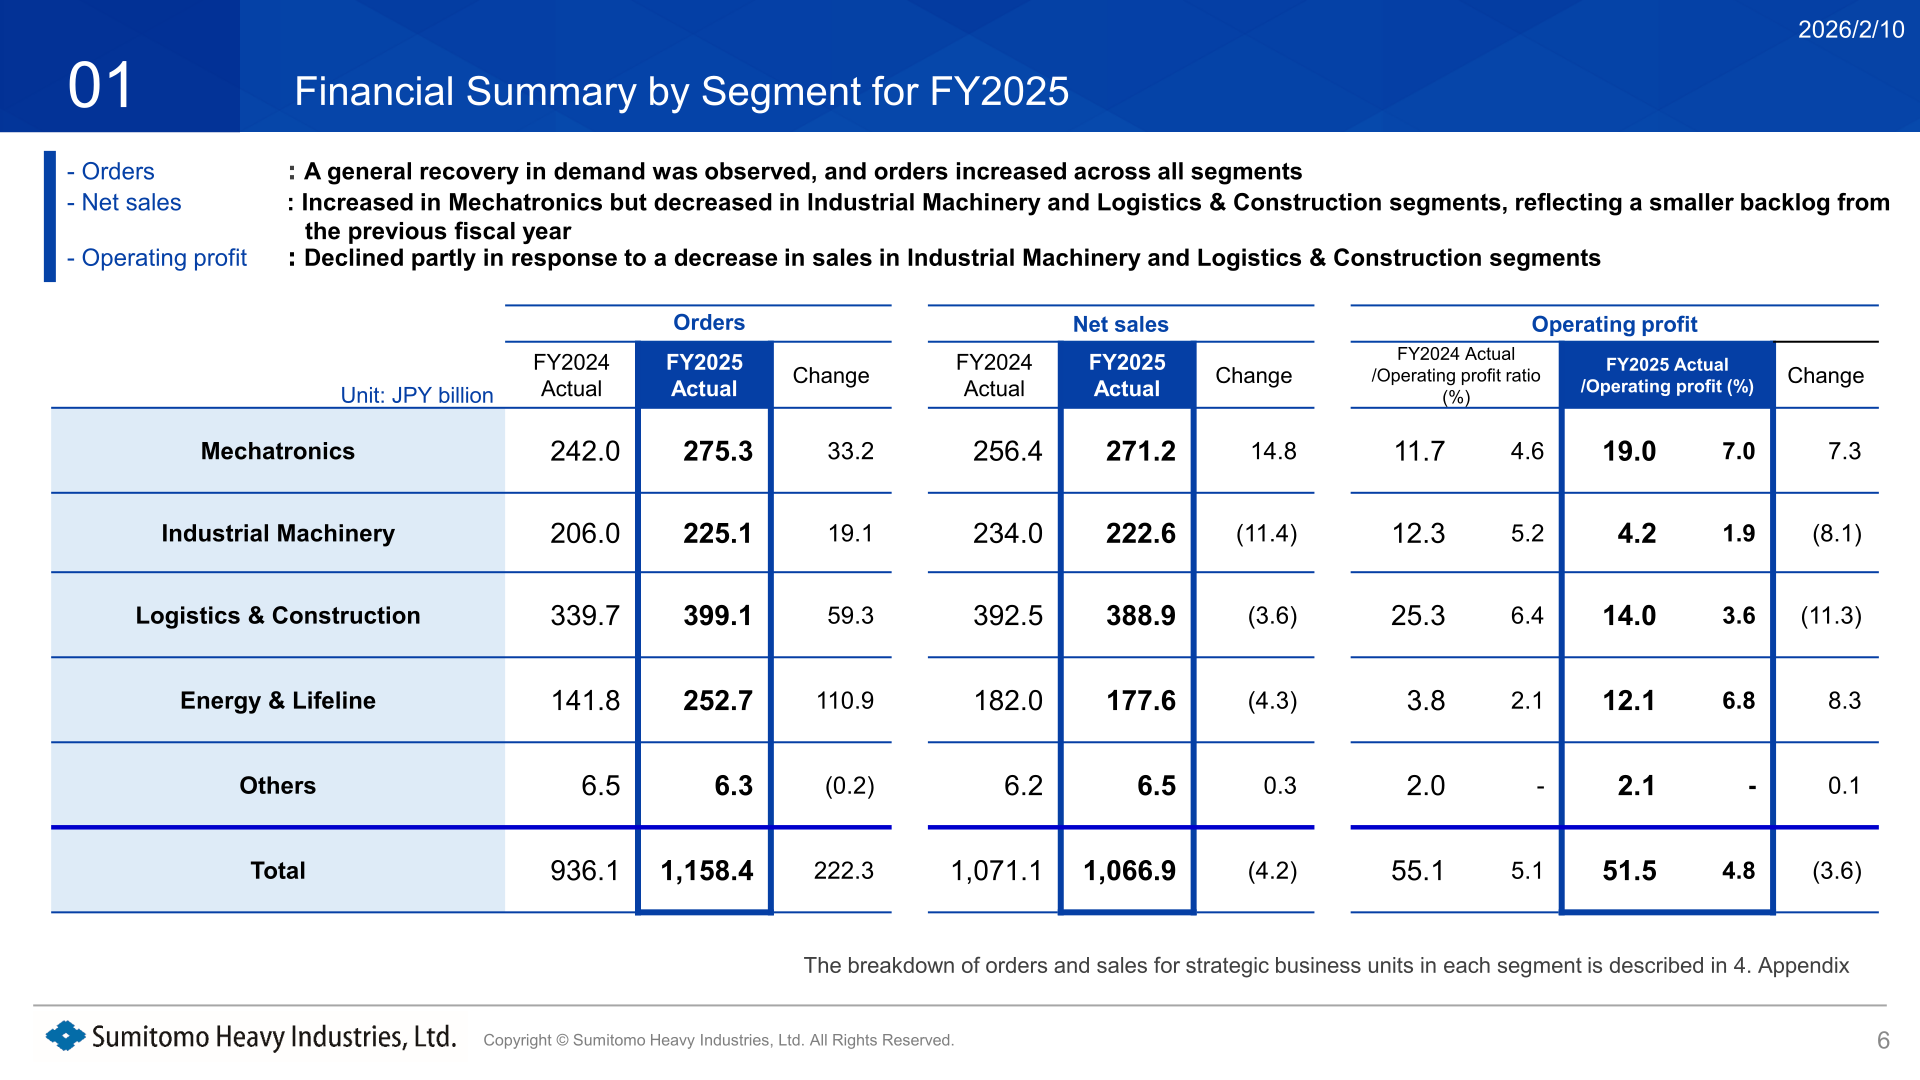
By strategic business unit (SBU), FY2025 orders and net sales were: Drive Technologies 208.4 / 206.8 billion yen, Advanced Technologies 67.9 / 68.3, Material Solutions 35.2 / 38.8, Medical & Quantum Solutions 25.3 / 24.2, Metal Processing Solutions 34.5 / 26.4, Plastics Solutions 101.3 / 102.4, Material Handling Systems 86.9 / 63.6, HSC Cranes 39.1 / 41.1, Link-Belt Cranes 87.7 / 87.9, Construction Equipment 199.1 / 212.4, Energy & Environment 127.6 / 71.1, Process Plant 63.7 / 53.6, and Marine & Steel Structures 45.0 / 37.6. By segment, ROIC for FY2025 was 6.0% in Mechatronics (FY2024: 4.5%), 2.7% in Industrial Machinery (5.2%), 4.7% in Logistics & Construction (7.6%) and 6.4% in Energy & Lifeline (2.6%), with a consolidated ROIC of 4.2% (4.8%). Overseas sales accounted for 60% of FY2025 net sales (JPY637.4 billion), with North America at JPY233.3 billion (22%), Europe 133.6 billion (13%), Asia excluding China 141.1 billion (13%), China 82.3 billion (8%) and others 47.3 billion (4%); Japan was JPY429.4 billion (40%). Consolidated personnel totaled 25,123 at the end of FY2025.
FY2026 Forecast
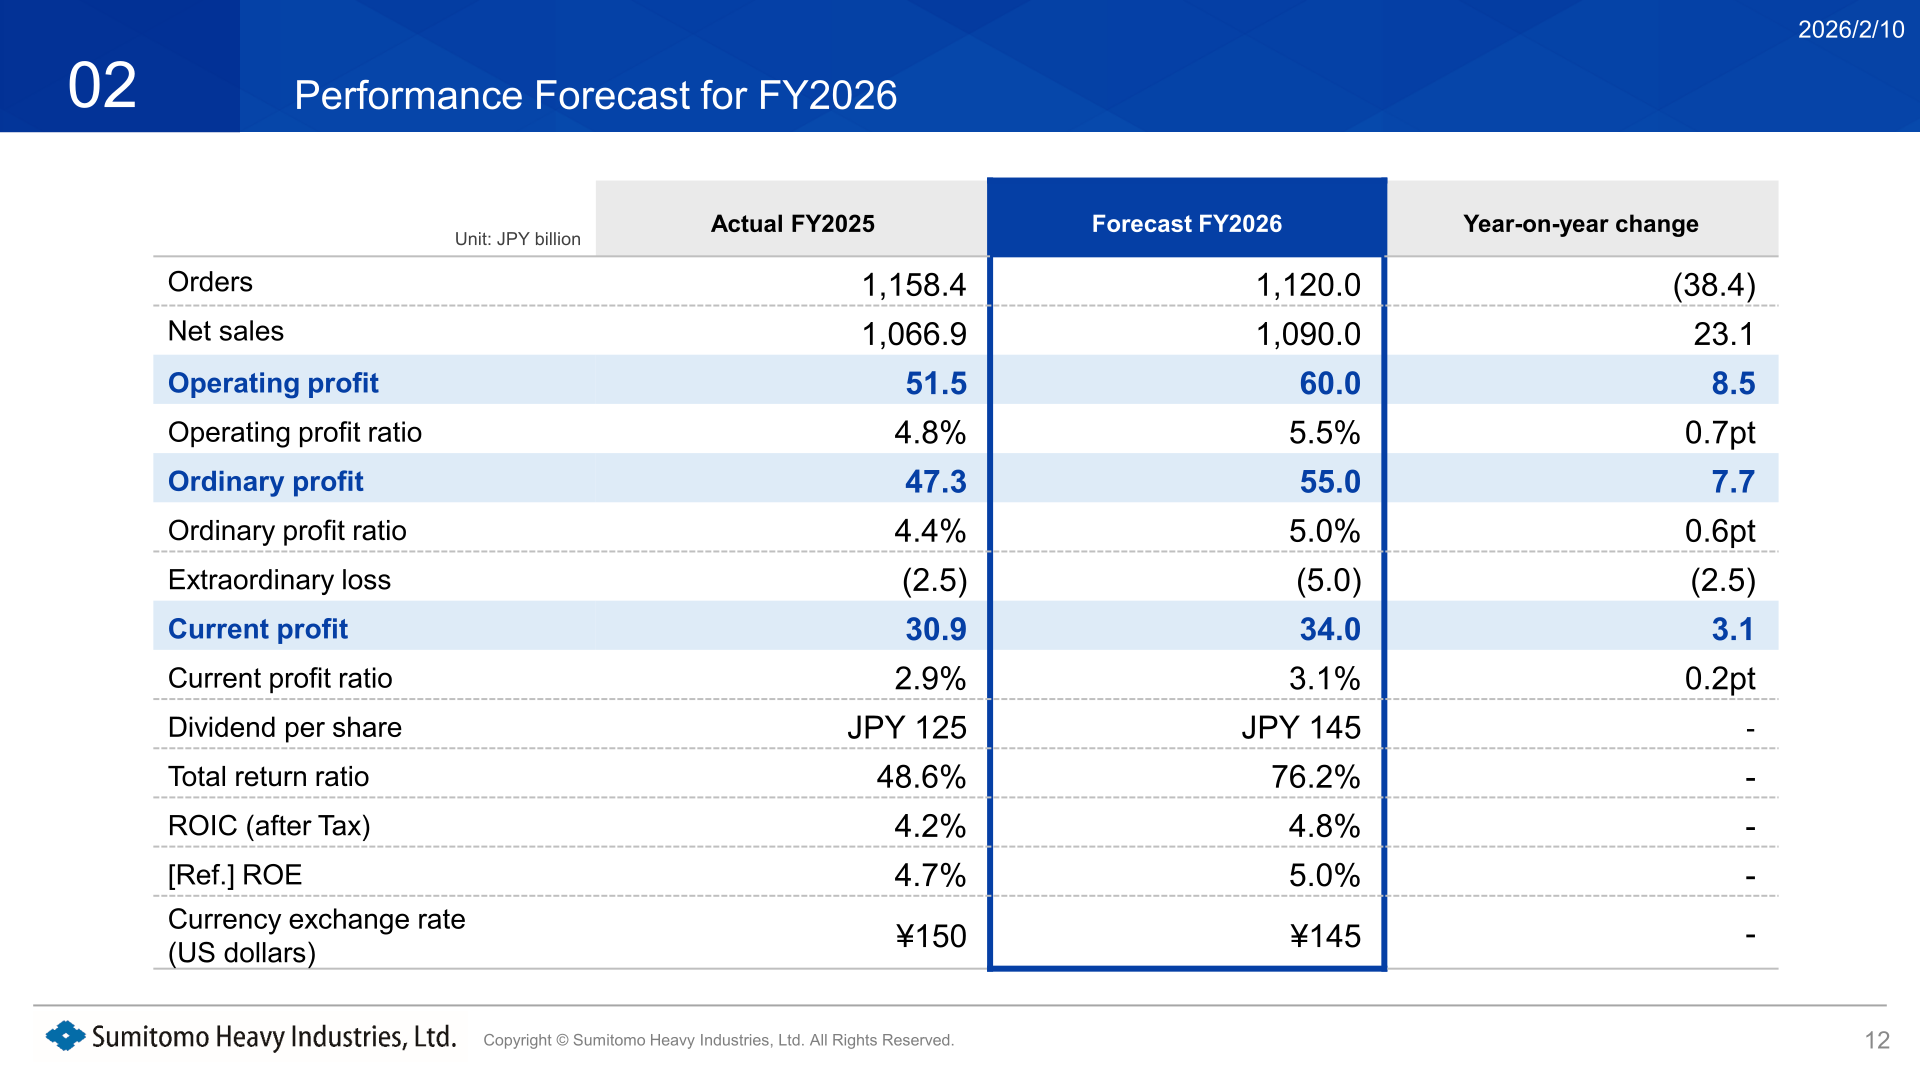
For FY2026, the company forecasts orders of JPY1,120.0 billion ((38.4) billion year on year), as the prior year included large orders in Energy & Lifeline, although Mechatronics is expected to see an increase mainly in North America and Europe. Net sales are forecast at JPY1,090.0 billion (+23.1 billion) on higher orders in Mechatronics, and operating profit at JPY60.0 billion (+8.5 billion), for an operating profit ratio of 5.5% (+0.7pt). Ordinary profit is forecast at JPY55.0 billion (+7.7 billion), extraordinary loss at (5.0) billion, and current profit at JPY34.0 billion (+3.1 billion). ROIC (after tax) is forecast at 4.8% and ROE at 5.0%. The assumed exchange rates are ¥145 per US dollar and ¥170 per euro; the effect of a 1-yen change on operating profit is 0.44 billion yen for the dollar and 0.12 billion yen for the euro (0.56 billion in total). The company expects market conditions in Japan to be strong, the North American market to be strong despite some uncertainty, Europe to continue a gradual recovery, and China to generally continue to face weak demand. The operating profit bridge from FY2025 to FY2026 comprises +9.0 billion yen from the effect of sales increases/decreases (Mechatronics 5.0, Industrial Machinery 3.0, Logistics & Construction 3.0, Energy & Lifeline (2.0)), (3.0) from exchange rates, (4.0) from selling & administrative expenses and +6.5 from others.
| Item (JPY billion) | FY2025 Actual | FY2026 Forecast | Change |
|---|---|---|---|
| Orders | 1,158.4 | 1,120.0 | (38.4) |
| Net sales | 1,066.9 | 1,090.0 | 23.1 |
| Operating profit | 51.5 | 60.0 | 8.5 |
| Operating profit ratio | 4.8% | 5.5% | 0.7pt |
| Ordinary profit | 47.3 | 55.0 | 7.7 |
| Extraordinary loss | (2.5) | (5.0) | (2.5) |
| Current profit | 30.9 | 34.0 | 3.1 |
| Current profit ratio | 2.9% | 3.1% | 0.2pt |
| Dividend per share | JPY 125 | JPY 145 | – |
| Total return ratio | 48.6% | 76.2% | – |
| ROIC (after Tax) | 4.2% | 4.8% | – |
| [Ref.] ROE | 4.7% | 5.0% | – |
| Currency exchange rate (US dollars) | ¥150 | ¥145 | – |
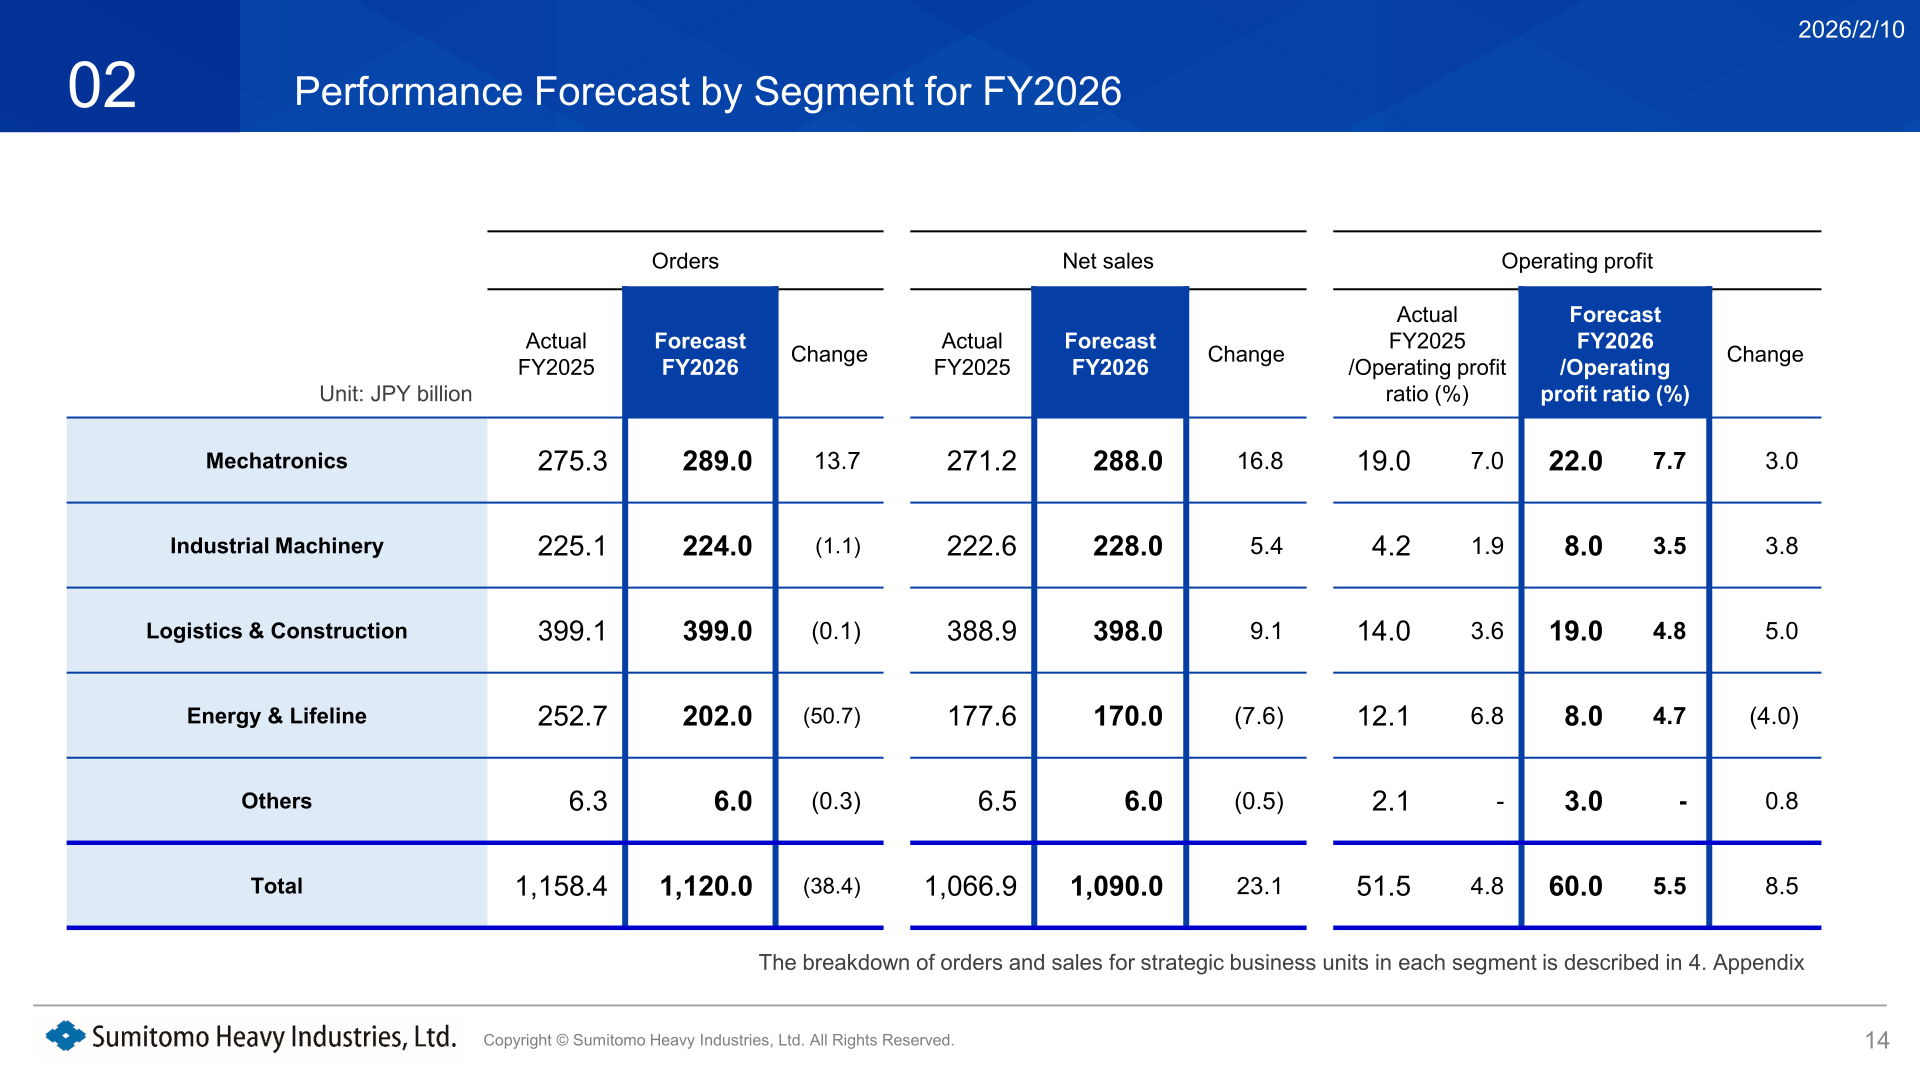
By segment, Mechatronics is forecast to post orders of JPY289.0 billion (+13.7 billion), net sales of JPY288.0 billion (+16.8 billion) and operating profit of JPY22.0 billion (+3.0 billion), with both gear reducers and motors & inverters expected to increase on strong demand from the US and Europe. Industrial Machinery is forecast at orders of JPY224.0 billion (-1.1 billion), net sales of JPY228.0 billion (+5.4 billion) and operating profit of JPY8.0 billion (+3.8 billion), as semiconductor manufacturing equipment increases with customers partially resuming investment activity while plastics machinery sees a pullback following last year’s increase; the profit forecast factors in the effects of structural reorganization for plastics machinery in Europe. Logistics & Construction is forecast at orders of JPY399.0 billion (-0.1 billion), net sales of JPY398.0 billion (+9.1 billion) and operating profit of JPY19.0 billion (+5.0 billion), helped by higher sales and the elimination of the impact of allowances for doubtful accounts. Energy & Lifeline is forecast at orders of JPY202.0 billion (-50.7 billion), net sales of JPY170.0 billion (-7.6 billion), reflecting the transfer of the steam turbine and process pump businesses, and operating profit of JPY8.0 billion (-4.0 billion).
| Segment (JPY billion) | Orders FY2026 Forecast | Net sales FY2026 Forecast | Operating profit FY2026 Forecast (ratio) |
|---|---|---|---|
| Mechatronics | 289.0 | 288.0 | 22.0 (7.7%) |
| Industrial Machinery | 224.0 | 228.0 | 8.0 (3.5%) |
| Logistics & Construction | 399.0 | 398.0 | 19.0 (4.8%) |
| Energy & Lifeline | 202.0 | 170.0 | 8.0 (4.7%) |
| Others | 6.0 | 6.0 | 3.0 |
| Total | 1,120.0 | 1,090.0 | 60.0 (5.5%) |
Shareholder Returns
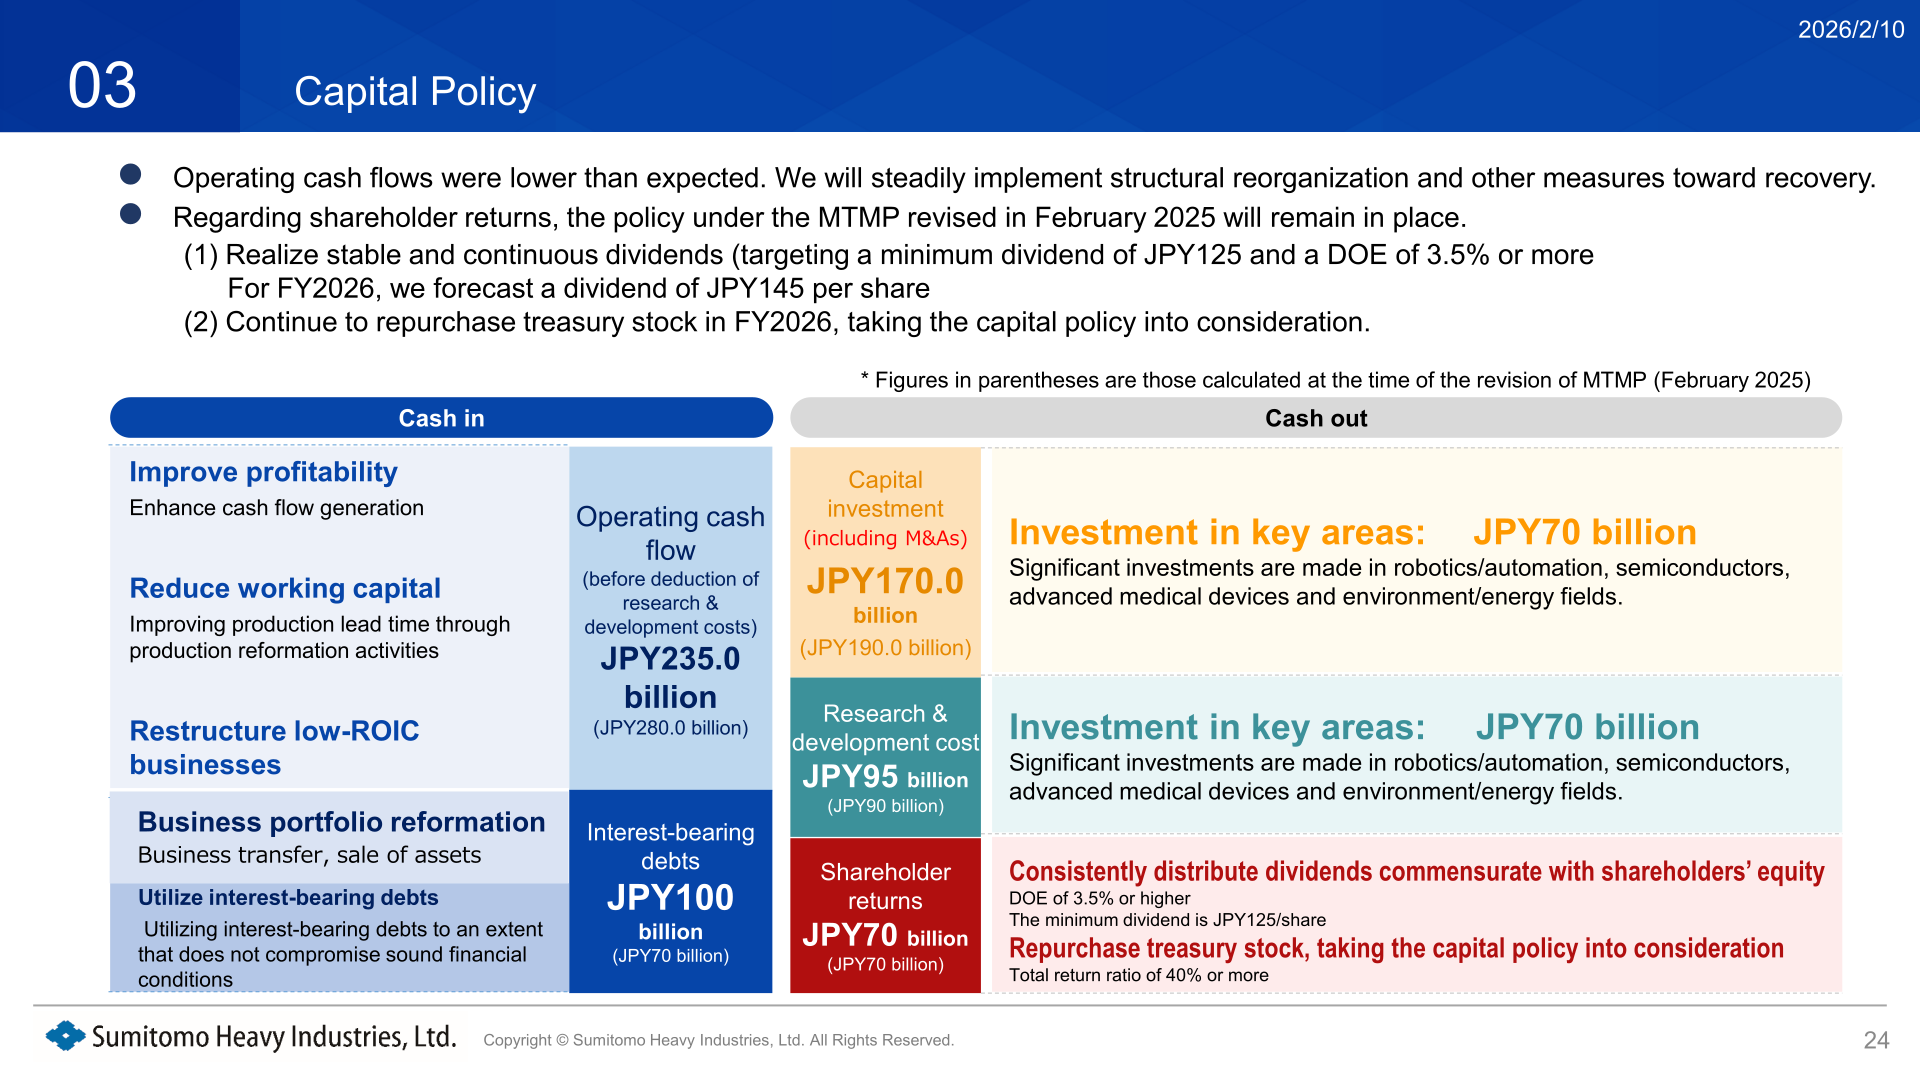
The shareholder return policy under the Medium-Term Management Plan revised in February 2025 will remain in place: (1) realize stable and continuous dividends, targeting a minimum dividend of JPY125 and a DOE of 3.5% or more, and (2) continue to repurchase treasury stock in FY2026, taking the capital policy into consideration, with a total return ratio of 40% or more. The dividend per share was JPY 125 for FY2025 (total return ratio 48.6%), and the company forecasts a dividend of JPY145 per share for FY2026 (total return ratio 76.2%). Under the capital policy for MTMP26, shareholder returns are planned at JPY70 billion (unchanged from the JPY70 billion at the February 2025 revision), while operating cash flow before deduction of research & development costs is now JPY235.0 billion (versus JPY280.0 billion), capital investment including M&As JPY170.0 billion (versus JPY190.0 billion), research & development cost JPY95 billion (versus JPY90 billion), and interest-bearing debts JPY100 billion (versus JPY70 billion); the company notes that operating cash flows were lower than expected and that it will steadily implement structural reorganization and other measures toward recovery.
Medium-Term Management Plan 2026: Progress and Structural Reorganization
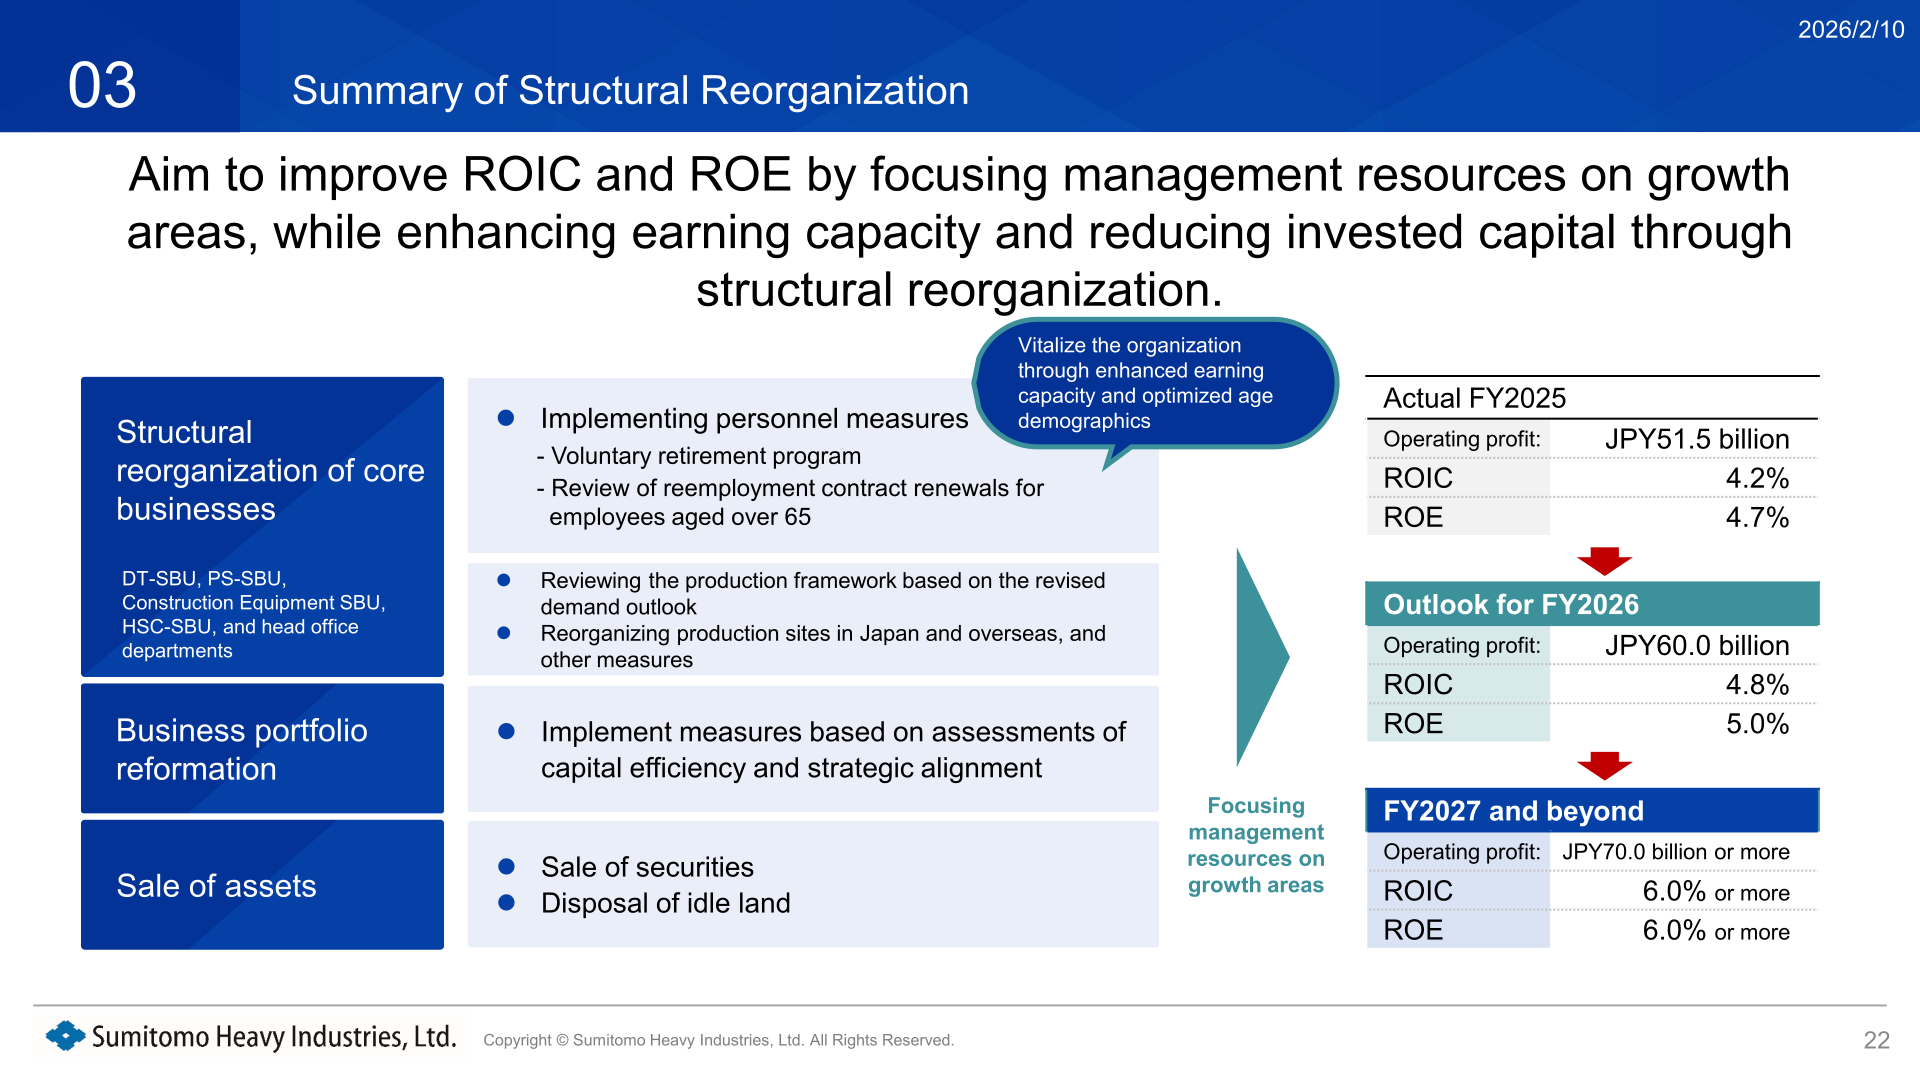
The company states that in FY2025 the semiconductor equipment business and the hydraulic excavator business experienced a significant decline, with a further decrease of JPY8.5 billion in operating profit from the revised plan, and that achieving the operating profit target of JPY80.0 billion in FY2026 will be challenging. It will therefore implement structural reorganization (including personnel measures) for its core businesses — a voluntary retirement program, a review of reemployment contract renewals for employees aged over 65, a review of the production framework based on the revised demand outlook, and reorganization of production sites in Japan and overseas — covering DT-SBU, PS-SBU, Construction Equipment SBU, HSC-SBU and head office departments, together with business portfolio reformation and sale of assets (securities and idle land). The outlook is operating profit of JPY60.0 billion, ROIC 4.8% and ROE 5.0% for FY2026, and operating profit of JPY70.0 billion or more, ROIC 6.0% or more and ROE 6.0% or more for FY2027 and beyond. On the KPI table, the 2026 estimate (February 2026) versus the 2026 target (as of February 2025) is: operating profit ratio 5.5% versus 6.8% and operating profit JPY 60.0 billion versus JPY 80.0 billion; ROIC 4.8% versus 7.0%; semiconductor business sales JPY86.3 billion versus JPY117.2 billion; gear business operating profit ratio 9.2% versus 9.7%; electric control orders JPY46.8 billion versus JPY45.6 billion; plastics machinery operating profit ratio 6.0% versus 6.3%; and hydraulic excavator orders JPY215.0 billion versus JPY260.0 billion.
As part of portfolio reformation, the company has determined to transfer the steam turbine, process pump and parking systems businesses. All issued shares of Shin Nippon Machinery Co., Ltd. (steam turbines and process pumps; JPY20.0 billion in net sales in FY2025; 530 employees to be transferred) will be transferred to Torishima Pump Mfg. Co., Ltd., with a scheduled transfer date of July 2026, and the parking systems business of Sumitomo Heavy Industries Material Handling Systems Co., Ltd. (JPY8.0 billion in net sales in FY2025; 90 employees) will be transferred to IHI Transport Machinery Co., Ltd., scheduled for November 2026. Other topics include the acquisition of LASSE (currently SMS-E) to strengthen the laser annealing equipment business, with a plan to establish production capacity in 2027 at 4x the 2025 level, the establishment of the Semiconductor Equipment Business Promotion Office in January 2026, and the start of demonstration operations of the LAES facilities in December 2025 (jointly with Hiroshima Gas Co., Ltd.). Segment FY2026 profit forecasts versus the plan as of February 2025 are JPY22.0 billion versus JPY24.0 billion for Mechatronics, JPY8.0 billion versus JPY22.0 billion for Industrial Machinery, JPY19.0 billion versus JPY27.0 billion for Logistics & Construction, and JPY8.0 billion versus JPY7.0 billion for Energy & Lifeline. Capital investment for MTMP26 (excluding M&A) is planned at approximately 90% of the initial plan, and research & development and M&A investment (a JPY15.0-20.0 billion investment plan over three years) are mostly in line with the initial plan.
This article is an analysis based on publicly available information and is not a recommendation to buy or sell any specific securities. Investment decisions are your own responsibility.
![[Obayashi] Investors’ Guide 2026 — The Complete 24-Article Breakdown](https://japan-equity.com/wp-content/uploads/2026/07/hub_cover-1024x1024.png)
![[Obayashi] IR & SR Policy — Feeding Dialogue Back into Management](https://japan-equity.com/wp-content/uploads/2026/07/p32_sq-1024x1024.jpg)
![[Obayashi] Domestic Civil Engineering — Resilience Spending Supports 9.6% Margin](https://japan-equity.com/wp-content/uploads/2026/07/p11_sq-1024x1024.jpg)
![[Obayashi] Overseas Construction — Orders Reach ¥1.2tn](https://japan-equity.com/wp-content/uploads/2026/07/p15_sq-1024x1024.jpg)
![[Obayashi] Share Price & External Ratings — vs TOPIX, ESG Index Inclusion](https://japan-equity.com/wp-content/uploads/2026/07/p40_sq-1024x1024.jpg)
![[Construction] ¥75.5tn Investment, Shrinking Workforce — Big-5 Market Share](https://japan-equity.com/wp-content/uploads/2026/07/p12_sq-1024x1024.jpg)



![[Obayashi] Capital Policy & Shareholder Returns — ROE 10%+, DOE ~5%, ¥100bn Buyback](https://japan-equity.com/wp-content/uploads/2026/07/p27_sq-1024x1024.jpg)
![[Obayashi] Reducing Cross-Shareholdings — ¥285.2bn Sold in Five Years](https://japan-equity.com/wp-content/uploads/2026/07/p29_sq-1024x1024.jpg)
![[Obayashi] ¥750bn Investment Plan — ¥300bn to Development, ¥190bn to Tech/DX](https://japan-equity.com/wp-content/uploads/2026/07/p30_sq-1024x1024.jpg)
![[Obayashi] MTP2022 KPIs — Operating Profit ~2x Target, ROE 14.4%](https://japan-equity.com/wp-content/uploads/2026/07/p25_sq-1024x1024.jpg)
![[Obayashi] Cash Allocation — ¥420bn Investment CF Over Five Years](https://japan-equity.com/wp-content/uploads/2026/07/p26_sq-1024x1024.jpg)
![[Obayashi] Green Energy — 44 Plants, 344MW, and the Green Hydrogen Challenge](https://japan-equity.com/wp-content/uploads/2026/07/p21_sq-1024x1024.jpg)
![[Obayashi] Tackling the Labor Shortage — Robotics Construction®](https://japan-equity.com/wp-content/uploads/2026/07/p14_sq-1024x1024.jpg)
