
This article is based on publicly available IR materials and is not a recommendation to buy or sell any specific securities.
Note: OSG Corporation’s fiscal year ends on November 30; “FY2025” in this article refers to the fiscal year ended November 30, 2025, and “FY2026” to the fiscal year ending November 30, 2026, as labeled in the company’s materials.
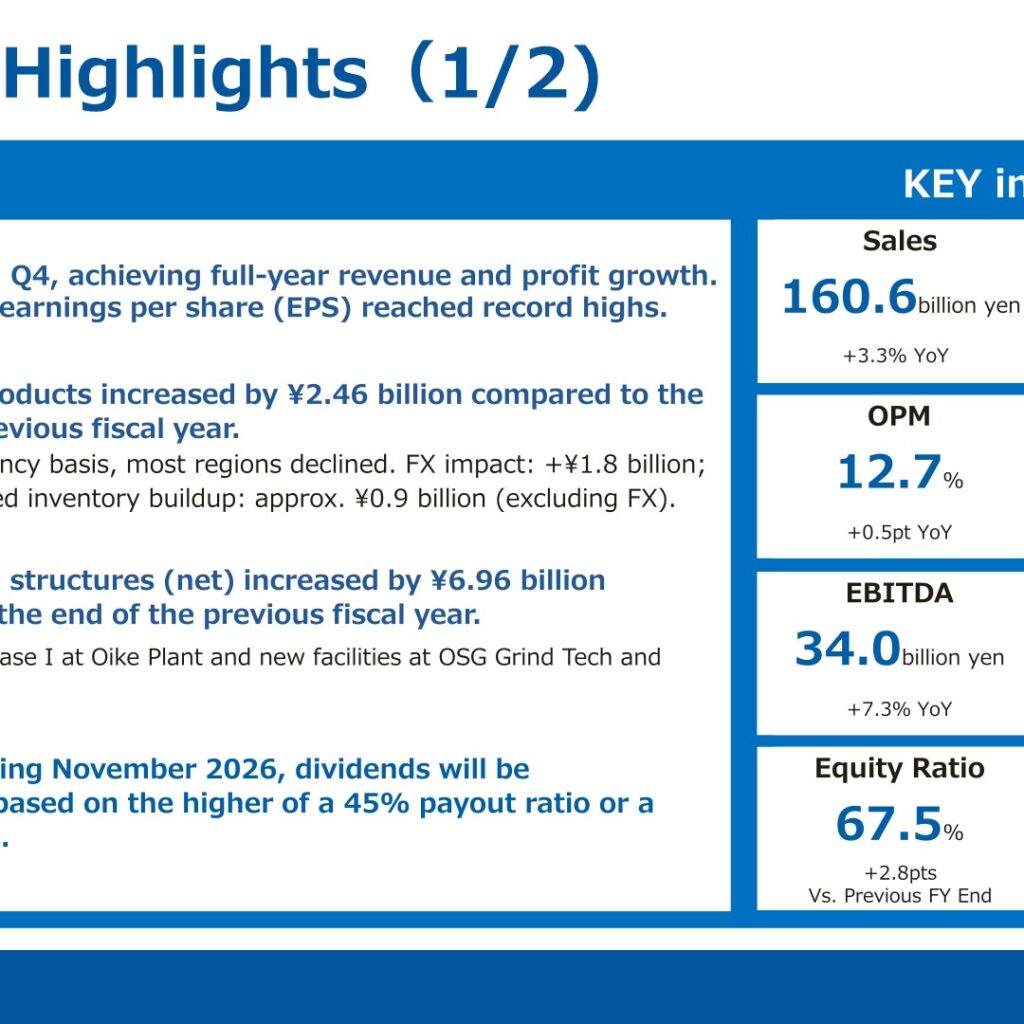
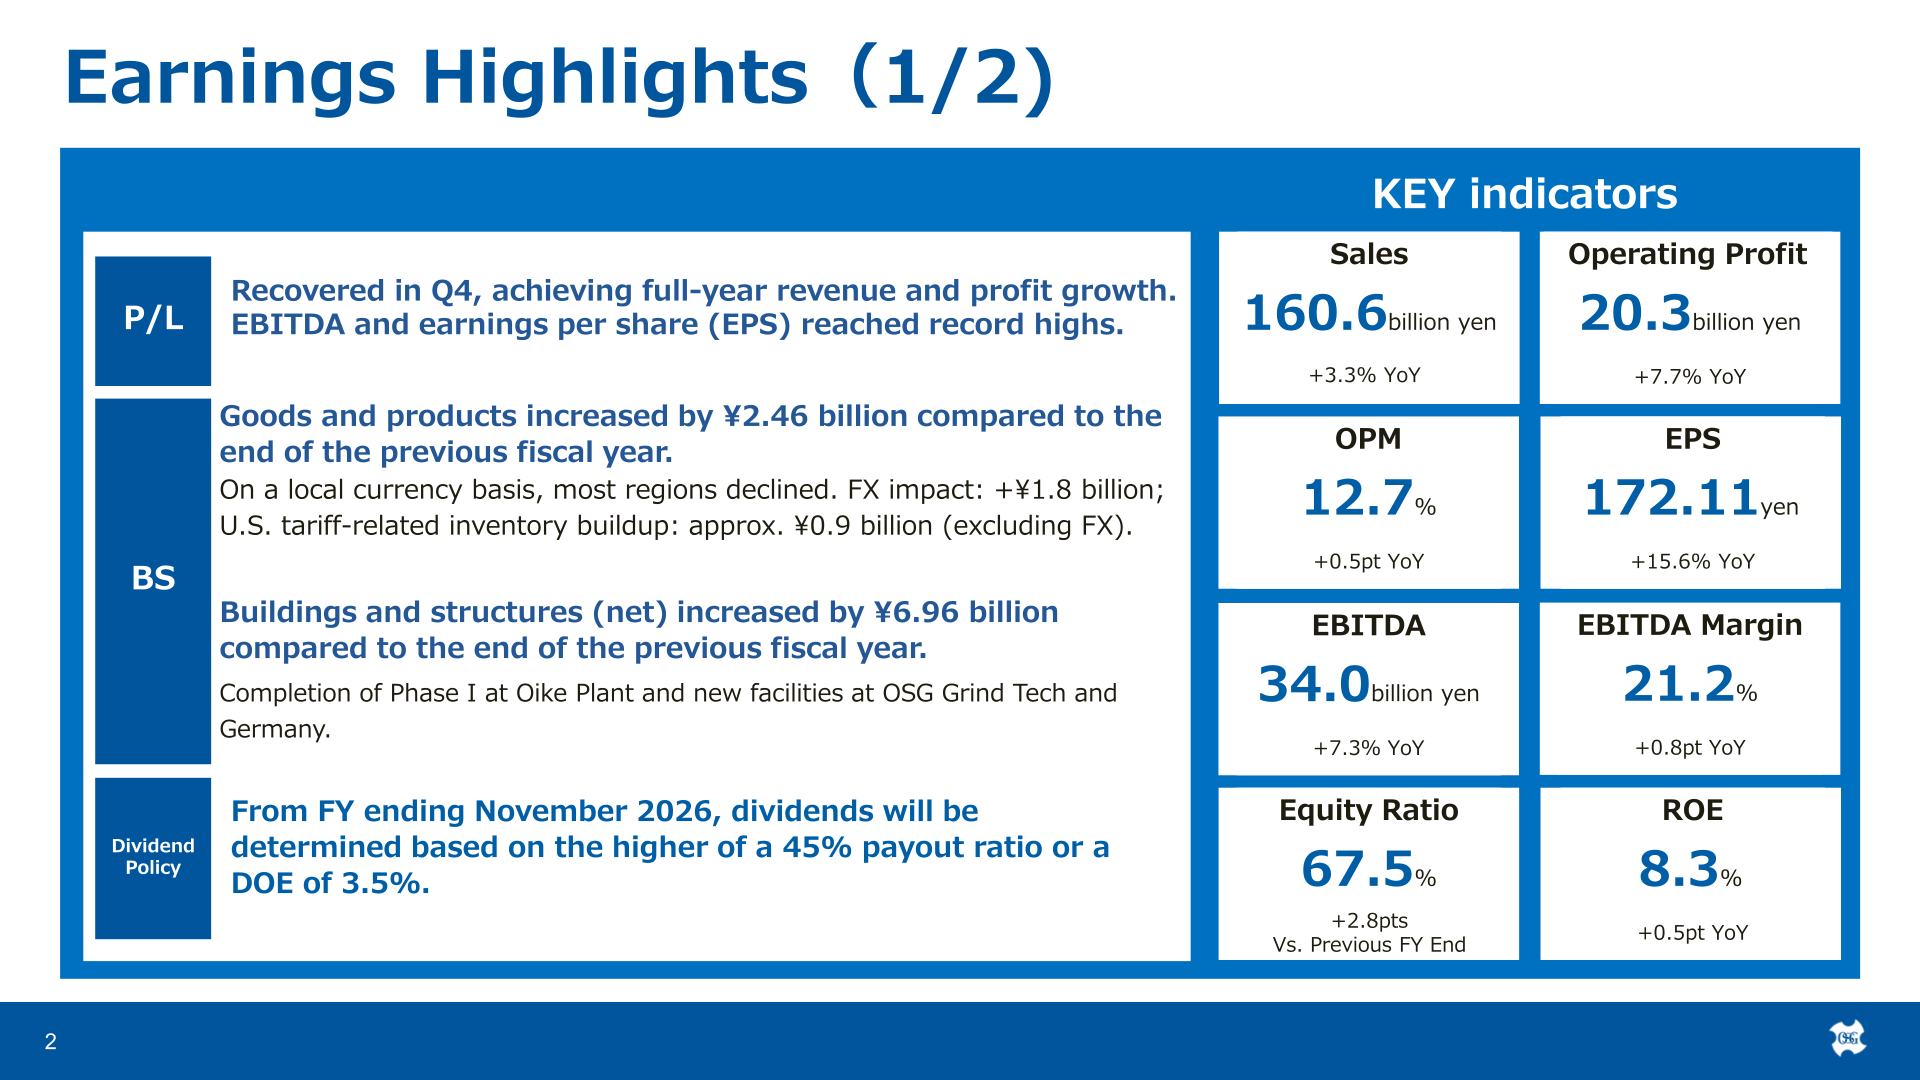
OSG Corporation (6136), the cutting tool maker whose taps hold over 30% global market share, released its “Financial Results For FY2025” presentation dated January 2026. Sales for FY2025 rose 3.3% year on year to 160.6 billion yen and operating profit rose 7.7% to 20.3 billion yen, with the operating profit margin improving 0.5pt to 12.7%. The company states that results recovered in Q4, achieving full-year revenue and profit growth, and that EBITDA (34.0 billion yen, +7.3% YoY) and earnings per share (172.11 yen, +15.6% YoY) reached record highs. ROE was 8.3% (+0.5pt YoY) and the equity ratio was 67.5% (+2.8pts vs. the previous fiscal year-end).
Consolidated Results (FY2025 Actual)
According to the Selected Financial Data, net sales were 160,619 million yen (FY2024: 155,517 million yen), operating profit was 20,330 million yen (18,868 million yen), ordinary profit was 22,354 million yen (19,825 million yen), and net profit was 14,334 million yen (13,439 million yen). The gross profit margin was 41.0% (40.8%), the SG&A to sales ratio was 28.3% (28.7%), and the ordinary profit margin was 13.9% (12.7%). Average exchange rates for FY2025 were 149.91 yen to the US dollar (FY2024: 150.88 yen) and 167.91 yen to the euro (163.71 yen). On the balance sheet, goods and products increased by 2.46 billion yen from the end of the previous fiscal year; the company notes that on a local currency basis most regions declined, with an FX impact of +1.8 billion yen and U.S. tariff-related inventory buildup of approx. 0.9 billion yen (excluding FX). Buildings and structures (net) increased by 6.96 billion yen, reflecting completion of Phase I at the Oike Plant and new facilities at OSG Grind Tech and in Germany.
| Item | FY2025 | FY2024 | Change |
|---|---|---|---|
| Net sales (mil. yen) | 160,619 | 155,517 | +3.3% |
| Gross profit (mil. yen) | 65,819 | 63,475 | — |
| Operating Profit (mil. yen) | 20,330 | 18,868 | +7.7% |
| Operating Profit margin | 12.7% | 12.1% | +0.5pt |
| Ordinary Profit (mil. yen) | 22,354 | 19,825 | — |
| Net Profit (mil. yen) | 14,334 | 13,439 | — |
| EBITDA (mil. yen) | 34,009 | 31,699 | +7.3% |
| EBITDA Margin | 21.2% | 20.4% | +0.8pt |
| Net Profit per share (yen) | 172.11 | 148.94 | +15.6% |
| ROE | 8.3% | 7.7% | +0.5pt |
| Equity ratio | 67.5% | 64.8% | +2.8pts |
Cash flow: net cash provided by operating activities was 26,389 million yen (FY2024: 28,557 million yen), net cash used in investing activities was 13,976 million yen (21,741 million yen), and free cash flow was 12,413 million yen (6,816 million yen). Net cash used in financing activities was 15,035 million yen, including dividends paid of 5,011 million yen and purchase of treasury stock of 5,001 million yen. Cash and cash equivalents at end of period were 48,005 million yen. Capital investment for FY2025 was 14,324 million yen against depreciation of 12,598 million yen. Balance sheet key metrics at the end of FY2025: cash and time deposits 52,350 million yen (end of FY24: 55,774 million yen), interest-bearing debt 44,957 million yen (49,099 million yen), net cash 7,392 million yen (6,675 million yen), receivable turnover period 2.4 months (2.2 months), and inventory turnover period 4.5 months (4.4 months). Total assets were 267,699 million yen (257,256 million yen).
Segment Results
By geographical segment, sales to customers increased in all four regions. Japan rose 2.4% to 51,706 million yen, where A-brand and micro tools remain strong, dental and heavy electrical sectors are solid, and aerospace is recovering. The Americas rose 1.4% to 35,013 million yen (+2.7% in local currency); the company says tariff impact remains limited and orders continue to be solid, Mexico is steady driven by customers certified under USMCA, and Brazil shows strong performance in the aerospace sector. Europe/Africa rose 3.0% to 37,617 million yen (+0.5% in local currency); although conditions in Germany and nearby countries remain challenging, signs of recovery are emerging, and aerospace and medical industries continue to perform well. Asia rose 6.9% to 36,281 million yen (+8.6% in local currency), with China’s manufacturing sector remaining solid and orders strong, higher plant utilization significantly improving profit margins, and Thailand and India continuing to perform well. The overseas sales ratio was 68.2% (Japan 31.8%, The Americas 21.7%, Europe/Africa 22.9%, Asia 23.6%).
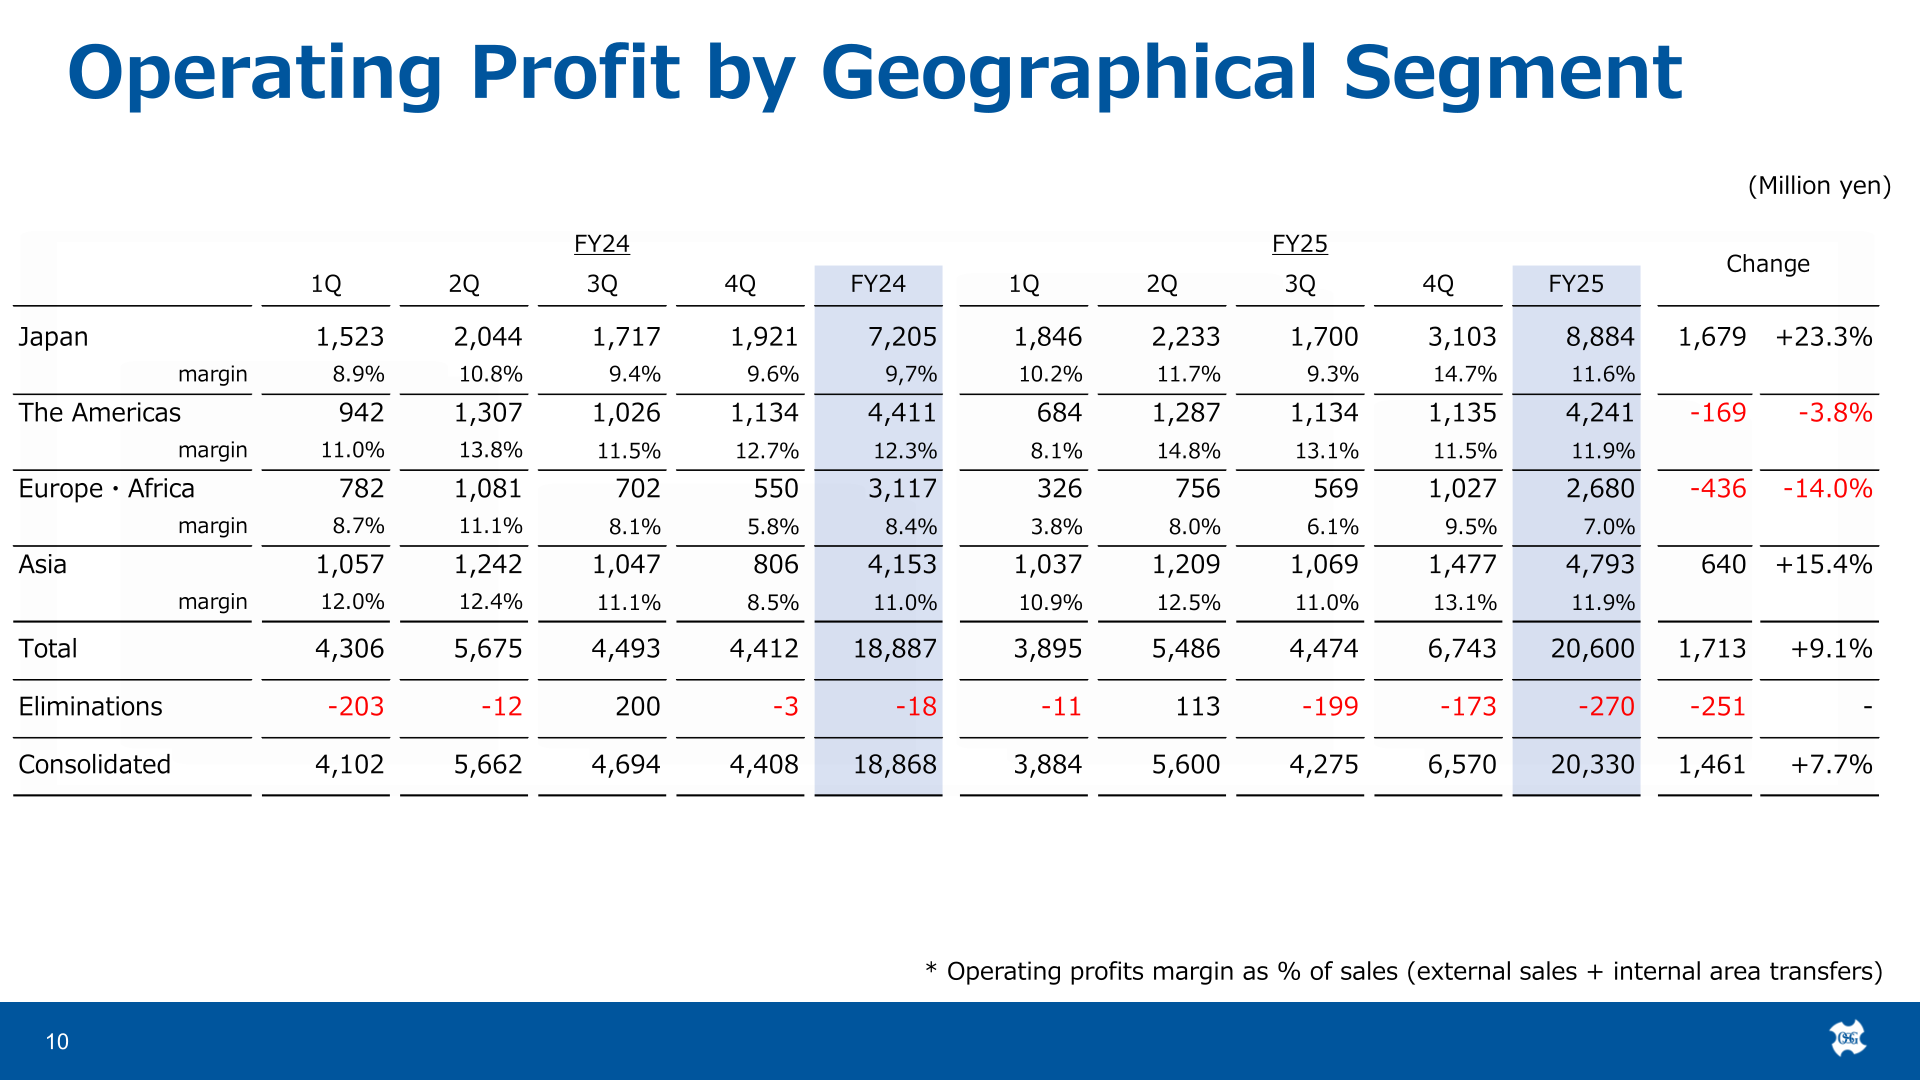
Operating profit by geographical segment: Japan increased 23.3% to 8,884 million yen (margin 11.6%), The Americas decreased 3.8% to 4,241 million yen (11.9%), Europe/Africa decreased 14.0% to 2,680 million yen (7.0%), and Asia increased 15.4% to 4,793 million yen (11.9%). The segment total was 20,600 million yen, and after eliminations of -270 million yen, consolidated operating profit was 20,330 million yen (+7.7%). Operating profit margin is stated as a % of sales including external sales and internal area transfers.
| Geographical Segment | Metric | FY2025 | FY2024 | Change |
|---|---|---|---|---|
| Japan | Sales to customers (mil. yen) | 51,706 | 50,516 | +2.4% |
| The Americas | Sales to customers (mil. yen) | 35,013 | 34,537 | +1.4% (local currency +2.7%) |
| Europe/Africa | Sales to customers (mil. yen) | 37,617 | 36,536 | +3.0% (local currency +0.5%) |
| Asia | Sales to customers (mil. yen) | 36,281 | 33,926 | +6.9% (local currency +8.6%) |
| Consolidated | Sales to customers (mil. yen) | 160,619 | 155,517 | +3.3% |
| Japan | Operating profit (mil. yen) / margin | 8,884 / 11.6% | 7,205 / 9.7% | +23.3% |
| The Americas | Operating profit (mil. yen) / margin | 4,241 / 11.9% | 4,411 / 12.3% | -3.8% |
| Europe/Africa | Operating profit (mil. yen) / margin | 2,680 / 7.0% | 3,117 / 8.4% | -14.0% |
| Asia | Operating profit (mil. yen) / margin | 4,793 / 11.9% | 4,153 / 11.0% | +15.4% |
| Total (before eliminations) | Operating profit (mil. yen) | 20,600 | 18,887 | +9.1% |
| Eliminations | Operating profit (mil. yen) | -270 | -18 | — |
| Consolidated | Operating profit (mil. yen) | 20,330 | 18,868 | +7.7% |
By product segment, Precision Tools net sales rose 3.8% to 145,957 million yen (90.9% of total). Within Precision Tools, Taps rose 3.9% to 53,688 million yen (33.4% of total), Drills and Others rose 8.1% to 49,826 million yen (31.0%), End mills were down 0.2% at 29,300 million yen (18.2%), Rolling dies fell 0.9% to 10,996 million yen (6.8%), and Gauges fell 10.9% to 2,144 million yen (1.3%). The Other segment fell 1.3% to 14,661 million yen, with Machine down 10.7% to 5,283 million yen and Other up 5.0% to 9,377 million yen.
| Product Segment | FY2025 (mil. yen) | Share | FY2024 (mil. yen) | Change |
|---|---|---|---|---|
| Taps | 53,688 | 33.4% | 51,686 | 3.9% |
| End mills | 29,300 | 18.2% | 29,366 | -0.2% |
| Drills and Others | 49,826 | 31.0% | 46,105 | 8.1% |
| Rolling dies | 10,996 | 6.8% | 11,100 | -0.9% |
| Gauges | 2,144 | 1.3% | 2,405 | -10.9% |
| Precision Tools total | 145,957 | 90.9% | 140,664 | 3.8% |
| Machine | 5,283 | 3.3% | 5,919 | -10.7% |
| Other | 9,377 | 5.8% | 8,933 | 5.0% |
| Other total | 14,661 | 9.1% | 14,852 | -1.3% |
| Total | 160,619 | 100% | 155,517 | 3.3% |
FY2026 Forecast
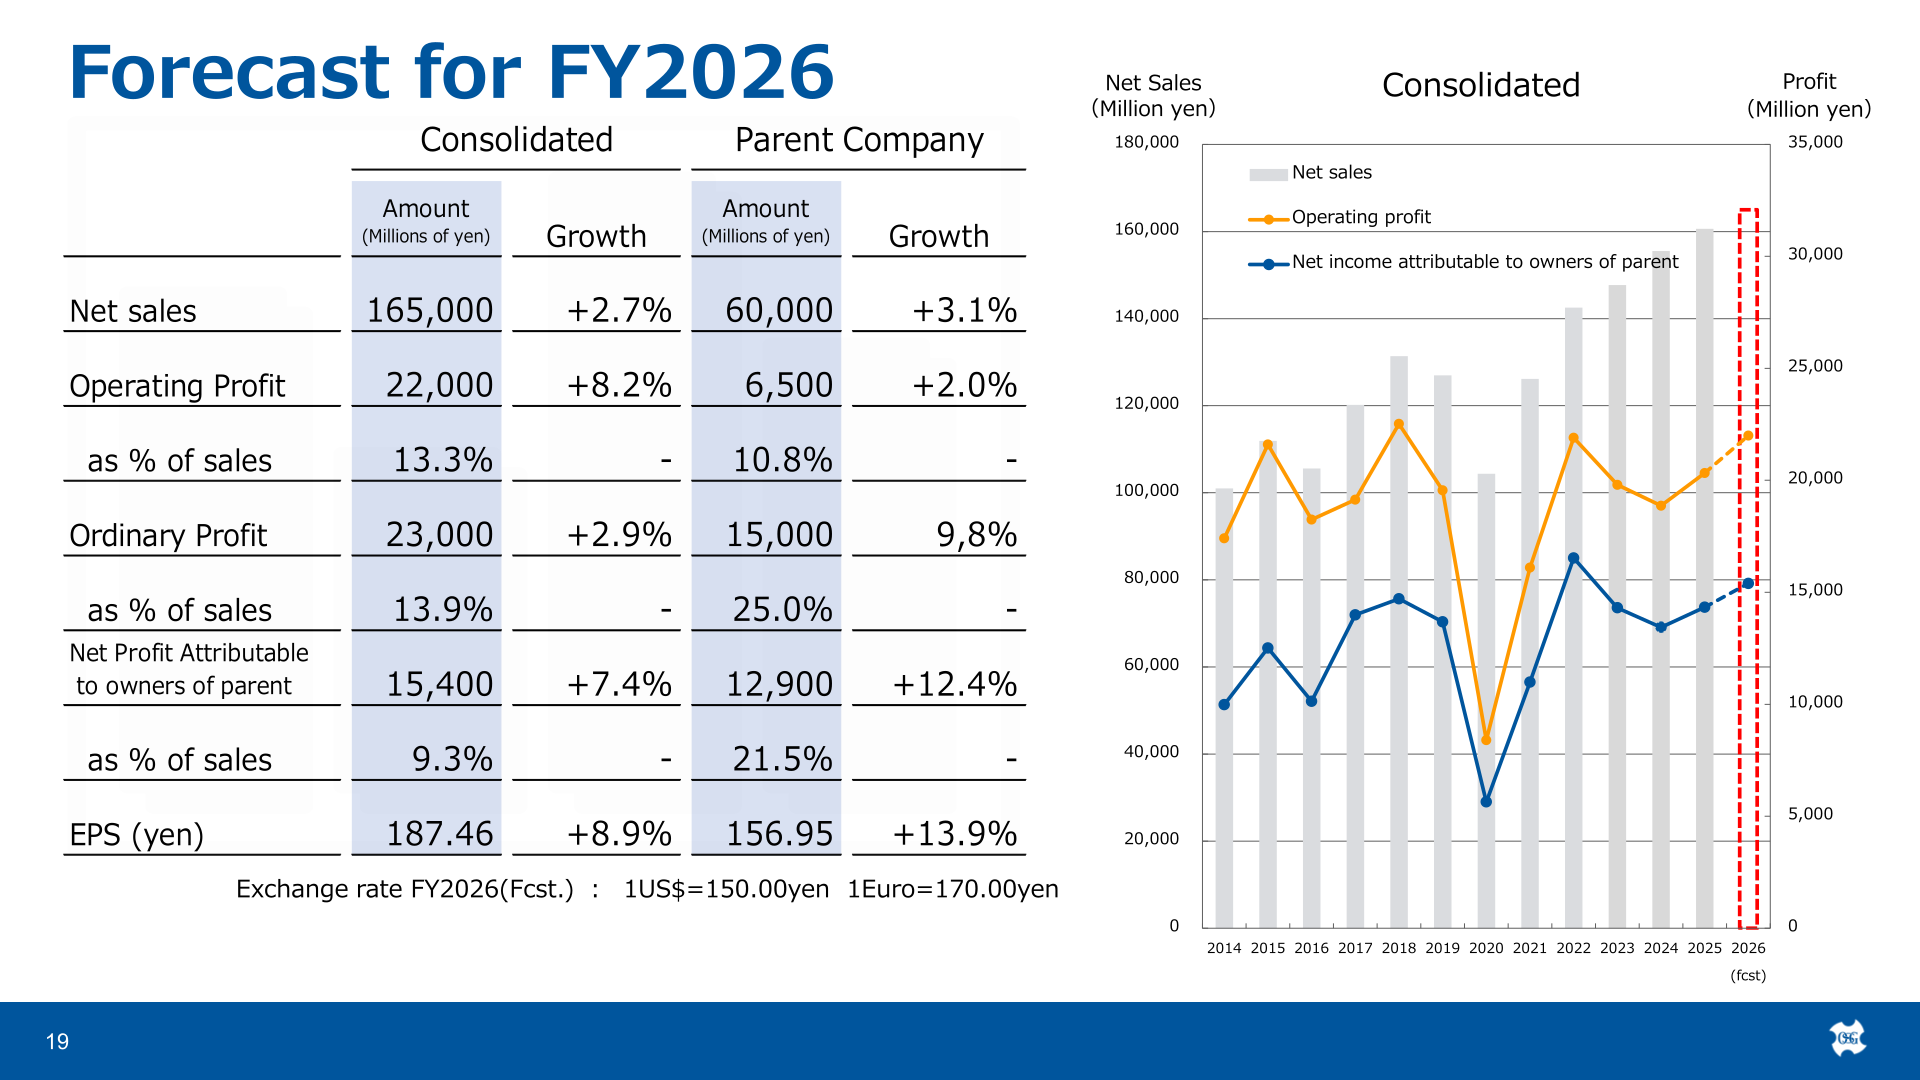
For FY2026 (fiscal year ending November 30, 2026), OSG forecasts consolidated net sales of 165,000 million yen (+2.7%), operating profit of 22,000 million yen (+8.2%, 13.3% of sales), ordinary profit of 23,000 million yen (+2.9%, 13.9% of sales), net profit attributable to owners of parent of 15,400 million yen (+7.4%, 9.3% of sales), and EPS of 187.46 yen (+8.9%). The exchange rate assumptions for FY2026 are 1US$=150.00 yen and 1Euro=170.00 yen (1RMB=22.00 yen). Capital investment for FY2026 is forecast at 12.0 billion yen, including 0.7 billion yen carried over from the FY2024 budget, for the new factory phase II for carbide end mills, machinery and equipment, etc., with depreciation forecast at 12,200 million yen. The company also notes that the parent company forecasts net sales of 60,000 million yen (+3.1%) and operating profit of 6,500 million yen (+2.0%).
| Item (Consolidated) | FY2026 Forecast (mil. yen) | Growth | FY2025 Actual (mil. yen) |
|---|---|---|---|
| Net sales | 165,000 | +2.7% | 160,619 |
| Operating Profit | 22,000 | +8.2% | 20,330 |
| Operating Profit as % of sales | 13.3% | — | 12.7% |
| Ordinary Profit | 23,000 | +2.9% | 22,354 |
| Net Profit Attributable to owners of parent | 15,400 | +7.4% | 14,334 |
| EPS (yen) | 187.46 | +8.9% | 172.11 |
Shareholder Returns
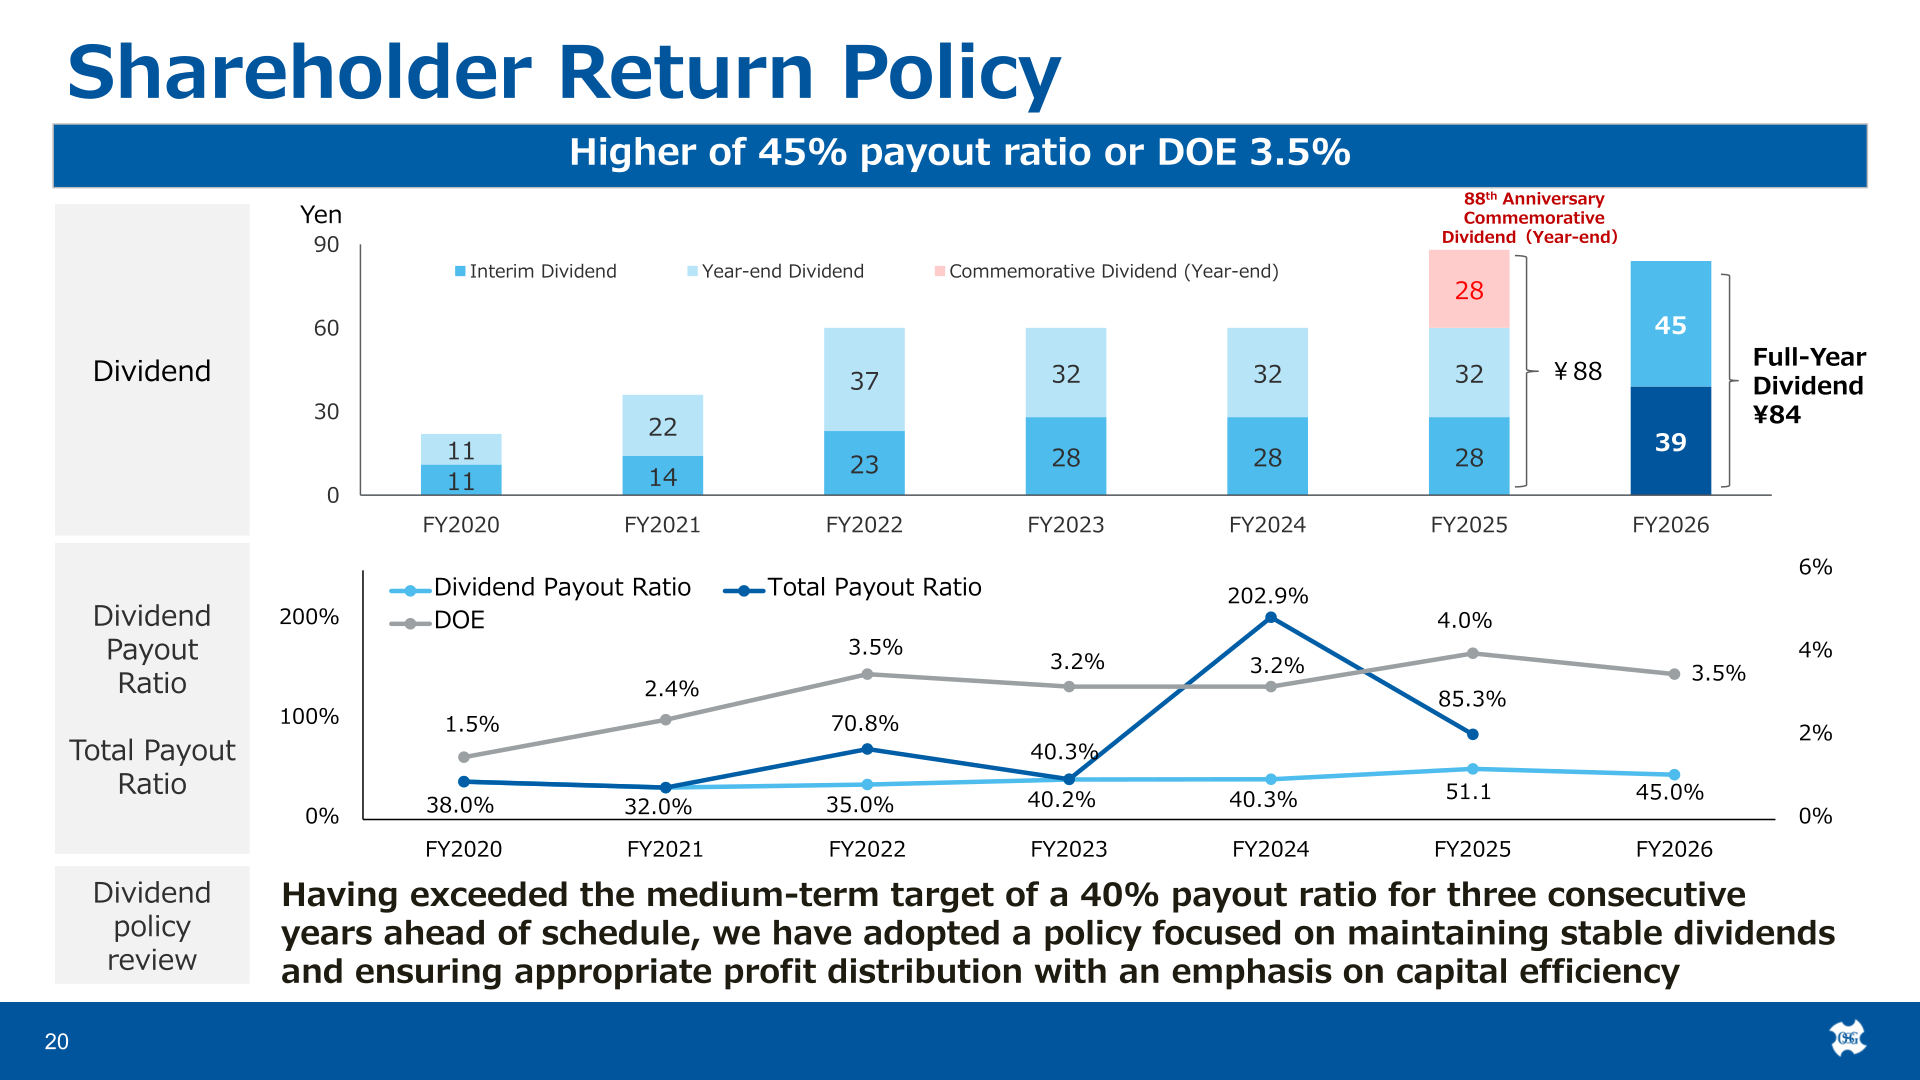
The full-year dividend for FY2025 was 88 yen per share, comprising an interim dividend of 28.00 yen and a year-end dividend of 60.00 yen that includes an 88th Anniversary Commemorative Dividend (year-end); the dividend payout ratio for FY2025 was 51.1% and DOE was 4.0%. Having exceeded the medium-term target of a 40% payout ratio for three consecutive years ahead of schedule, the company has reviewed its dividend policy: from the fiscal year ending November 2026, dividends will be determined based on the higher of a 45% payout ratio or a DOE of 3.5%, with a focus on maintaining stable dividends and ensuring appropriate profit distribution with an emphasis on capital efficiency. The full-year dividend forecast for FY2026 is 84 yen (dividend payout ratio 45.0%, DOE 3.5%). In FY2025, dividends paid were 5,011 million yen and purchase of treasury stock was 5,001 million yen.
| Item | FY2025 | FY2026 (Forecast) |
|---|---|---|
| Full-year dividend per share (yen) | 88 | 84 |
| Dividend payout ratio | 51.1% | 45.0% |
| DOE | 4.0% | 3.5% |
| Dividend policy | Medium-term target of a 40% payout ratio | Higher of 45% payout ratio or DOE 3.5% |
Medium-Term Management Plan and Topics
Under the medium-term management plan “Beyond the Limit 2027” Stage2 (FY2025–FY2027), OSG targets ROE of over 10% and an operating profit ratio of over 16% for the 2027/11 plan, through expansion of high value-added products centered on A-brands, expansion of sales of micro and precision tools, cost improvement through productivity and operational efficiency, review of product series and pricing, reduction of the SG&A ratio, and BS management measures. The company aims for a 40% share of the global market for taps. The Stage2 cash allocation plan (FY2025–FY2027) envisages operating cash flow of 80–90 billion yen and external financing (corporate bonds issued 27 billion yen; sale of assets, etc.) as sources, against strategic investments of 60–70 billion yen (new carbide end mill plant, expansion of production facilities for growth areas, strategic M&A, factory automation, digital transformation), maintenance and renewal of facilities of ~30 billion yen, shareholder returns (dividends, buy-back) of ~50 billion yen, and repayment of loans of ~10 billion yen. The inventory turnover target is 3.5 months by FY2030 versus 4.4 months in FY2024. Sustainability targets include a 20% reduction in CO₂ emissions from FY2019 levels by FY2027 (standalone), Scope 3 calculation, and carbon footprint calculation for major products.
Regarding U.S. tariffs, the company outlines countermeasures such as partially manufacturing taps, carbide drills and carbide end mills at OSG USA and partially shifting production to Mexico (no tariffs on Mexico under USMCA); OSG USA implemented price adjustments in July and November 2025, and inventory coverage in the U.S. was 6.5 months of sales as of November 2025. Among topics, GREEN TAP won two major awards: the ‘Super’ Manufacturing Parts Grand Award (hosted by the Monodzukuri Nippon Conference and Nikkan Kogyo Shimbun) and the Energy Conservation Chairman’s Award (hosted by the Energy Conservation Center, Japan), with the company citing CO₂ emissions cut by 35% through zero chip machining. In the coating business, Primus Freiburg commenced operations in Germany in March 2025 and a fourth coating plant in India (Ahmedabad, Gujarat) is under construction with a target start of May 2026; the group’s coating companies operate in 34 locations across 16 countries. Financial and capital policy: PBR was 1.1 and ROE 8.3% for FY2025, and the company aims for ROE that exceeds the cost of equity while reducing it, through growth investments, shareholder returns and IR activities.
This article is an analysis based on publicly available information and is not a recommendation to buy or sell any specific securities. Investment decisions are your own responsibility.
![[Obayashi] Investors’ Guide 2026 — The Complete 24-Article Breakdown](https://japan-equity.com/wp-content/uploads/2026/07/hub_cover-1024x1024.png)
![[Obayashi] IR & SR Policy — Feeding Dialogue Back into Management](https://japan-equity.com/wp-content/uploads/2026/07/p32_sq-1024x1024.jpg)
![[Obayashi] Real Estate Development — 18.7% Margin, ¥287.7bn Unrealized Gains](https://japan-equity.com/wp-content/uploads/2026/07/p20_sq-1024x1024.jpg)
![[Obayashi] Domestic Civil Engineering — Resilience Spending Supports 9.6% Margin](https://japan-equity.com/wp-content/uploads/2026/07/p11_sq-1024x1024.jpg)
![[Obayashi] Share Price & External Ratings — vs TOPIX, ESG Index Inclusion](https://japan-equity.com/wp-content/uploads/2026/07/p40_sq-1024x1024.jpg)
![[Construction] ¥75.5tn Investment, Shrinking Workforce — Big-5 Market Share](https://japan-equity.com/wp-content/uploads/2026/07/p12_sq-1024x1024.jpg)



![[Obayashi] Capital Policy & Shareholder Returns — ROE 10%+, DOE ~5%, ¥100bn Buyback](https://japan-equity.com/wp-content/uploads/2026/07/p27_sq-1024x1024.jpg)
![[Obayashi] Reducing Cross-Shareholdings — ¥285.2bn Sold in Five Years](https://japan-equity.com/wp-content/uploads/2026/07/p29_sq-1024x1024.jpg)
![[Obayashi] ¥750bn Investment Plan — ¥300bn to Development, ¥190bn to Tech/DX](https://japan-equity.com/wp-content/uploads/2026/07/p30_sq-1024x1024.jpg)
![[Obayashi] MTP2022 KPIs — Operating Profit ~2x Target, ROE 14.4%](https://japan-equity.com/wp-content/uploads/2026/07/p25_sq-1024x1024.jpg)
![[Obayashi] Cash Allocation — ¥420bn Investment CF Over Five Years](https://japan-equity.com/wp-content/uploads/2026/07/p26_sq-1024x1024.jpg)
![[Obayashi] Green Energy — 44 Plants, 344MW, and the Green Hydrogen Challenge](https://japan-equity.com/wp-content/uploads/2026/07/p21_sq-1024x1024.jpg)
![[Obayashi] Tackling the Labor Shortage — Robotics Construction®](https://japan-equity.com/wp-content/uploads/2026/07/p14_sq-1024x1024.jpg)
