
This article is based on publicly available IR materials and is not a recommendation to buy or sell any specific securities.
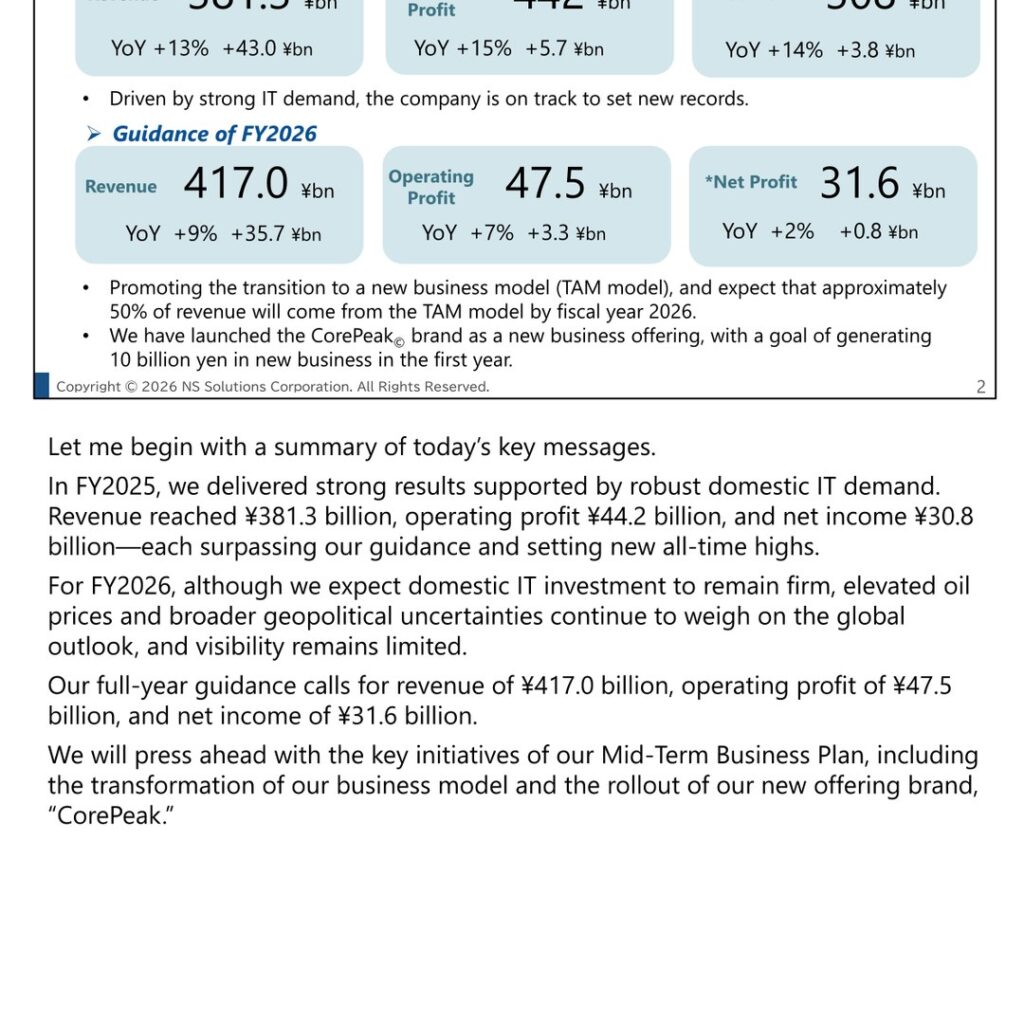
NS Solutions Corporation (NSSOL) reported record FY2025 results, presented on April 27, 2026 together with an update on the first year of its 2025-2027 Mid-term Business Plan. Revenue rose 13% year on year to 381.3 ¥bn, operating profit rose 15% to 44.2 ¥bn and profit attributable to owners of parent rose 14% to 30.8 ¥bn, with each line surpassing guidance and setting new all-time highs. The company attributes the performance to strong domestic IT demand, a 2.5-point improvement in the gross profit margin and the consolidation of Infocom. For FY2026 it guides for revenue of 417.0 ¥bn, operating profit of 47.5 ¥bn and net profit of 31.6 ¥bn.
Consolidated Results (Full-Year Actual)
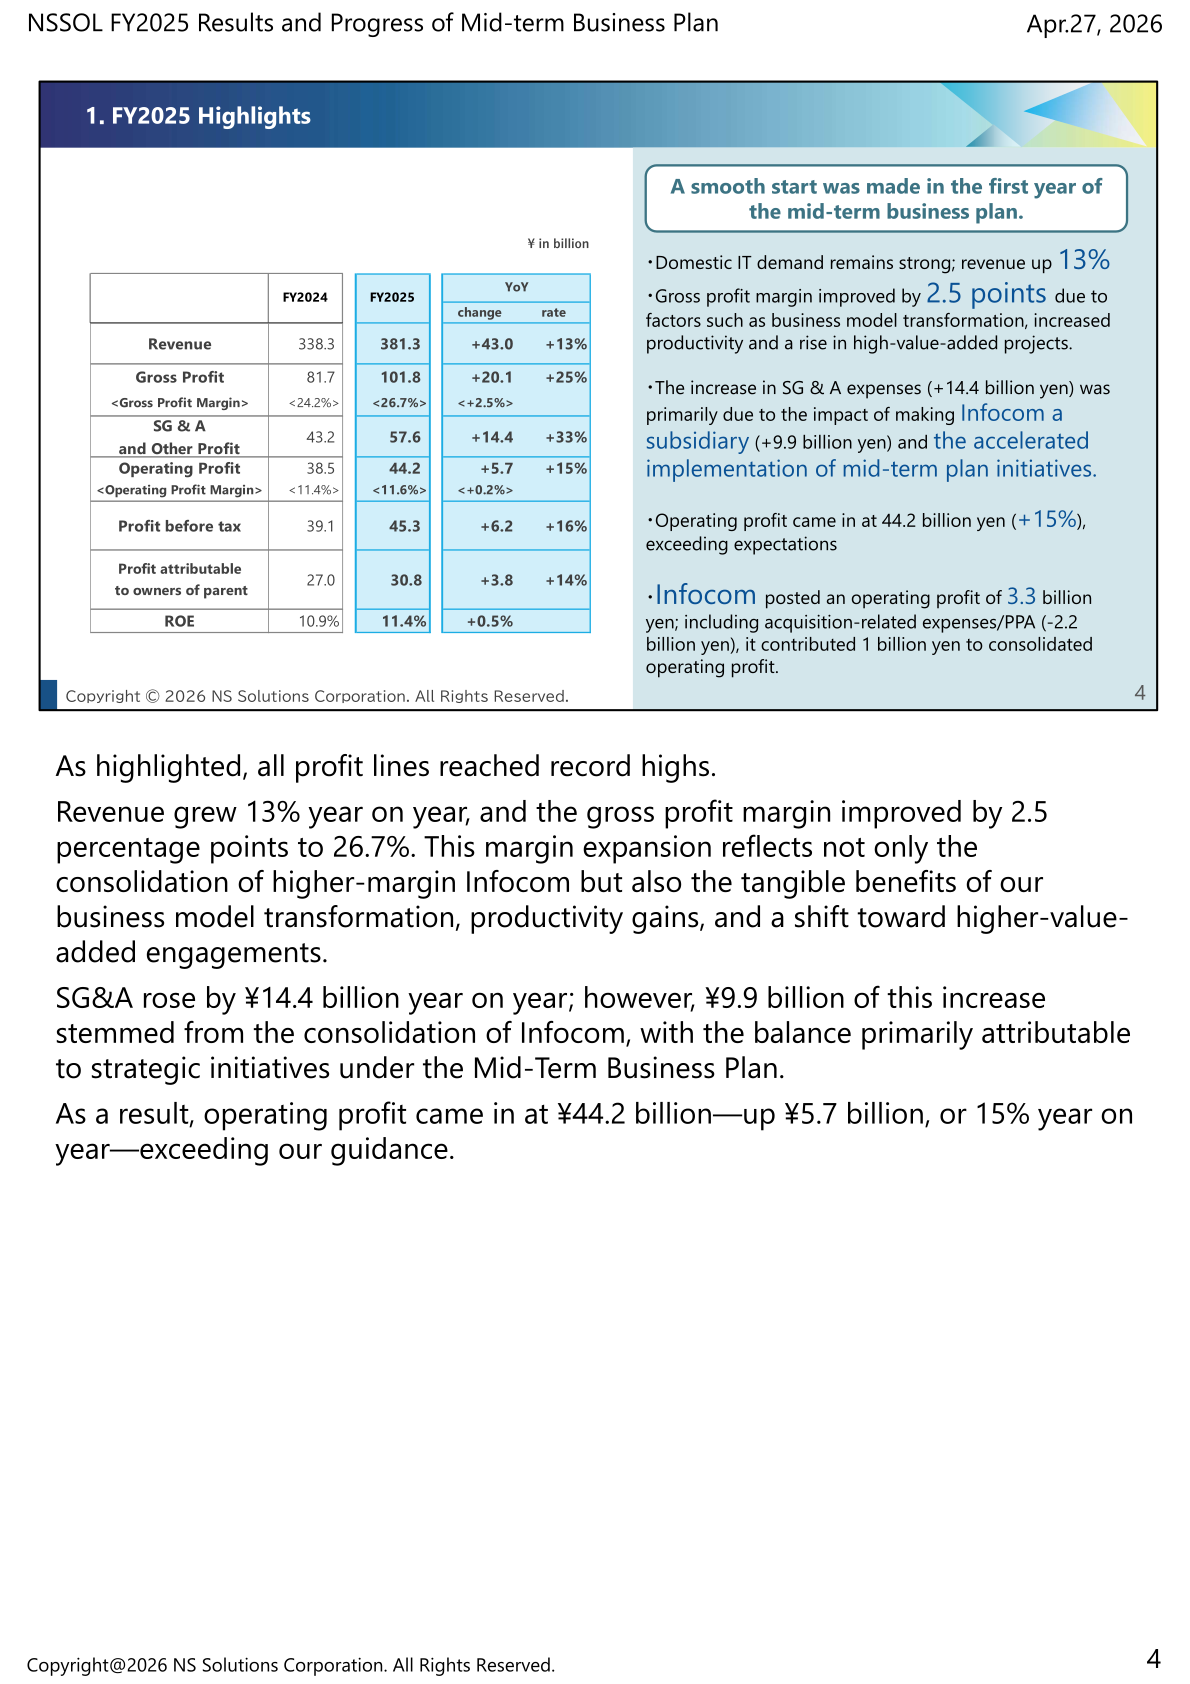
All profit lines reached record highs. The gross profit margin improved by 2.5 points to 26.7%, which the company attributes to the consolidation of higher-margin Infocom together with its business model transformation, productivity gains and a rise in high-value-added projects. SG&A and other profit increased by 14.4 billion yen, of which 9.9 billion yen stemmed from making Infocom a subsidiary, with the balance primarily reflecting the accelerated implementation of Mid-term Plan initiatives. Infocom posted an operating profit of 3.3 billion yen; including acquisition-related expenses and PPA (-2.2 billion yen), it contributed 1 billion yen to consolidated operating profit.
| Item (¥ in billion) | FY2025 | FY2024 | Change | Change rate |
|---|---|---|---|---|
| Revenue | 381.3 | 338.3 | +43.0 | +13% |
| Gross Profit | 101.8 | 81.7 | +20.1 | +25% |
| <Gross Profit Margin> | <26.7%> | <24.2%> | <+2.5%> | |
| SG & A and Other Profit | 57.6 | 43.2 | +14.4 | +33% |
| Operating Profit | 44.2 | 38.5 | +5.7 | +15% |
| <Operating Profit Margin> | <11.6%> | <11.4%> | <+0.2%> | |
| Profit before tax | 45.3 | 39.1 | +6.2 | +16% |
| Profit attributable to owners of parent | 30.8 | 27.0 | +3.8 | +14% |
| ROE | 11.4% | 10.9% | +0.5% |
Segment Results
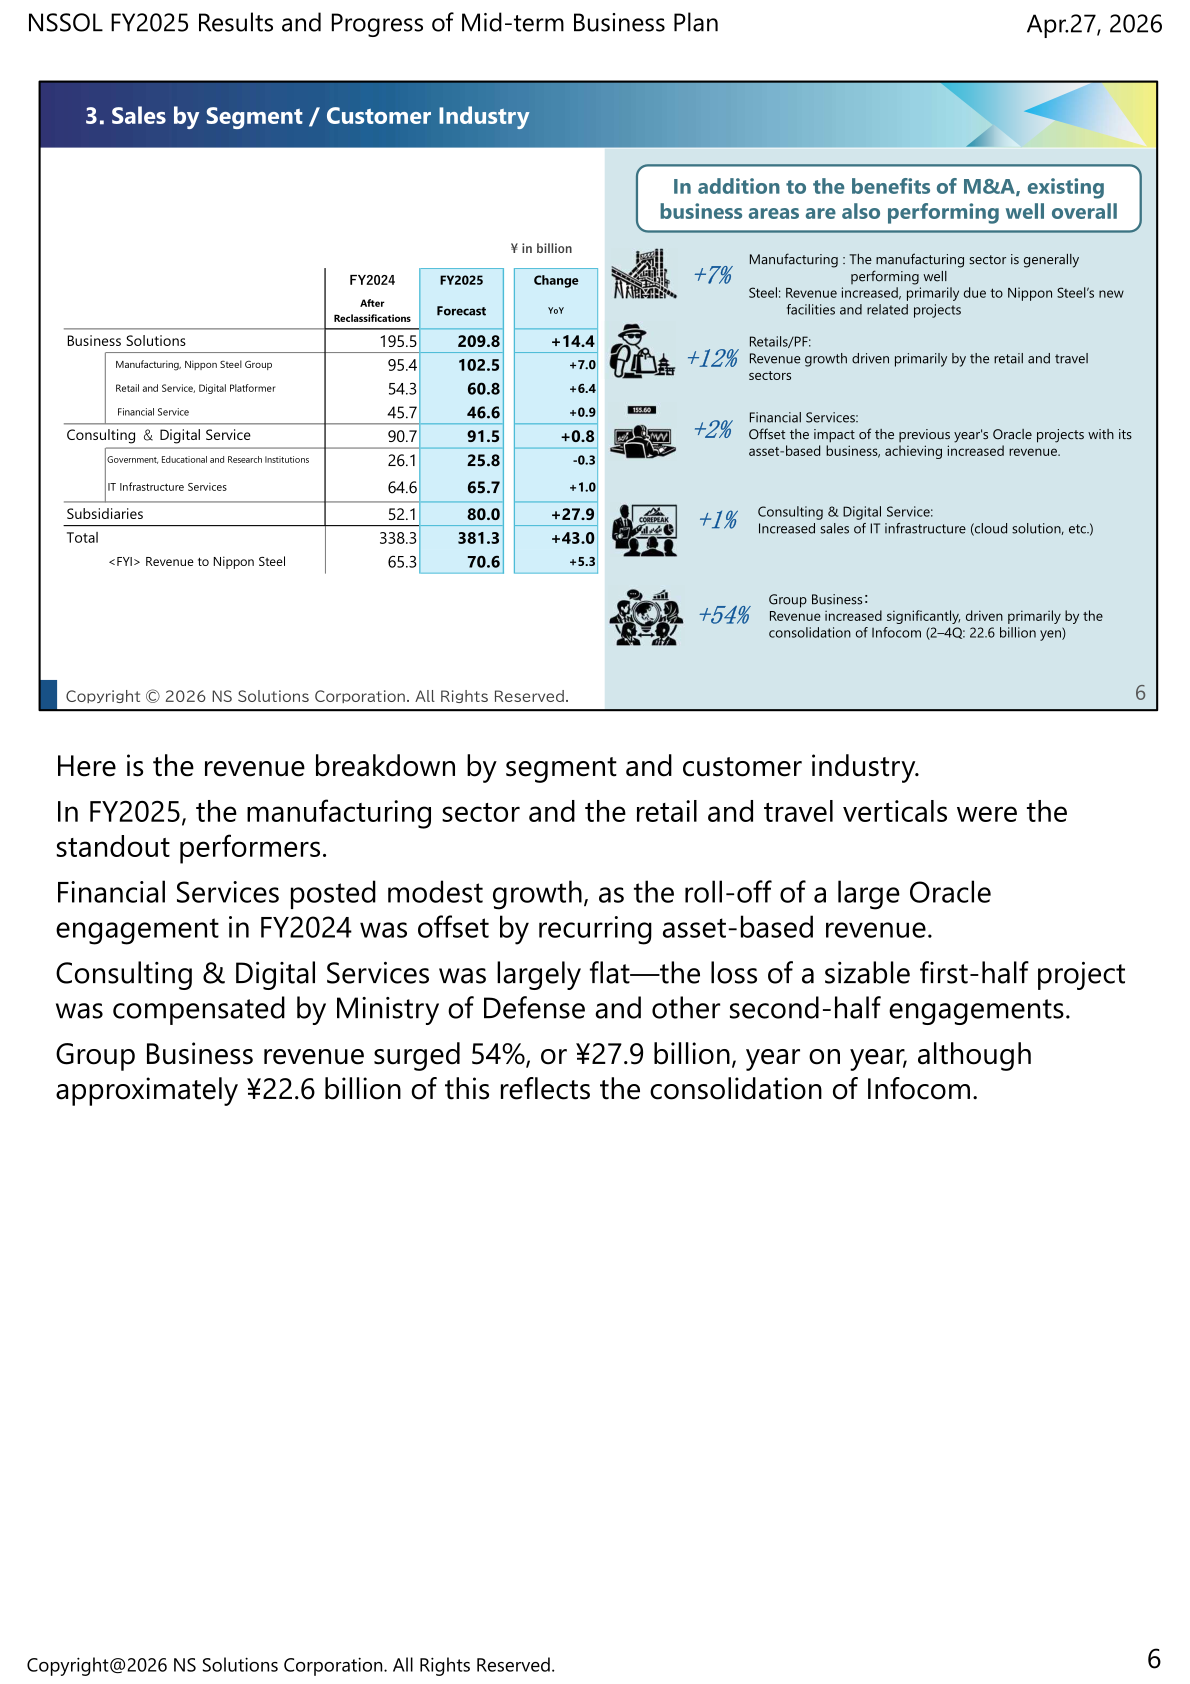
Business Solutions revenue rose 14.4 billion yen. Within it, Manufacturing and the Nippon Steel Group grew 7%, with steel revenue increasing primarily due to Nippon Steel’s new facilities and related projects; Retail and Service / Digital Platformer grew 12%, driven primarily by the retail and travel sectors; and Financial Service grew 2%, as the asset-based business offset the impact of the previous year’s Oracle projects. Consulting & Digital Service was up 1%, helped by increased sales of IT infrastructure such as cloud solutions. Subsidiaries (Group Business) revenue increased 54%, or 27.9 billion yen, driven primarily by the consolidation of Infocom (2Q-4Q: 22.6 billion yen). Revenue to Nippon Steel was 70.6 billion yen, up 5.3 billion yen. FY2024 figures are shown after reclassifications.
| Segment / Customer Industry (¥ in billion) | FY2025 | FY2024 (after reclassifications) | Change (YoY) |
|---|---|---|---|
| Business Solutions | 209.8 | 195.5 | +14.4 |
| Manufacturing, Nippon Steel Group | 102.5 | 95.4 | +7.0 |
| Retail and Service, Digital Platformer | 60.8 | 54.3 | +6.4 |
| Financial Service | 46.6 | 45.7 | +0.9 |
| Consulting & Digital Service | 91.5 | 90.7 | +0.8 |
| Government, Educational and Research Institutions | 25.8 | 26.1 | -0.3 |
| IT Infrastructure Services | 65.7 | 64.6 | +1.0 |
| Subsidiaries | 80.0 | 52.1 | +27.9 |
| Total | 381.3 | 338.3 | +43.0 |
| <FYI> Revenue to Nippon Steel | 70.6 | 65.3 | +5.3 |
Orders, Backlog and Cash Flow
Total orders received in FY2025 reached 407.3 ¥bn, up 51.5 billion yen or 14% year on year and crossing the 400 billion yen threshold for the first time. Group Business orders rose 81%, driven primarily by the consolidation of Infocom (+40.5 ¥bn). The order backlog at the end of March 2026 stood at 199.0 ¥bn, up 26.0 billion yen or 15% from 173.0 ¥bn a year earlier; of this, 153.5 billion yen relates to sales in FY2026, covering approximately 37% of the FY2026 revenue forecast of 417.0 billion yen, versus 33% coverage a year earlier.
Operating cash flow was -3.4 ¥bn (FY2024: 37.2 ¥bn), reflecting one-time factors of -36.0 ¥bn for tax payments related to the sale of shares. Investing cash flow was -59.4 ¥bn (FY2024: 70.3 ¥bn), including a 55 ¥bn cost of acquiring Infocom, and financing cash flow was -21.6 ¥bn (FY2024: -18.8 ¥bn), including a dividend payout of 14.2 ¥bn. Cash and cash equivalents fell 84.1 billion yen to 108.8 ¥bn at the end of March 2026. On the balance sheet, assets declined 3.7 billion yen to 417.6 ¥bn, liabilities fell 22.7 billion yen to 128.8 ¥bn and equity rose 19.0 billion yen to 288.8 ¥bn.
FY2026 Forecast
The company’s base-case assumption is that domestic IT investment will remain robust, while it notes rising risks stemming from overseas political and economic conditions such as the Middle East and U.S. tariff measures. The operating profit bridge to FY2026 comprises a 9.5 billion yen gross profit increase from higher sales (including approximately 3.1 billion yen from the Infocom consolidation moving from 9 months to 12 months), a 3.3 billion yen gross profit margin improvement, and a 9.4 billion yen increase in SG&A.
| Item (¥ in billion) | FY2026 Forecast | FY2025 (Actual) | Difference | YoY rate |
|---|---|---|---|---|
| Revenue | 417.0 | 381.3 | +35.7 | 9% |
| Gross Profit | 114.5 | 101.8 | +12.7 | 12% |
| <Gross Profit Margin> | <27.5%> | <26.7%> | <+0.8%> | |
| SG & A and Other Profit | 67.0 | 57.6 | +9.4 | 16% |
| Operating Profit | 47.5 | 44.2 | +3.3 | 7% |
| <Operating Profit Margin> | <11.4%> | <11.6%> | <-0.2%> | |
| Profit before tax | 48.3 | 45.3 | +3.0 | 7% |
| Profit attributable to owners of parent | 31.6 | 30.8 | +0.8 | 2% |
By segment, and reflecting a new disclosure format from 1Q of FY2026 in which group company revenue is included in each business segment, the company forecasts Business Solutions revenue of 305.0 ¥bn (FY2025 after reclassifications: 286.5 ¥bn, +18.5) and Consulting & Digital Service revenue of 112.0 ¥bn (94.8 ¥bn, +17.2). Revenue to Nippon Steel is forecast at 70.0 ¥bn, down 0.6 billion yen.
Shareholder Returns
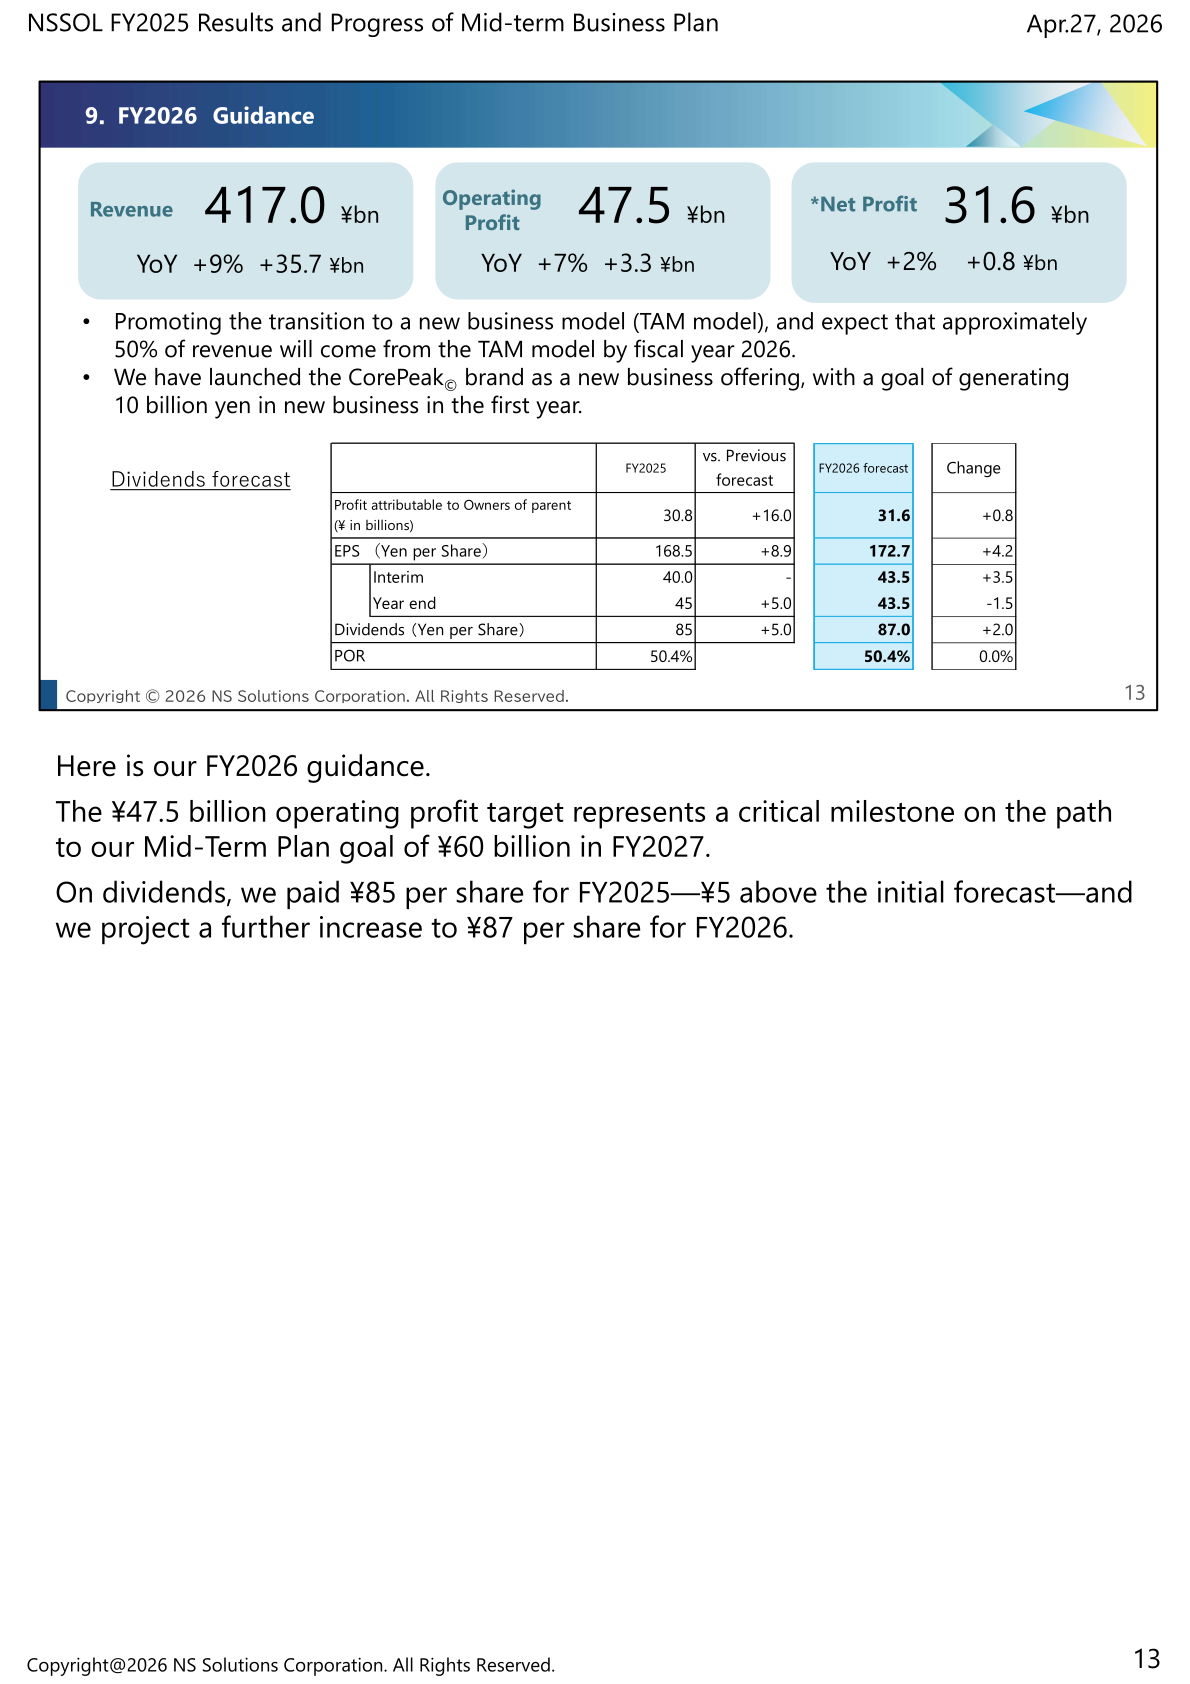
The FY2025 dividend was 85 yen per share (interim 40.0 yen, year end 45 yen), 5.0 yen above the previous forecast, for a payout ratio (POR) of 50.4%. For FY2026 the company forecasts a dividend of 87.0 yen per share (interim 43.5 yen, year end 43.5 yen), an increase of 2.0 yen, with the payout ratio unchanged at 50.4%. Under its cash allocation policy, the company plans to make steady annual increases based on the dividend amount, with a payout ratio of 50%, and to allocate cash to M&A on a scale of 150.0 billion yen over three years, along with growth investments and human capital investment. FY2025 cash out included a dividend of 14.2 ¥bn, M&A of 58.0 ¥bn, growth investments of 14.7 ¥bn and human capital investment of 4.7 ¥bn.
| Item | FY2025 | vs. Previous forecast | FY2026 Forecast | Change |
|---|---|---|---|---|
| Profit attributable to Owners of parent (¥ in billions) | 30.8 | +16.0 | 31.6 | +0.8 |
| EPS (Yen per Share) | 168.5 | +8.9 | 172.7 | +4.2 |
| Dividends – Interim (Yen per Share) | 40.0 | – | 43.5 | +3.5 |
| Dividends – Year end (Yen per Share) | 45 | +5.0 | 43.5 | -1.5 |
| Dividends (Yen per Share) | 85 | +5.0 | 87.0 | +2.0 |
| POR | 50.4% | 50.4% | 0.0% |
Mid-Term Business Plan Progress
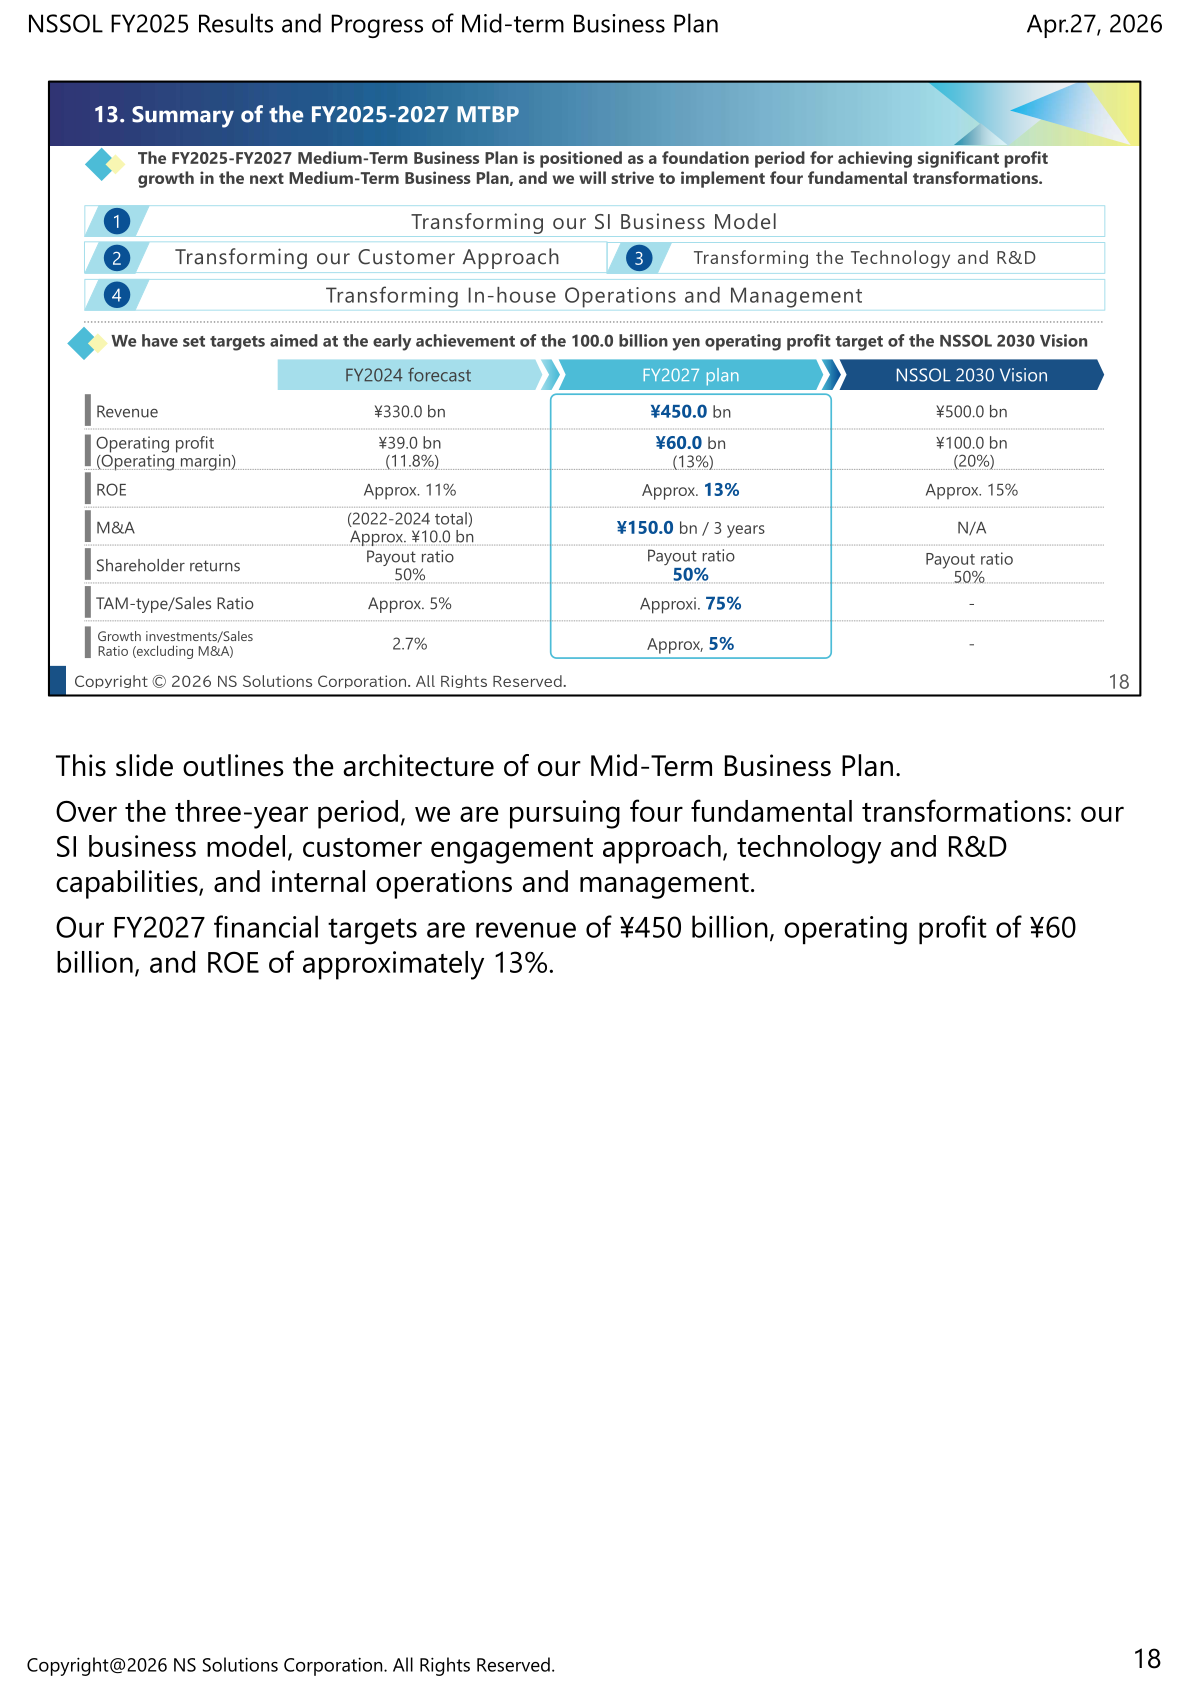
The FY2025-FY2027 Mid-term Business Plan is positioned as a foundation period for achieving significant profit growth in the next plan, built on four fundamental transformations: the SI business model, the customer approach, technology and R&D, and in-house operations and management. FY2027 targets are revenue of ¥450.0 bn and operating profit of ¥60.0 bn (13% margin), with ROE of approximately 13%, against the NSSOL 2030 Vision of ¥500.0 bn in revenue and ¥100.0 bn in operating profit (20% margin) and ROE of approximately 15%. Shareholder returns are based on a payout ratio of 50%, and M&A is sized at ¥150.0 bn over three years.
On the SI business model, the TAM-type share of revenue (SI Transformation, Asset Driven and Multi Company Platform) reached 38% in FY2025 and is targeted at approximately 50% in FY2026 and approximately 75% at the FY2027 plan level; the gross profit margin is shown at 24.2% for FY2024, 26.7% for FY2025 and 27.6% for FY2026. The company launched its new offering brand CorePeak, targeting 10.0 billion yen of revenue in FY2026 and 10% of company revenue in FY2027. In technology and R&D, generative AI is used in over 50% of development projects, with efficiency improvements of 36% in requirements definition and 45% in the production process, and approximately 30 services now running on the company-wide Nestorium platform. In-house, back-office revenue productivity improved 15% from 2024 to 2025, against a target of +30% from 2024 to 2026. Post-merger integration of Infocom targets cumulative synergies of approximately 5 billion yen by FY2027.
This article is an analysis based on publicly available information and is not a recommendation to buy or sell any specific securities. Investment decisions are your own responsibility.
![[Obayashi] Investors’ Guide 2026 — The Complete 24-Article Breakdown](https://japan-equity.com/wp-content/uploads/2026/07/hub_cover-1024x1024.png)
![[Obayashi] IR & SR Policy — Feeding Dialogue Back into Management](https://japan-equity.com/wp-content/uploads/2026/07/p32_sq-1024x1024.jpg)
![[Obayashi] Real Estate Development — 18.7% Margin, ¥287.7bn Unrealized Gains](https://japan-equity.com/wp-content/uploads/2026/07/p20_sq-1024x1024.jpg)
![[Obayashi] Domestic Civil Engineering — Resilience Spending Supports 9.6% Margin](https://japan-equity.com/wp-content/uploads/2026/07/p11_sq-1024x1024.jpg)
![[Obayashi] Share Price & External Ratings — vs TOPIX, ESG Index Inclusion](https://japan-equity.com/wp-content/uploads/2026/07/p40_sq-1024x1024.jpg)
![[Construction] ¥75.5tn Investment, Shrinking Workforce — Big-5 Market Share](https://japan-equity.com/wp-content/uploads/2026/07/p12_sq-1024x1024.jpg)



![[Obayashi] Capital Policy & Shareholder Returns — ROE 10%+, DOE ~5%, ¥100bn Buyback](https://japan-equity.com/wp-content/uploads/2026/07/p27_sq-1024x1024.jpg)
![[Obayashi] Reducing Cross-Shareholdings — ¥285.2bn Sold in Five Years](https://japan-equity.com/wp-content/uploads/2026/07/p29_sq-1024x1024.jpg)
![[Obayashi] ¥750bn Investment Plan — ¥300bn to Development, ¥190bn to Tech/DX](https://japan-equity.com/wp-content/uploads/2026/07/p30_sq-1024x1024.jpg)
![[Obayashi] MTP2022 KPIs — Operating Profit ~2x Target, ROE 14.4%](https://japan-equity.com/wp-content/uploads/2026/07/p25_sq-1024x1024.jpg)
![[Obayashi] Cash Allocation — ¥420bn Investment CF Over Five Years](https://japan-equity.com/wp-content/uploads/2026/07/p26_sq-1024x1024.jpg)
![[Obayashi] Green Energy — 44 Plants, 344MW, and the Green Hydrogen Challenge](https://japan-equity.com/wp-content/uploads/2026/07/p21_sq-1024x1024.jpg)
![[Obayashi] Tackling the Labor Shortage — Robotics Construction®](https://japan-equity.com/wp-content/uploads/2026/07/p14_sq-1024x1024.jpg)
