
This article is based on publicly available IR materials and is not a recommendation to buy or sell any specific securities.
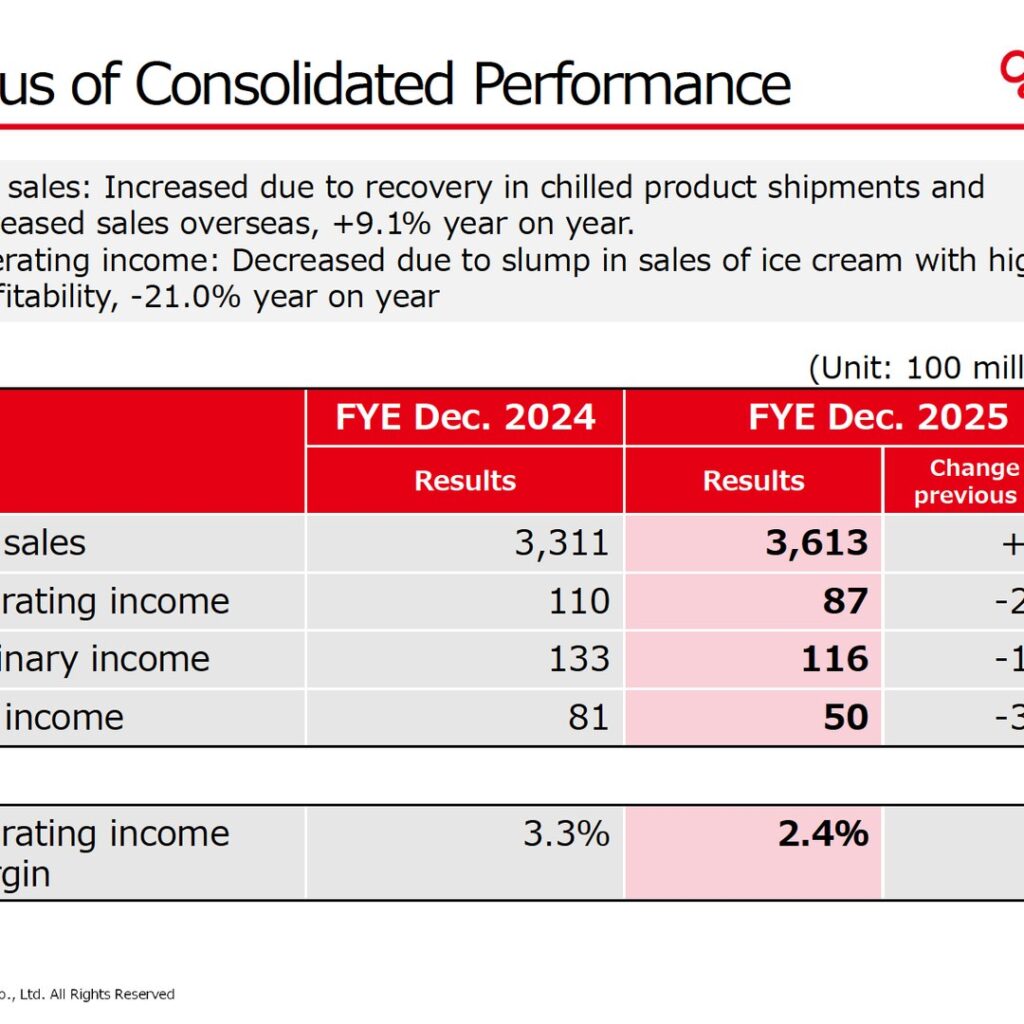
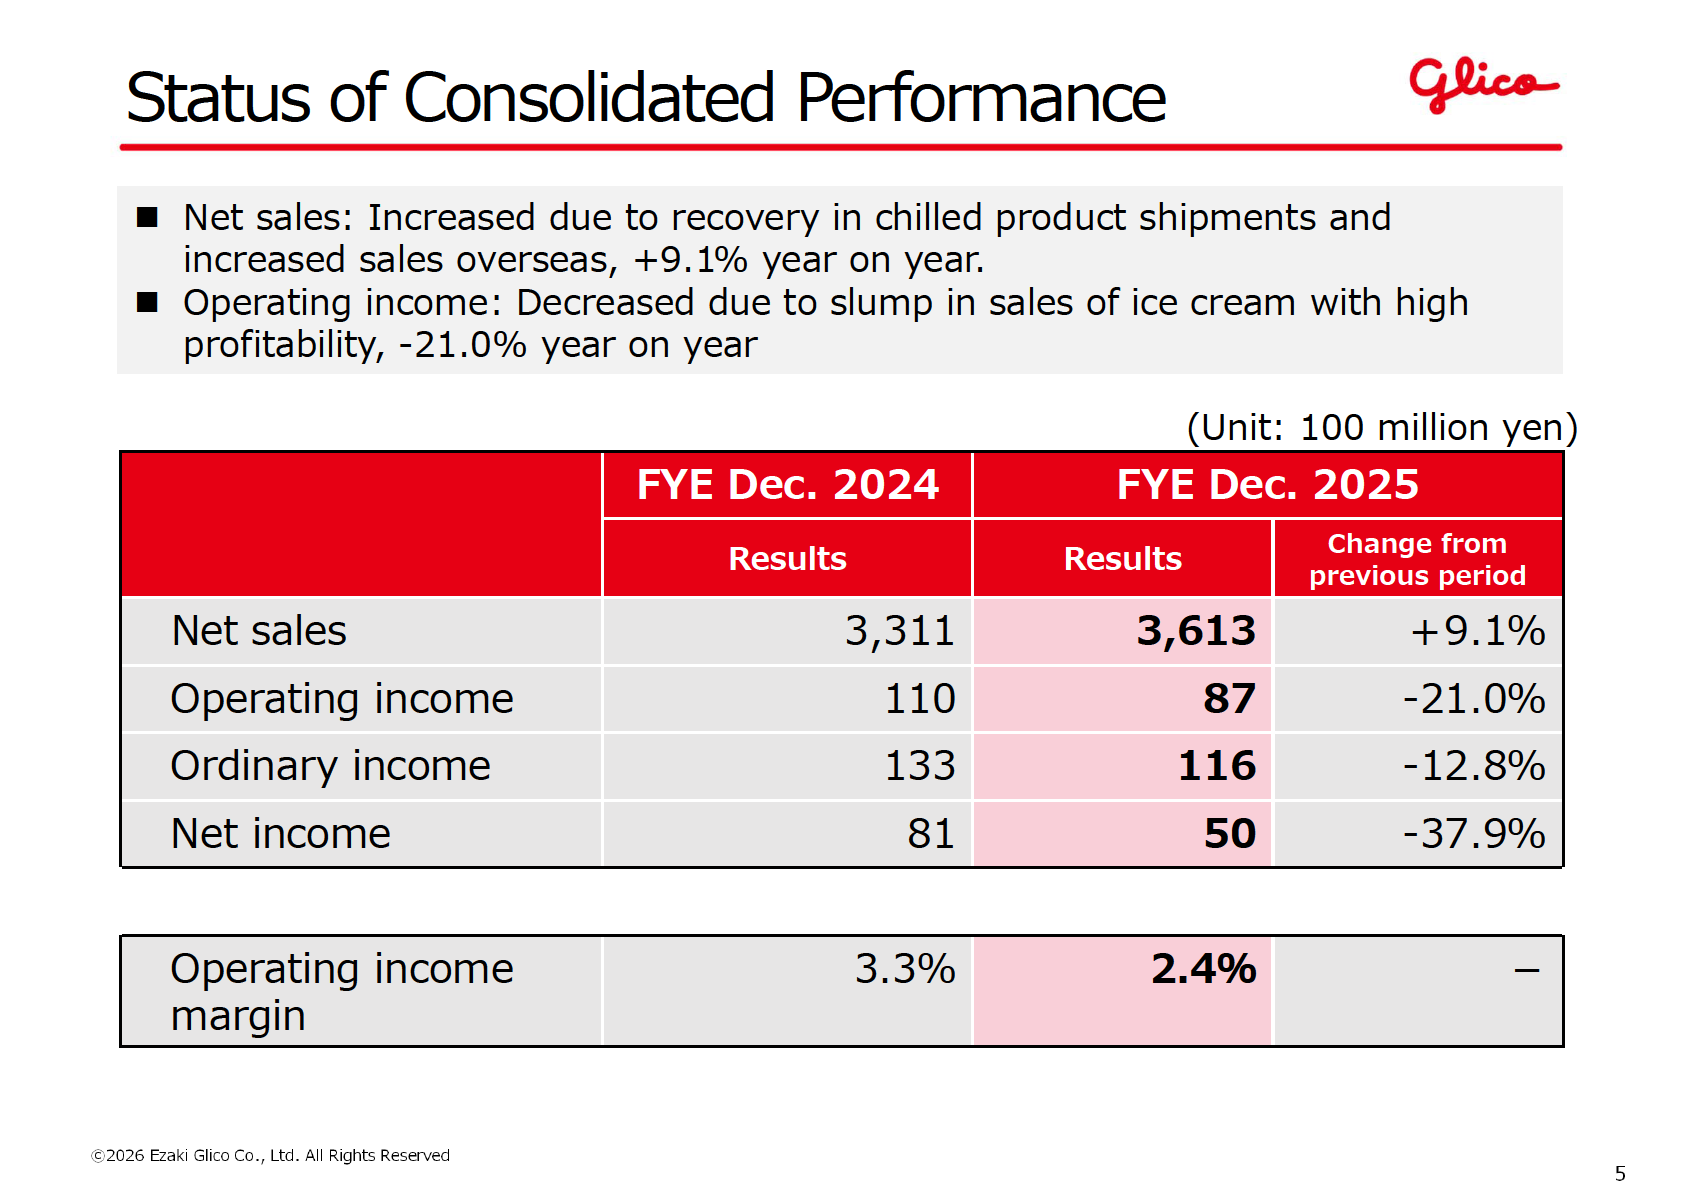
Ezaki Glico Co., Ltd. reported net sales of 3,613 (100 million yen) for the fiscal year ended December 2025, up 9.1% year on year, as chilled product shipments recovered and overseas sales grew. Profits, however, moved in the opposite direction: operating income fell 21.0% to 87, ordinary income declined 12.8% to 116, and net income dropped 37.9% to 50, with the company citing a slump in sales of high-profitability ice cream, higher raw material costs and system-related costs. For the fiscal year ending December 2026 the company forecasts net sales of 380 billion yen (up 5.1%) and operating income of 14 billion yen (up 60.2%). All figures below are as disclosed in the company’s results presentation; the unit is 100 million yen unless otherwise noted.
Consolidated Results (Full-Year Actual)
The company describes the top line as having increased “due to recovery in chilled product shipments and increased sales overseas, +9.1% year on year,” while operating income “decreased due to slump in sales of ice cream with high profitability, -21.0% year on year.” The operating income margin narrowed to 2.4% from 3.3%. On the cost side, the cost-of-sales ratio rose to 62.6% from 61.4%, so gross profit margin fell to 37.4% from 38.6%, while total SG&A came to 1,263, or 35.0% of net sales.
| Item (Unit: 100 million yen) | FYE Dec. 2025 | FYE Dec. 2024 | Change from previous period |
|---|---|---|---|
| Net sales | 3,613 | 3,311 | +9.1% |
| Cost of sales | 2,262 | 2,034 | — |
| Gross profit | 1,351 | 1,276 | — |
| SGA total | 1,263 | 1,166 | — |
| Operating income | 87 | 110 | -21.0% |
| Ordinary income | 116 | 133 | -12.8% |
| Net income | 50 | 81 | -37.9% |
| Operating income margin | 2.4% | 3.3% | — |
In the operating income bridge, the company attributes the year-on-year change to an increase in net sales of +133, an increase/decrease from changes in raw materials prices of -136, an increase/decrease from other changes in cost of sales of +52, a fluctuation in the freight and charges ratio of +1, an increase/decrease in sales promotion and advertising expenses of -30, and an increase/decrease in SG&A of -43. By region the company states that domestic operating income decreased 2.1 billion yen year on year and overseas operating income decreased 0.1 billion yen year on year.
Segment Results
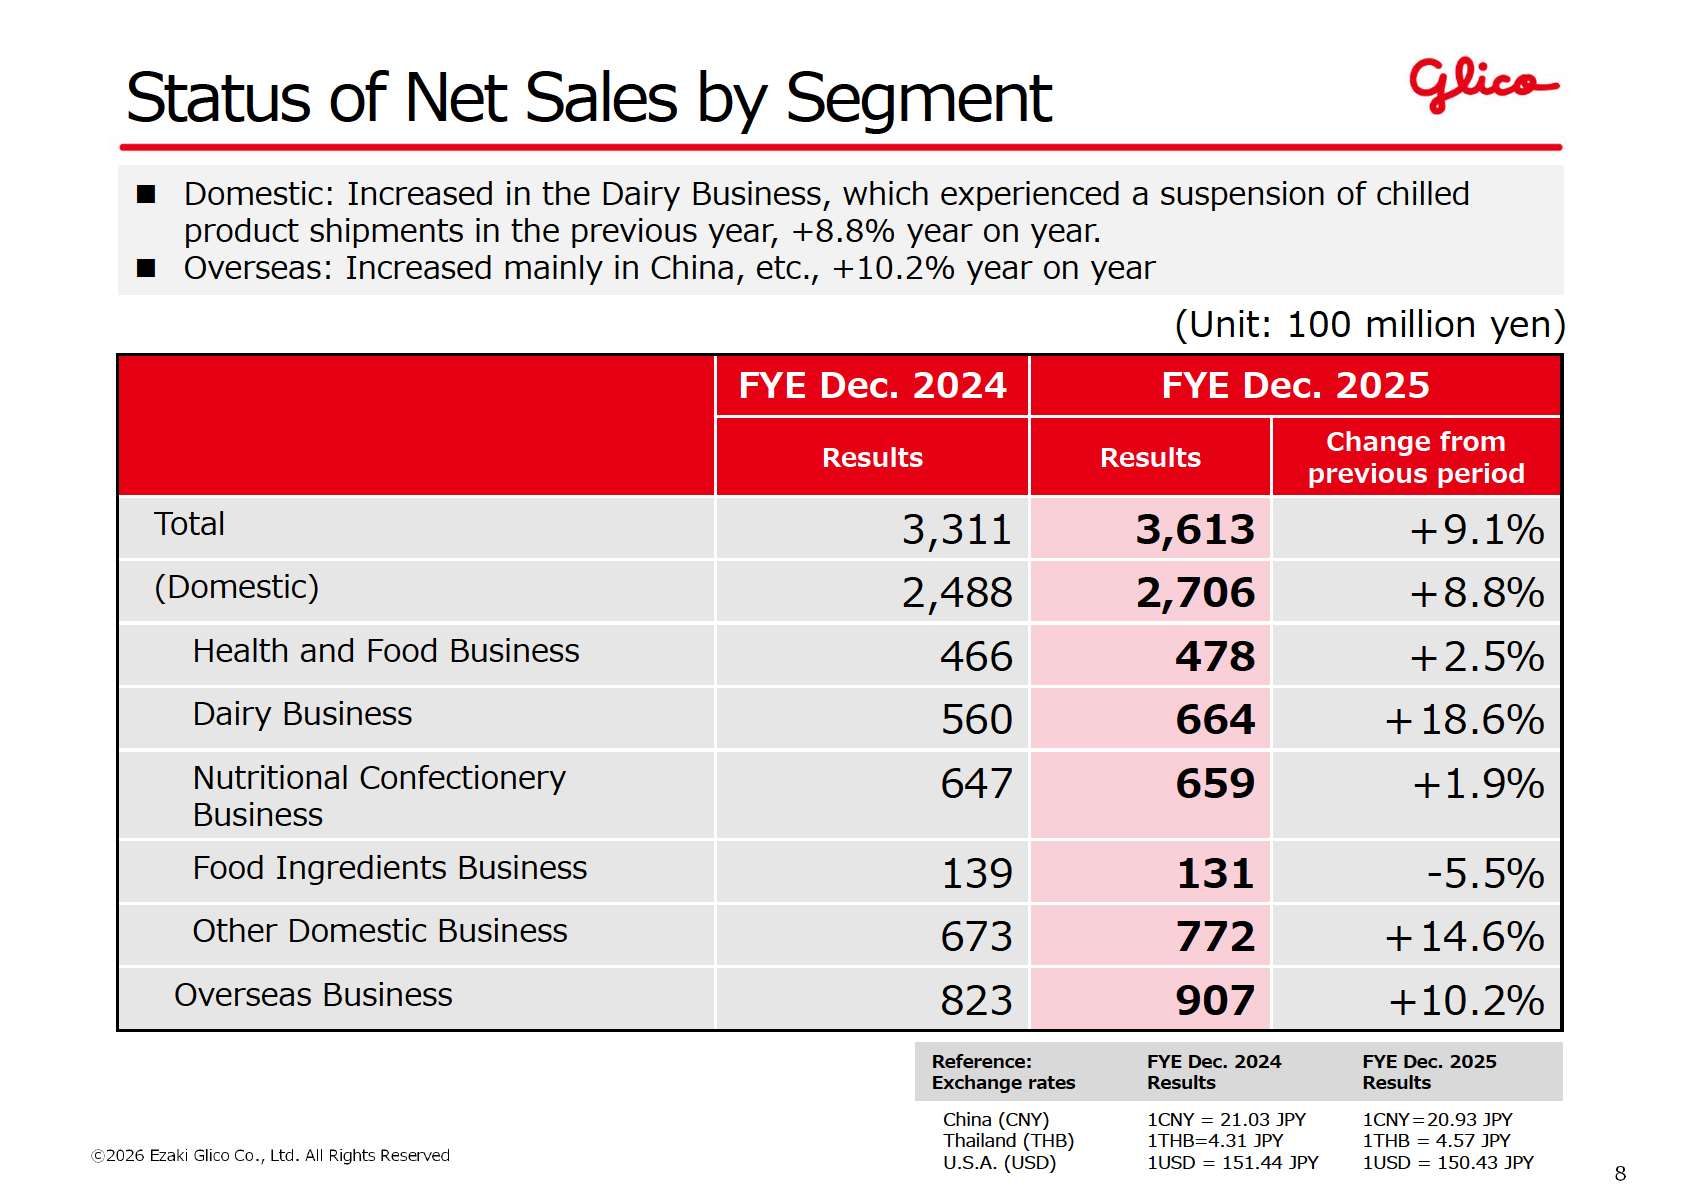
Domestic net sales rose 8.8% year on year, led by the Dairy Business, “which experienced a suspension of chilled product shipments in the previous year,” while overseas net sales increased 10.2%, mainly in China. Domestic segment income, however, fell 81.2% to 5, hit by the ice cream slump together with higher raw material and system-related costs; overseas segment income was down 1.8% to 82 on reduced sales in the U.S.A. and higher raw material costs. The company notes segment net sales of 47.8 billion yen for the Health and Food Business, 66.4 billion yen for the Dairy Business and 65.9 billion yen for the Nutritional Confectionery Business, and segment income of -1.5 billion yen, -7.1 billion yen and 4.3 billion yen respectively.
| Segment (Unit: 100 million yen) | Net sales FYE Dec. 2025 | Net sales FYE Dec. 2024 | Segment income FYE Dec. 2025 | Segment income FYE Dec. 2024 |
|---|---|---|---|---|
| Total | 3,613 | 3,311 | 87 | 110 |
| (Domestic) | 2,706 | 2,488 | 5 | 26 |
| Health and Food Business | 478 | 466 | -15 | -1 |
| Dairy Business | 664 | 560 | -71 | -63 |
| Nutritional Confectionery Business | 659 | 647 | 43 | 51 |
| Food Ingredients Business | 131 | 139 | 22 | 20 |
| Other Domestic Business | 772 | 673 | 6 | -0 |
| Adjustment | — | — | 18 | 19 |
| Overseas Business | 907 | 823 | 82 | 83 |
Overseas Business by Region
China led the overseas expansion: the company reports net sales of 2,274 million CNY “based on shipments and local currencies,” an increase of 21.5% year on year, and operating income of 300 million CNY, up 31.2%, attributing the growth to the expansion of customer contacts in Tier 1 and Tier 2 cities other than Shanghai and expanded deliveries to confectionery specialty stores, even though the offline cookies market declined 14.3% year on year. In ASEAN, net sales were 134 million USD (+0.4%) and operating income 0.99 million USD (+4.2%). In the U.S.A., net sales fell 5.4% to 95 million USD and operating income fell 33.6% to 15 million USD, reflecting slow turnover of the flagship brand “Pocky” and the impact of higher raw material costs and tariffs; figures for the U.S.A. are based on consolidated results.
| Region | Metric | FYE Dec. 2025 | FYE Dec. 2024 | Change from previous period |
|---|---|---|---|---|
| China (million CNY) | Net sales | 2,274 | 1,871 | +21.5% |
| China (million CNY) | Operating income | 300 | 228 | +31.2% |
| ASEAN (million USD) | Net sales | 134 | 133 | +0.4% |
| ASEAN (million USD) | Operating income | 0 | 0 | +4.2% |
| U.S.A. (million USD) | Net sales | 95 | 101 | -5.4% |
| U.S.A. (million USD) | Operating income | 15 | 23 | -33.6% |
FYE December 2026 Forecast
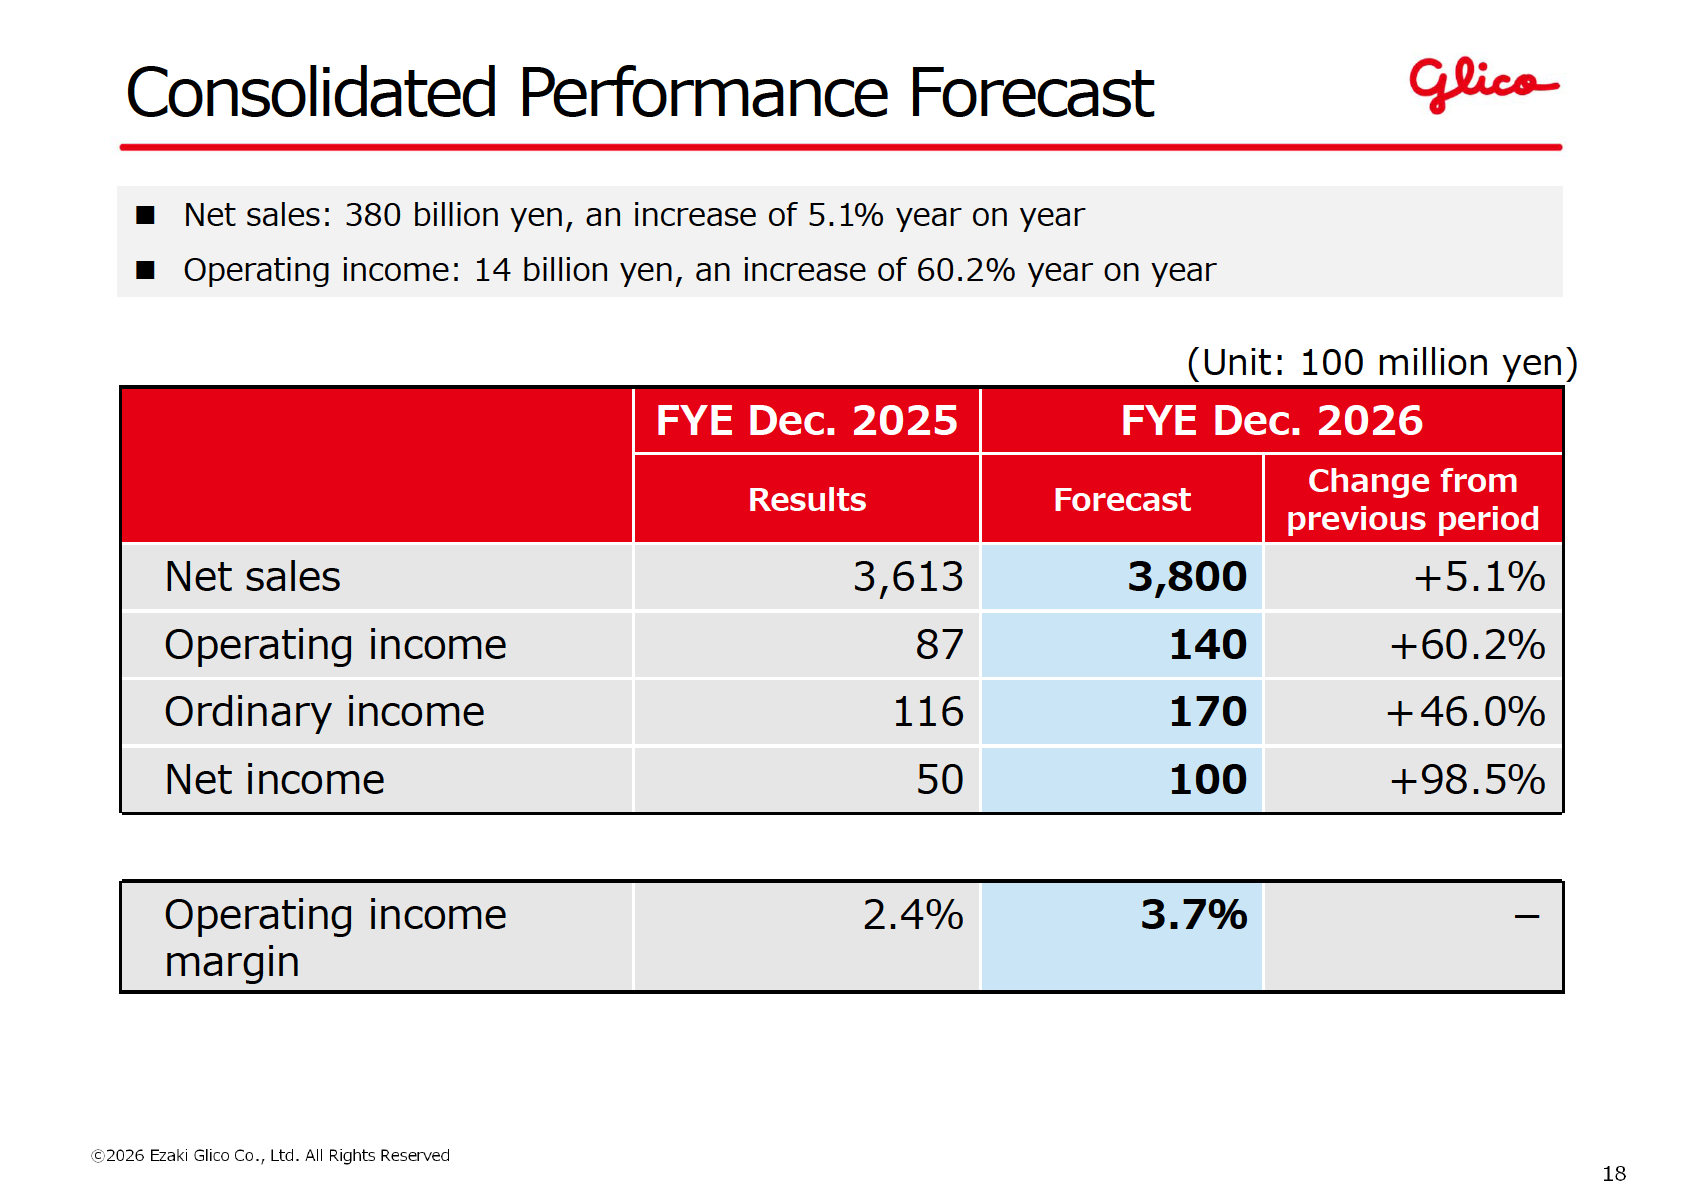
For the fiscal year ending December 2026 the company forecasts net sales of 3,800 (up 5.1%) and operating income of 140 (up 60.2%), with ordinary income of 170 (up 46.0%) and net income of 100 (up 98.5%); the operating income margin is projected at 3.7%. Domestically, operating income is expected to increase 4.4 billion yen year on year on improved profitability in the Health and Food Business and Dairy Business, while overseas operating income is expected to increase 0.9 billion yen on higher sales in China. By segment, forecast net sales are 2,790 for domestic (+3.1%) and 1,010 for the Overseas Business (+11.4%), and forecast segment income turns positive at 10 for the Health and Food Business while the Dairy Business loss narrows to -40.
| Item (Unit: 100 million yen) | FYE Dec. 2026 Forecast | FYE Dec. 2025 (Actual) | Change from previous period |
|---|---|---|---|
| Net sales | 3,800 | 3,613 | +5.1% |
| Cost of sales | 2,333 | 2,262 | — |
| Gross profit | 1,467 | 1,351 | — |
| SGA total | 1,327 | 1,263 | — |
| Operating income | 140 | 87 | +60.2% |
| Ordinary income | 170 | 116 | +46.0% |
| Net income | 100 | 50 | +98.5% |
| Operating income margin | 3.7% | 2.4% | — |
Shareholder Returns
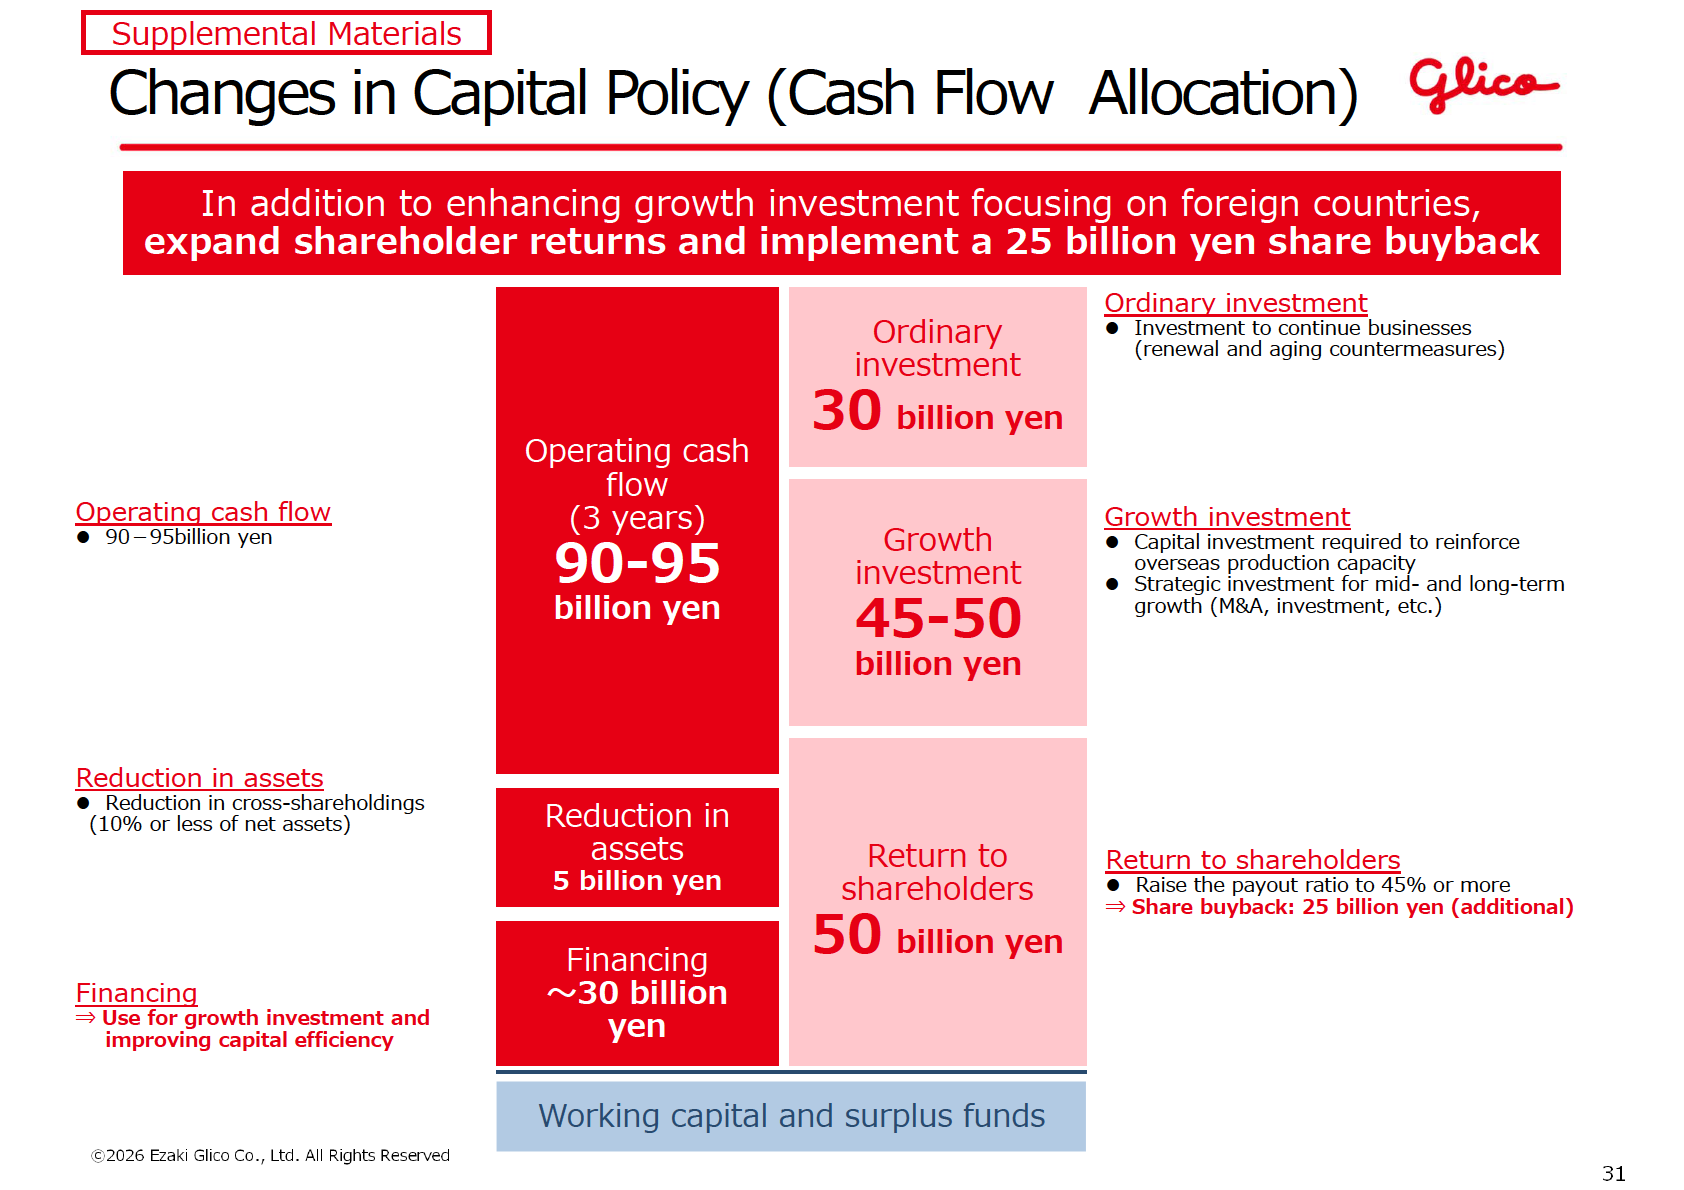
The company states that it “implemented a 25 billion yen share buyback to improve capital efficiency and increase returns to shareholders.” Its capital policy sets the payout ratio at “45% or more,” with the share buyback of 25 billion yen described as additional. The payout ratio was 120.1% in FY25 against 70.6% in FY24 and 36.0% in FY23, and is projected at 60.5% for FY26. In the three-year cash flow allocation plan, operating cash flow of 90-95 billion yen, a reduction in assets of 5 billion yen and financing of up to 30 billion yen are to be allocated to ordinary investment of 30 billion yen, growth investment of 45-50 billion yen and a return to shareholders of 50 billion yen. The company also plans to reduce cross-shareholdings to 10% or less of net assets.
Mid-Term Management Plan
Under the Mid-Term Management Plan for FY2025 to 2027, Glico aims to “accelerate profit generation by creating value and aim to achieve ROE of 6-8%,” targeting annual growth of +5-10% in net sales and +10-15% in operating income, with a payout ratio of 45% or more and ROE of 6-8% in FY27 (and a further improvement targeted for FY30). Actual ROE was 5.6% in FY23, 3.0% in FY24 and 1.8% in FY25, with 4% forecast for FY26. On progress, the company judges that “profits decreased year on year, resulting in disappointing results” against the annual growth rate targets, and that value creation initiatives “increased steadily but not yet at a satisfactory level.” In FY2025 Glico launched 14 value-creation products, compared with an average of eight such products per year during the previous Mid-Term Management Plan (FY2022-2024), which produced a cumulative total of 25. Domestic KPI is net sales growth of +5-8% per year and the overseas KPI is +10% or more per year. On capital costs, the company assumes a cost of shareholders’ equity of 4-6%, with WACC of 3.22-6.50%, CAPM of 6.09-6.54% and an earnings yield (1/PER) of 3.23%.
This article is an analysis based on publicly available information and is not a recommendation to buy or sell any specific securities. Investment decisions are your own responsibility.
![[Obayashi] Investors’ Guide 2026 — The Complete 24-Article Breakdown](https://japan-equity.com/wp-content/uploads/2026/07/hub_cover-1024x1024.png)
![[Obayashi] IR & SR Policy — Feeding Dialogue Back into Management](https://japan-equity.com/wp-content/uploads/2026/07/p32_sq-1024x1024.jpg)
![[Obayashi] Real Estate Development — 18.7% Margin, ¥287.7bn Unrealized Gains](https://japan-equity.com/wp-content/uploads/2026/07/p20_sq-1024x1024.jpg)
![[Obayashi] Domestic Civil Engineering — Resilience Spending Supports 9.6% Margin](https://japan-equity.com/wp-content/uploads/2026/07/p11_sq-1024x1024.jpg)
![[Obayashi] Share Price & External Ratings — vs TOPIX, ESG Index Inclusion](https://japan-equity.com/wp-content/uploads/2026/07/p40_sq-1024x1024.jpg)
![[Construction] ¥75.5tn Investment, Shrinking Workforce — Big-5 Market Share](https://japan-equity.com/wp-content/uploads/2026/07/p12_sq-1024x1024.jpg)



![[Obayashi] Capital Policy & Shareholder Returns — ROE 10%+, DOE ~5%, ¥100bn Buyback](https://japan-equity.com/wp-content/uploads/2026/07/p27_sq-1024x1024.jpg)
![[Obayashi] Reducing Cross-Shareholdings — ¥285.2bn Sold in Five Years](https://japan-equity.com/wp-content/uploads/2026/07/p29_sq-1024x1024.jpg)
![[Obayashi] ¥750bn Investment Plan — ¥300bn to Development, ¥190bn to Tech/DX](https://japan-equity.com/wp-content/uploads/2026/07/p30_sq-1024x1024.jpg)
![[Obayashi] MTP2022 KPIs — Operating Profit ~2x Target, ROE 14.4%](https://japan-equity.com/wp-content/uploads/2026/07/p25_sq-1024x1024.jpg)
![[Obayashi] Cash Allocation — ¥420bn Investment CF Over Five Years](https://japan-equity.com/wp-content/uploads/2026/07/p26_sq-1024x1024.jpg)
![[Obayashi] Green Energy — 44 Plants, 344MW, and the Green Hydrogen Challenge](https://japan-equity.com/wp-content/uploads/2026/07/p21_sq-1024x1024.jpg)
![[Obayashi] Tackling the Labor Shortage — Robotics Construction®](https://japan-equity.com/wp-content/uploads/2026/07/p14_sq-1024x1024.jpg)
