
This article is based on publicly available IR materials and is not a recommendation to buy or sell any specific securities.
Canon Inc. reported FY 2025 results on January 29, 2026 for its fiscal year ending in December. Net sales rose 2.5% year on year to 4,624.7 billion yen, which the company describes as a second consecutive year of record high sales, while operating profit increased 2.4% to 455.4 billion yen and net income increased 2.1% to 332.1 billion yen. All three lines came in above the previous projection of 4,616.0 billion yen, 451.0 billion yen and 325.5 billion yen respectively. Canon paid a dividend of 160 yen per share according to plan, and for 2026 it projects net sales of 4,765.0 billion yen and operating profit of 479.0 billion yen, with a dividend again set at 160 yen per share plus a framework for 200 billion yen of share buybacks.
Consolidated Results (Full-Year Actual)
Canon states that in its markets the trend of delayed investment in the second half, due to additional U.S. tariffs combined with geopolitical risks, continued in the fourth quarter. In Q4, despite a decline in laser printer sales, overall sales reached a record high, driven by double-digit growth in cameras and network cameras as well as growth in Medical and inkjet. For the full year the company achieved 2.5% sales growth and a second consecutive year of record high sales, and posted a high operating profit ratio, offsetting production structural reform costs and the tariff impact with increased sales and effects from last year’s sales structural reforms. Gross profit was 2,162.0 billion yen (46.7% of net sales, versus 47.5% in FY 2024) and operating expenses were 1,706.6 billion yen (36.9% of net sales, versus 37.6%). Income before income taxes (IBT) was 482.1 billion yen, up 3.4%. Average exchange rates for the full year were 149.71 yen to the U.S. dollar and 169.41 yen to the euro, against 151.63 yen and 163.99 yen in FY 2024. FY 2024 figures shown by Canon exclude the impact of an impairment loss.
| Item (Billions of yen) | FY 2025 Actual | FY 2024 Actual | % Change | FY 2025 Previous Projection | Amount Change |
|---|---|---|---|---|---|
| Net Sales | 4,624.7 | 4,509.8 | +2.5% | 4,616.0 | +8.7 |
| Gross Profit | 2,162.0 | 2,143.1 | +0.9% | 2,154.0 | +8.0 |
| (% of Net Sales) | 46.7% | 47.5% | – | 46.7% | – |
| Op. Expenses | 1,706.6 | 1,698.2 | – | 1,703.0 | -3.6 |
| (% of Net Sales) | 36.9% | 37.6% | – | 36.9% | – |
| Op. Profit | 455.4 | 444.9 | +2.4% | 451.0 | +4.4 |
| (% of Net Sales) | 9.8% | 9.9% | – | 9.8% | – |
| IBT | 482.1 | 466.3 | +3.4% | 466.0 | +16.1 |
| Net Income | 332.1 | 325.1 | +2.1% | 325.5 | +6.6 |
| (% of Net Sales) | 7.2% | 7.2% | – | 7.1% | – |
| Exchange rate: USD (yen) | 149.71 | 151.63 | – | 148.58 | – |
| Exchange rate: EUR (yen) | 169.41 | 163.99 | – | 168.24 | – |
Canon’s bridge for the 10.5 billion yen (+2.4%) increase in operating profit from FY 2024 actual (excluding the impairment loss) to FY 2025 shows FX of +0.4 billion yen, sales volume/product mix of +37.2 billion yen, pricing of -17.5 billion yen, cost of +15.0 billion yen, operating expenses of +6.7 billion yen and a tariff impact of -31.3 billion yen. Within the FX line, net sales contributed +6.9 billion yen, cost of sales +8.6 billion yen and operating expenses -15.1 billion yen. Excluding the FX impact, Canon shows a change in net sales of -22.7 billion yen for Printing, +25.7 billion yen for Medical, +137.6 billion yen for Imaging, +8.1 billion yen for Industrial and +5.6 billion yen for Others, a total of +154.3 billion yen.
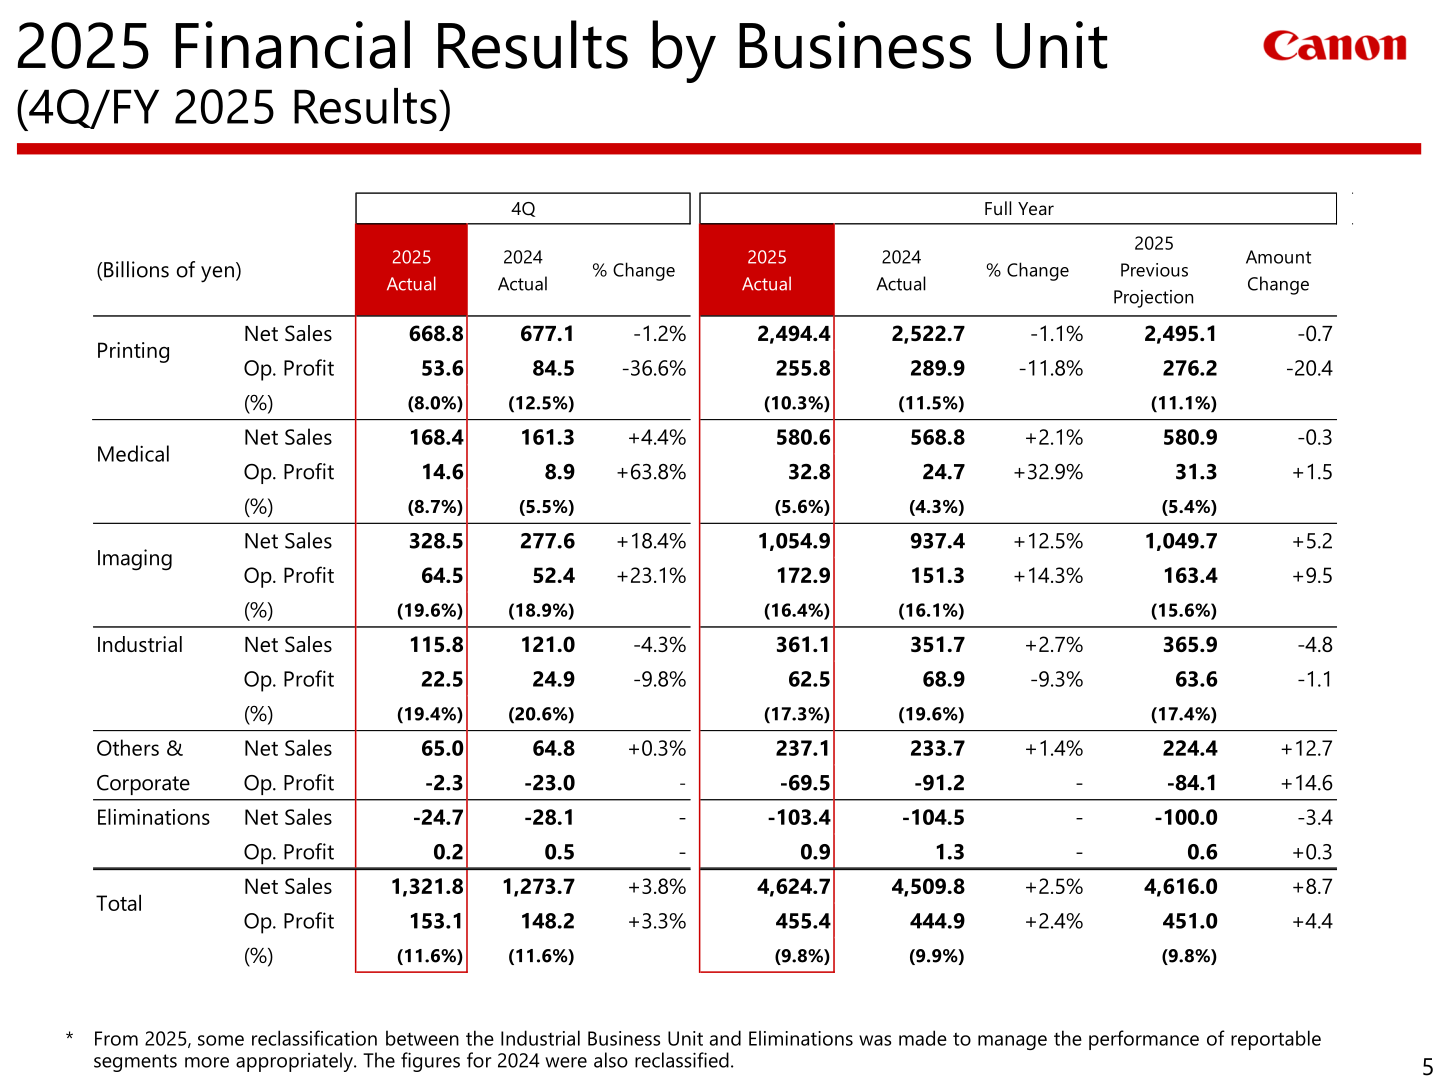
Segment Results
By business unit, Imaging led growth with full-year net sales of 1,054.9 billion yen (+12.5%) and operating profit of 172.9 billion yen (+14.3%), a 16.4% margin. Within Imaging, cameras generated 625.5 billion yen (+7.9%) and network cameras & others 429.4 billion yen (+20.1%); digital interchangeable lens camera units totalled 2.88 million for the year, up 2%. Medical net sales rose 2.1% to 580.6 billion yen with operating profit up 32.9% to 32.8 billion yen. Industrial net sales rose 2.7% to 361.1 billion yen while operating profit fell 9.3% to 62.5 billion yen; the unit shipped 234 semiconductor lithography systems (46 KrF and 188 i-line) and 33 FPD systems in 2025. Printing net sales declined 1.1% to 2,494.4 billion yen and operating profit declined 11.8% to 255.8 billion yen; within Printing, Production was 437.3 billion yen (-0.9%) and the Office group was 1,063.7 billion yen (+0.8%), of which office MFDs were 631.6 billion yen (-2.4%), while the Prosumer group fell 3.2% to 993.4 billion yen, with laser printers down 4.6% to 648.1 billion yen and inkjet printers down 0.4% to 345.3 billion yen. Canon notes that from 2025 some reclassification between the Industrial Business Unit and Eliminations was made to manage the performance of reportable segments more appropriately, and that the 2024 figures were also reclassified.
| Business Unit (Billions of yen) | Metric | FY 2025 Actual | FY 2024 Actual | % Change | FY 2025 Previous Projection |
|---|---|---|---|---|---|
| Printing | Net Sales | 2,494.4 | 2,522.7 | -1.1% | 2,495.1 |
| Printing | Op. Profit | 255.8 | 289.9 | -11.8% | 276.2 |
| Printing | (Op. Profit %) | (10.3%) | (11.5%) | – | (11.1%) |
| Medical | Net Sales | 580.6 | 568.8 | +2.1% | 580.9 |
| Medical | Op. Profit | 32.8 | 24.7 | +32.9% | 31.3 |
| Medical | (Op. Profit %) | (5.6%) | (4.3%) | – | (5.4%) |
| Imaging | Net Sales | 1,054.9 | 937.4 | +12.5% | 1,049.7 |
| Imaging | Op. Profit | 172.9 | 151.3 | +14.3% | 163.4 |
| Imaging | (Op. Profit %) | (16.4%) | (16.1%) | – | (15.6%) |
| Industrial | Net Sales | 361.1 | 351.7 | +2.7% | 365.9 |
| Industrial | Op. Profit | 62.5 | 68.9 | -9.3% | 63.6 |
| Industrial | (Op. Profit %) | (17.3%) | (19.6%) | – | (17.4%) |
| Others & Corporate | Net Sales | 237.1 | 233.7 | +1.4% | 224.4 |
| Others & Corporate | Op. Profit | -69.5 | -91.2 | – | -84.1 |
| Eliminations | Net Sales | -103.4 | -104.5 | – | -100.0 |
| Eliminations | Op. Profit | 0.9 | 1.3 | – | 0.6 |
| Total | Net Sales | 4,624.7 | 4,509.8 | +2.5% | 4,616.0 |
| Total | Op. Profit | 455.4 | 444.9 | +2.4% | 451.0 |
| Total | (Op. Profit %) | (9.8%) | (9.9%) | – | (9.8%) |
FY 2026 Projection
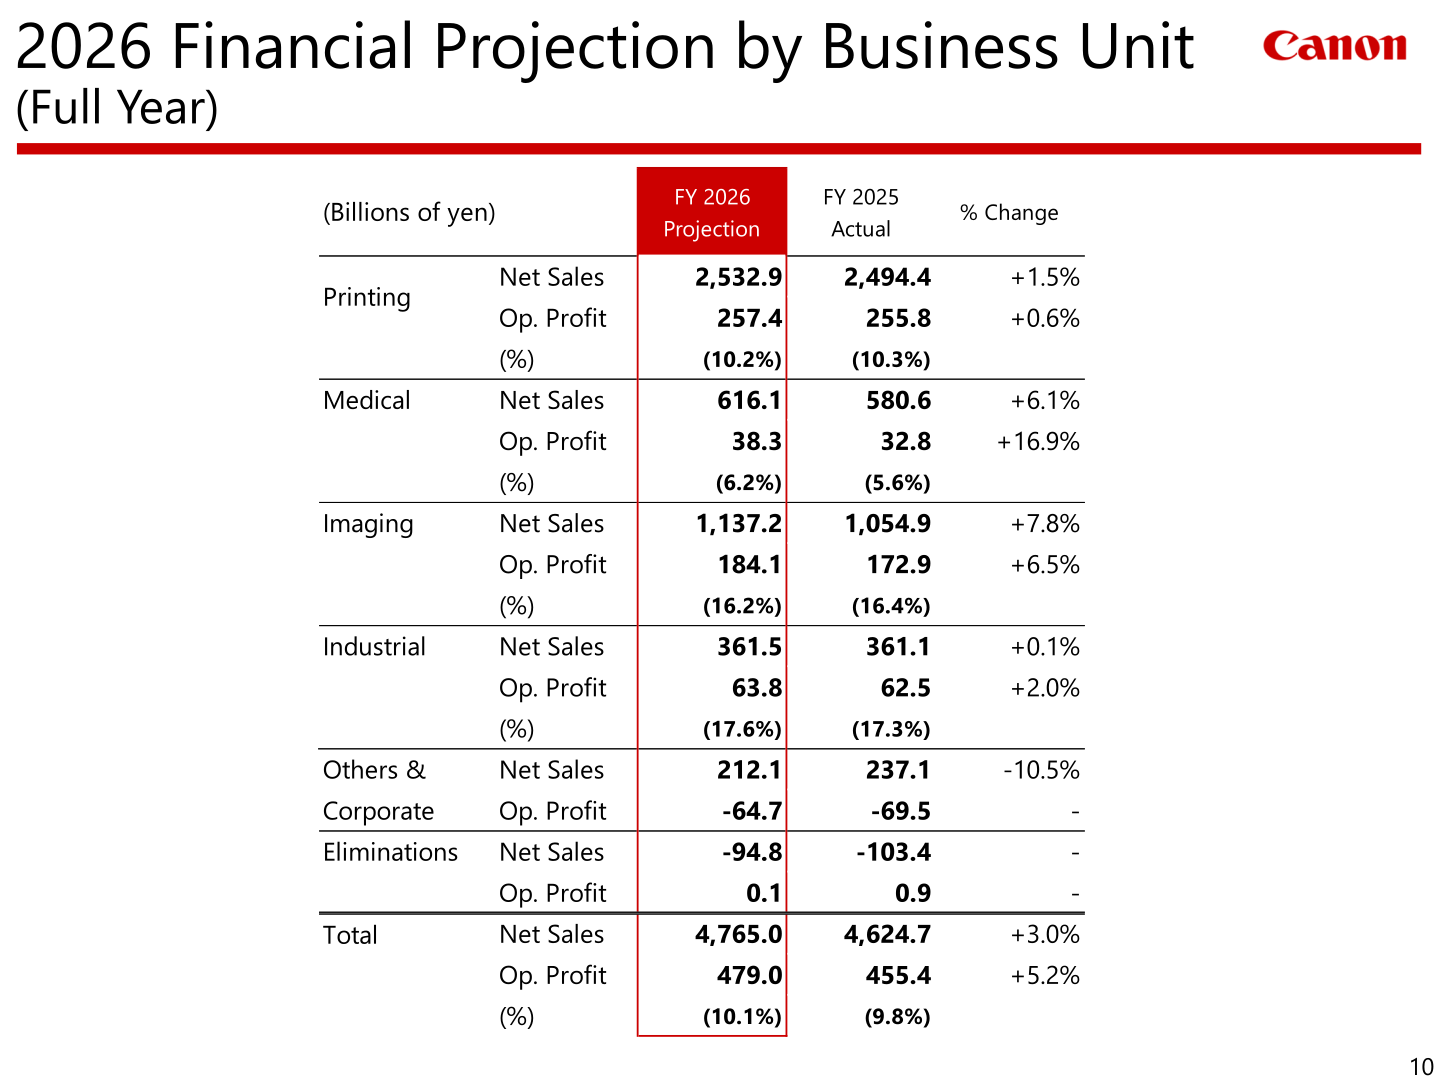
For 2026, Canon expects political and economic uncertainty to continue due to additional U.S. tariffs and geopolitical risks. It aims not only to expand sales in the growth areas of Medical, network cameras and commercial printing, but also to raise market share in office MFDs, inkjet and cameras, and to achieve an operating profit ratio of over 10% by expanding sales and from the benefits of structural reforms. The projection assumes 150.00 yen to the U.S. dollar and 175.00 yen to the euro. Canon indicates that a one-yen change in the annual rate moves net sales by 12.9 billion yen and operating profit by 3.2 billion yen for the U.S. dollar, and net sales by 6.7 billion yen and operating profit by 3.4 billion yen for the euro. The operating profit bridge from FY 2025 actual to the FY 2026 projection consists of FX of +18.0 billion yen, sales volume/product mix of +53.6 billion yen, pricing of -5.6 billion yen, cost of -2.7 billion yen, operating expenses of -32.4 billion yen and a tariff impact of -7.3 billion yen, for an increase of 23.6 billion yen (+5.2%).
| Item (Billions of yen) | FY 2026 Projection | FY 2025 Actual | % Change |
|---|---|---|---|
| Net Sales | 4,765.0 | 4,624.7 | +3.0% |
| Gross Profit | 2,239.0 | 2,162.0 | +3.6% |
| (% of Net Sales) | 47.0% | 46.7% | – |
| Op. Expenses | 1,760.0 | 1,706.6 | – |
| (% of Net Sales) | 36.9% | 36.9% | – |
| Op. Profit | 479.0 | 455.4 | +5.2% |
| (% of Net Sales) | 10.1% | 9.8% | – |
| IBT | 495.0 | 482.1 | +2.7% |
| Net Income | 341.0 | 332.1 | +2.7% |
| (% of Net Sales) | 7.2% | 7.2% | – |
| Exchange rate: USD (yen) | 150.00 | 149.71 | – |
| Exchange rate: EUR (yen) | 175.00 | 169.41 | – |
| Business Unit (Billions of yen) | Metric | FY 2026 Projection | FY 2025 Actual | % Change |
|---|---|---|---|---|
| Printing | Net Sales | 2,532.9 | 2,494.4 | +1.5% |
| Printing | Op. Profit | 257.4 | 255.8 | +0.6% |
| Printing | (Op. Profit %) | (10.2%) | (10.3%) | – |
| Medical | Net Sales | 616.1 | 580.6 | +6.1% |
| Medical | Op. Profit | 38.3 | 32.8 | +16.9% |
| Medical | (Op. Profit %) | (6.2%) | (5.6%) | – |
| Imaging | Net Sales | 1,137.2 | 1,054.9 | +7.8% |
| Imaging | Op. Profit | 184.1 | 172.9 | +6.5% |
| Imaging | (Op. Profit %) | (16.2%) | (16.4%) | – |
| Industrial | Net Sales | 361.5 | 361.1 | +0.1% |
| Industrial | Op. Profit | 63.8 | 62.5 | +2.0% |
| Industrial | (Op. Profit %) | (17.6%) | (17.3%) | – |
| Others & Corporate | Net Sales | 212.1 | 237.1 | -10.5% |
| Others & Corporate | Op. Profit | -64.7 | -69.5 | – |
| Eliminations | Net Sales | -94.8 | -103.4 | – |
| Eliminations | Op. Profit | 0.1 | 0.9 | – |
| Total | Net Sales | 4,765.0 | 4,624.7 | +3.0% |
| Total | Op. Profit | 479.0 | 455.4 | +5.2% |
| Total | (Op. Profit %) | (10.1%) | (9.8%) | – |
Financial Situation
Inventories stood at 840.4 billion yen at the end of December 2025, equivalent to 63 days, against 841.8 billion yen and 65 days a year earlier; Canon says it reduced inventory turnover by 2 days compared with the end of last year through inventory reduction activities and is aiming for an optimal level of less than 60 days by the end of 2026. By business unit, year-end inventories were 342.1 billion yen (49 days) for Printing, 142.4 billion yen (86 days) for Medical, 170.3 billion yen (53 days) for Imaging, 130.0 billion yen (118 days) for Industrial and 55.6 billion yen for Others & Corporate. Net cash provided by operating activities was 475.9 billion yen in FY 2025, capital expenditure was 262.2 billion yen and free cash flow was 238.5 billion yen. For 2026 Canon plans to generate 600 billion yen in operating cash flow and to invest in future growth while maintaining active shareholder returns.
| Cash Flow (Billions of yen) | FY 2026 Projection | FY 2025 Actual | FY 2024 Actual |
|---|---|---|---|
| Net income | 341.0 | 332.1 | 325.1 |
| Depreciation and amortization | 230.0 | 239.2 | 235.5 |
| Others | 29.0 | -95.4 | 46.2 |
| Net cash provided by operating activities | 600.0 | 475.9 | 606.8 |
| Capital expenditure | -270.0 | -262.2 | -237.0 |
| Others | -90.0 | 24.8 | -60.3 |
| Net cash used in investing activities | -360.0 | -237.4 | -297.3 |
| Free cash flow | 240.0 | 238.5 | 309.5 |
| Net cash provided by (used in) financing activities | -309.0 | -179.2 | -226.0 |
| Effect of exchange rate changes on cash and cash equivalents | -13.0 | 25.1 | 16.7 |
| Net change in cash and cash equivalents | -82.0 | 84.4 | 100.2 |
| Cash and cash equivalents at end of period | 504.0 | 586.0 | 501.6 |
| Cash-on-hand (in months of net sales) | 1.3 | 1.4 | 1.3 |
Shareholder Returns
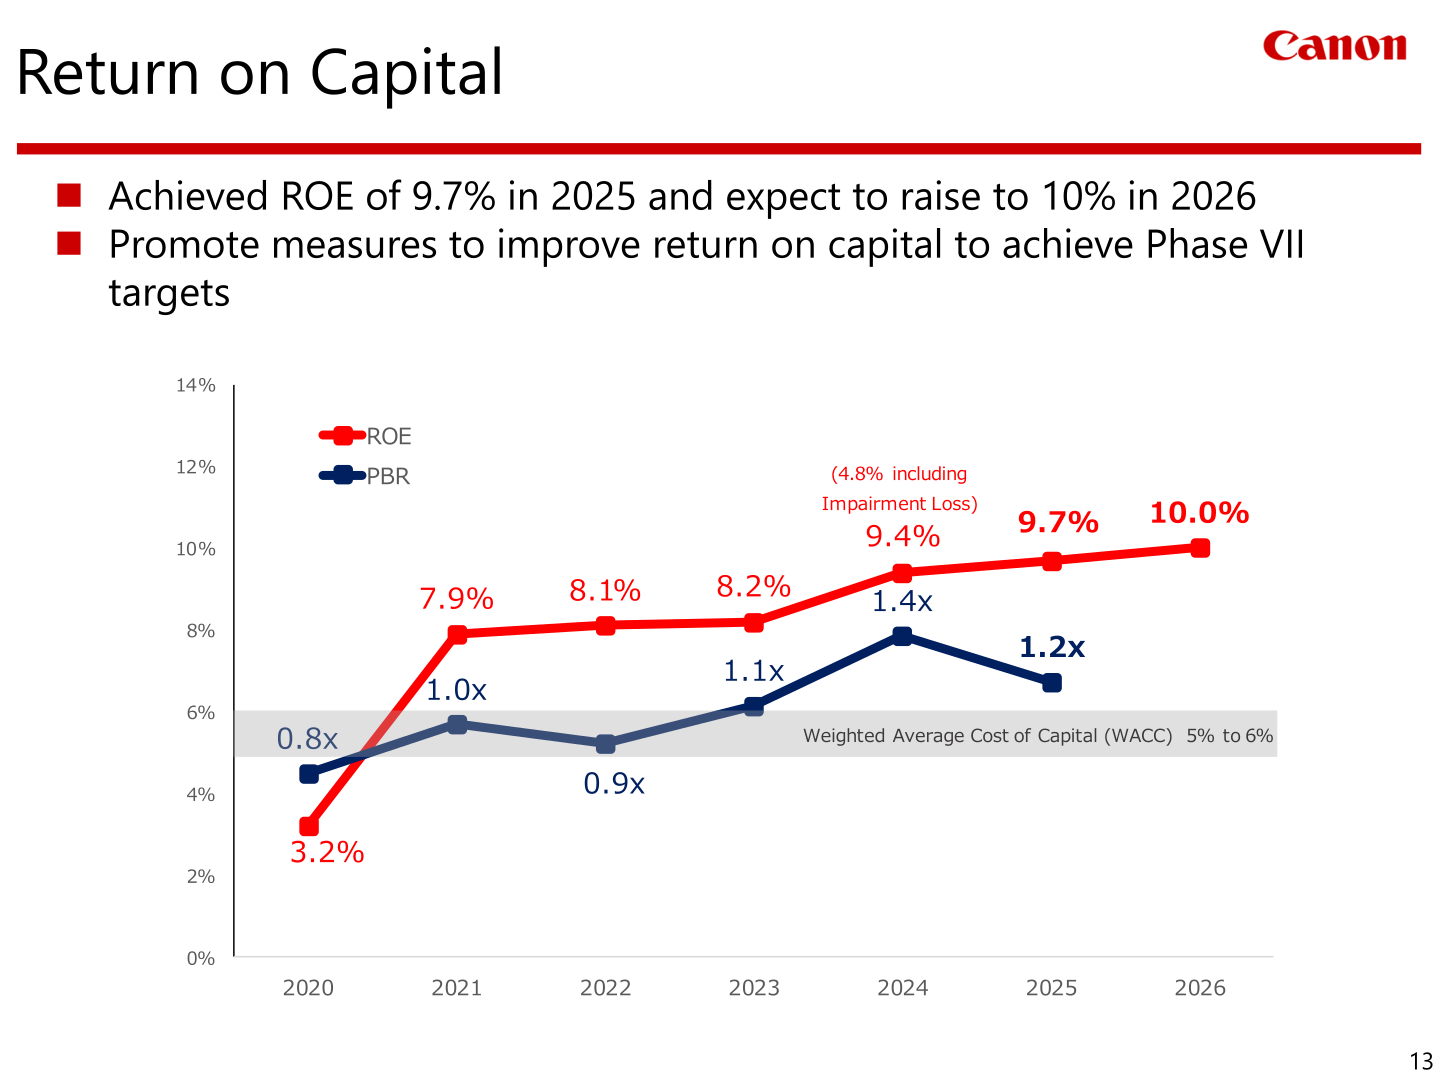
For FY 2025 Canon paid a dividend of 160 yen per share, according to plan. For 2026 the company sets the dividend at 160 yen per share, the same as last year, and establishes a framework for 200 billion yen of share buybacks. On capital efficiency, Canon states it achieved ROE of 9.7% in 2025 and expects to raise it to 10% in 2026, against a weighted average cost of capital (WACC) of 5% to 6%; ROE was 9.4% in 2024 excluding the impairment loss (4.8% including it). PBR is shown at 1.2x for 2025 after 1.4x for 2024. Canon says it will promote measures to improve return on capital in order to achieve its Phase VII targets.
Medium-Term Plan / Topics
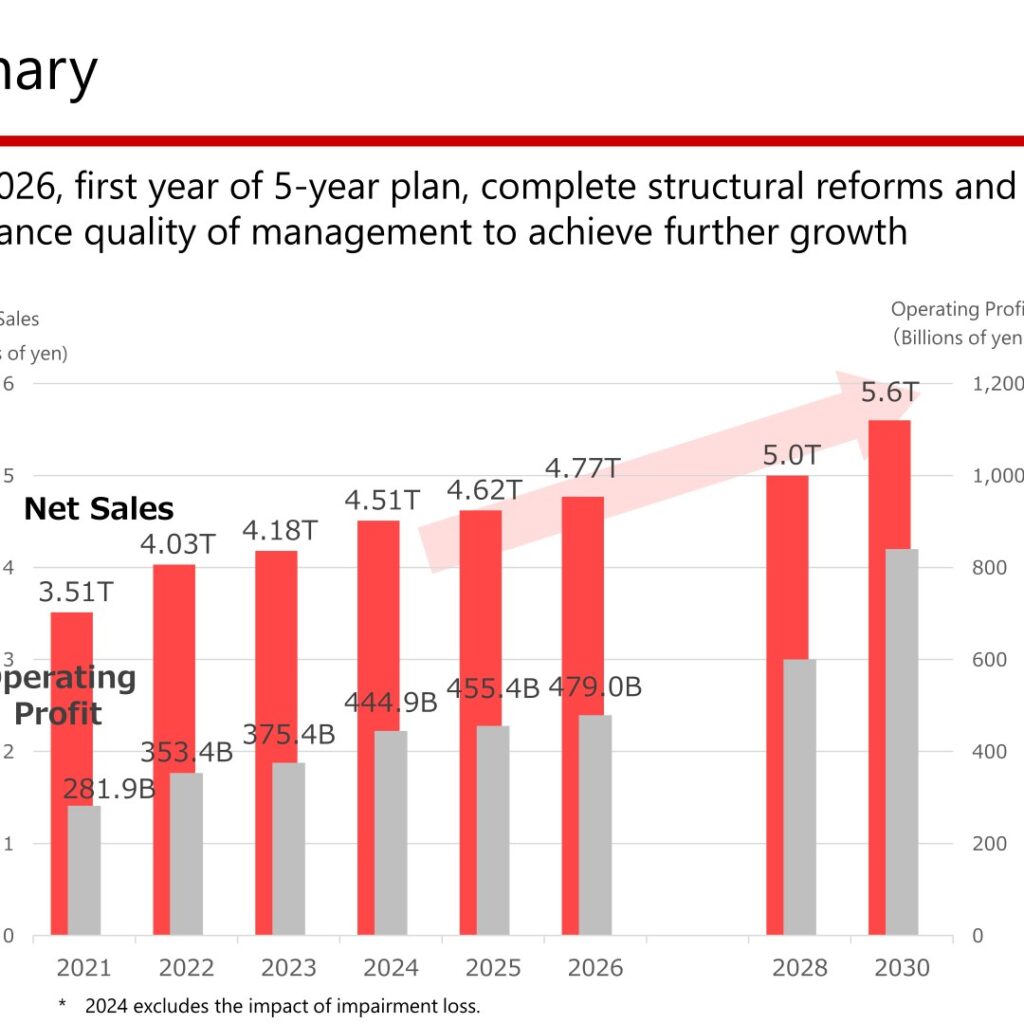
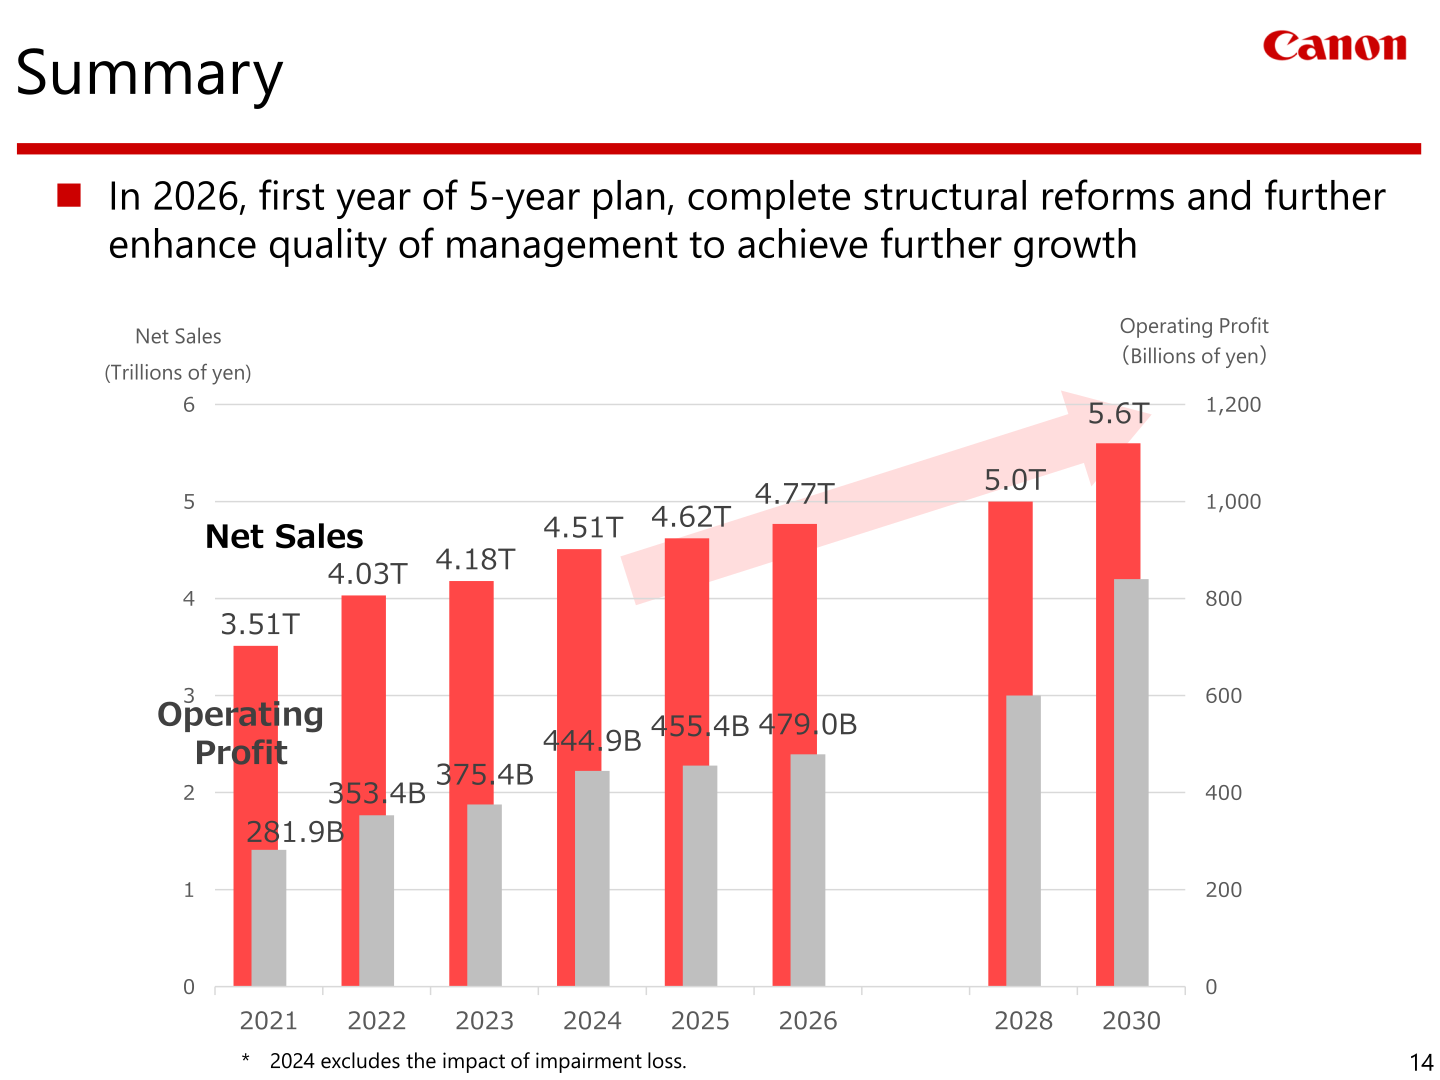
Canon presents 2026 as the first year of a five-year plan, in which it intends to complete structural reforms and further enhance the quality of management to achieve further growth. The company’s summary chart shows net sales of 3.51T in 2021, 4.03T in 2022, 4.18T in 2023, 4.51T in 2024, 4.62T in 2025 and 4.77T projected for 2026, extending to 5.0T in 2028 and 5.6T in 2030; operating profit is shown at 281.9B in 2021, 353.4B in 2022, 375.4B in 2023, 444.9B in 2024, 455.4B in 2025 and 479.0B for 2026 (2024 excludes the impact of the impairment loss).
On the review of business structure, Canon discloses that in FY 2025 sales structural reforms carried a cost of -7.9 billion yen against an effect of 22.0 billion yen, for a P&L impact of +14.1 billion yen; production structural reforms carried a cost of -14.7 billion yen with no effect recognised yet, for a P&L impact of -14.7 billion yen; and Medical business innovation carried a cost of -3.6 billion yen against an effect of 11.5 billion yen, for a P&L impact of +7.9 billion yen. In total, FY 2025 costs of -26.2 billion yen and effects of 33.5 billion yen produced a P&L impact of +7.3 billion yen, versus -14.5 billion yen in 2024. For 2026 Canon projects total costs of -32.6 billion yen, effects of 34.5 billion yen and a P&L impact of +1.9 billion yen.
This article is an analysis based on publicly available information and is not a recommendation to buy or sell any specific securities. Investment decisions are your own responsibility.
![[Obayashi] Investors’ Guide 2026 — The Complete 24-Article Breakdown](https://japan-equity.com/wp-content/uploads/2026/07/hub_cover-1024x1024.png)
![[Obayashi] IR & SR Policy — Feeding Dialogue Back into Management](https://japan-equity.com/wp-content/uploads/2026/07/p32_sq-1024x1024.jpg)
![[Obayashi] Domestic Civil Engineering — Resilience Spending Supports 9.6% Margin](https://japan-equity.com/wp-content/uploads/2026/07/p11_sq-1024x1024.jpg)
![[Obayashi] Overseas Construction — Orders Reach ¥1.2tn](https://japan-equity.com/wp-content/uploads/2026/07/p15_sq-1024x1024.jpg)
![[Obayashi] Share Price & External Ratings — vs TOPIX, ESG Index Inclusion](https://japan-equity.com/wp-content/uploads/2026/07/p40_sq-1024x1024.jpg)
![[Construction] ¥75.5tn Investment, Shrinking Workforce — Big-5 Market Share](https://japan-equity.com/wp-content/uploads/2026/07/p12_sq-1024x1024.jpg)



![[Obayashi] Capital Policy & Shareholder Returns — ROE 10%+, DOE ~5%, ¥100bn Buyback](https://japan-equity.com/wp-content/uploads/2026/07/p27_sq-1024x1024.jpg)
![[Obayashi] Reducing Cross-Shareholdings — ¥285.2bn Sold in Five Years](https://japan-equity.com/wp-content/uploads/2026/07/p29_sq-1024x1024.jpg)
![[Obayashi] ¥750bn Investment Plan — ¥300bn to Development, ¥190bn to Tech/DX](https://japan-equity.com/wp-content/uploads/2026/07/p30_sq-1024x1024.jpg)
![[Obayashi] MTP2022 KPIs — Operating Profit ~2x Target, ROE 14.4%](https://japan-equity.com/wp-content/uploads/2026/07/p25_sq-1024x1024.jpg)
![[Obayashi] Cash Allocation — ¥420bn Investment CF Over Five Years](https://japan-equity.com/wp-content/uploads/2026/07/p26_sq-1024x1024.jpg)
![[Obayashi] Green Energy — 44 Plants, 344MW, and the Green Hydrogen Challenge](https://japan-equity.com/wp-content/uploads/2026/07/p21_sq-1024x1024.jpg)
![[Obayashi] Tackling the Labor Shortage — Robotics Construction®](https://japan-equity.com/wp-content/uploads/2026/07/p14_sq-1024x1024.jpg)
