
This article is based on publicly available IR materials and is not a recommendation to buy or sell any specific securities.
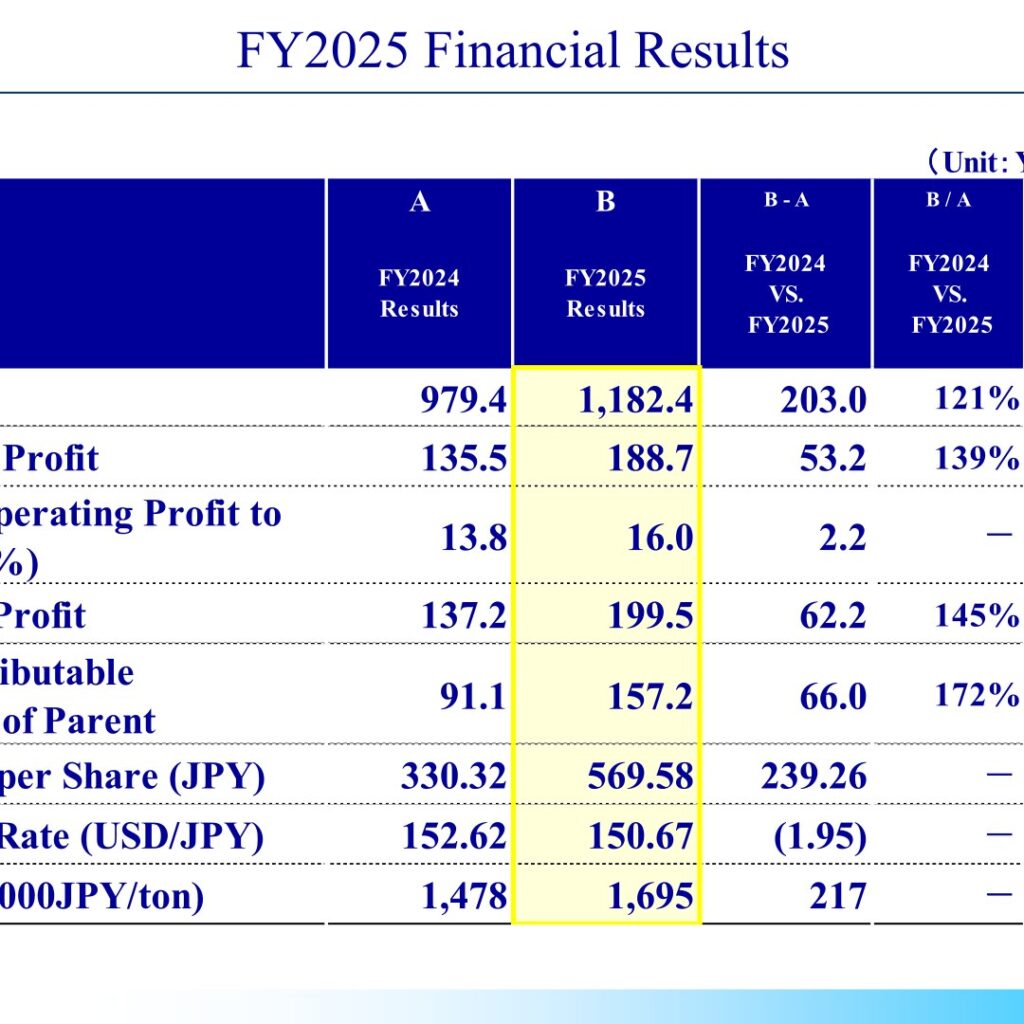
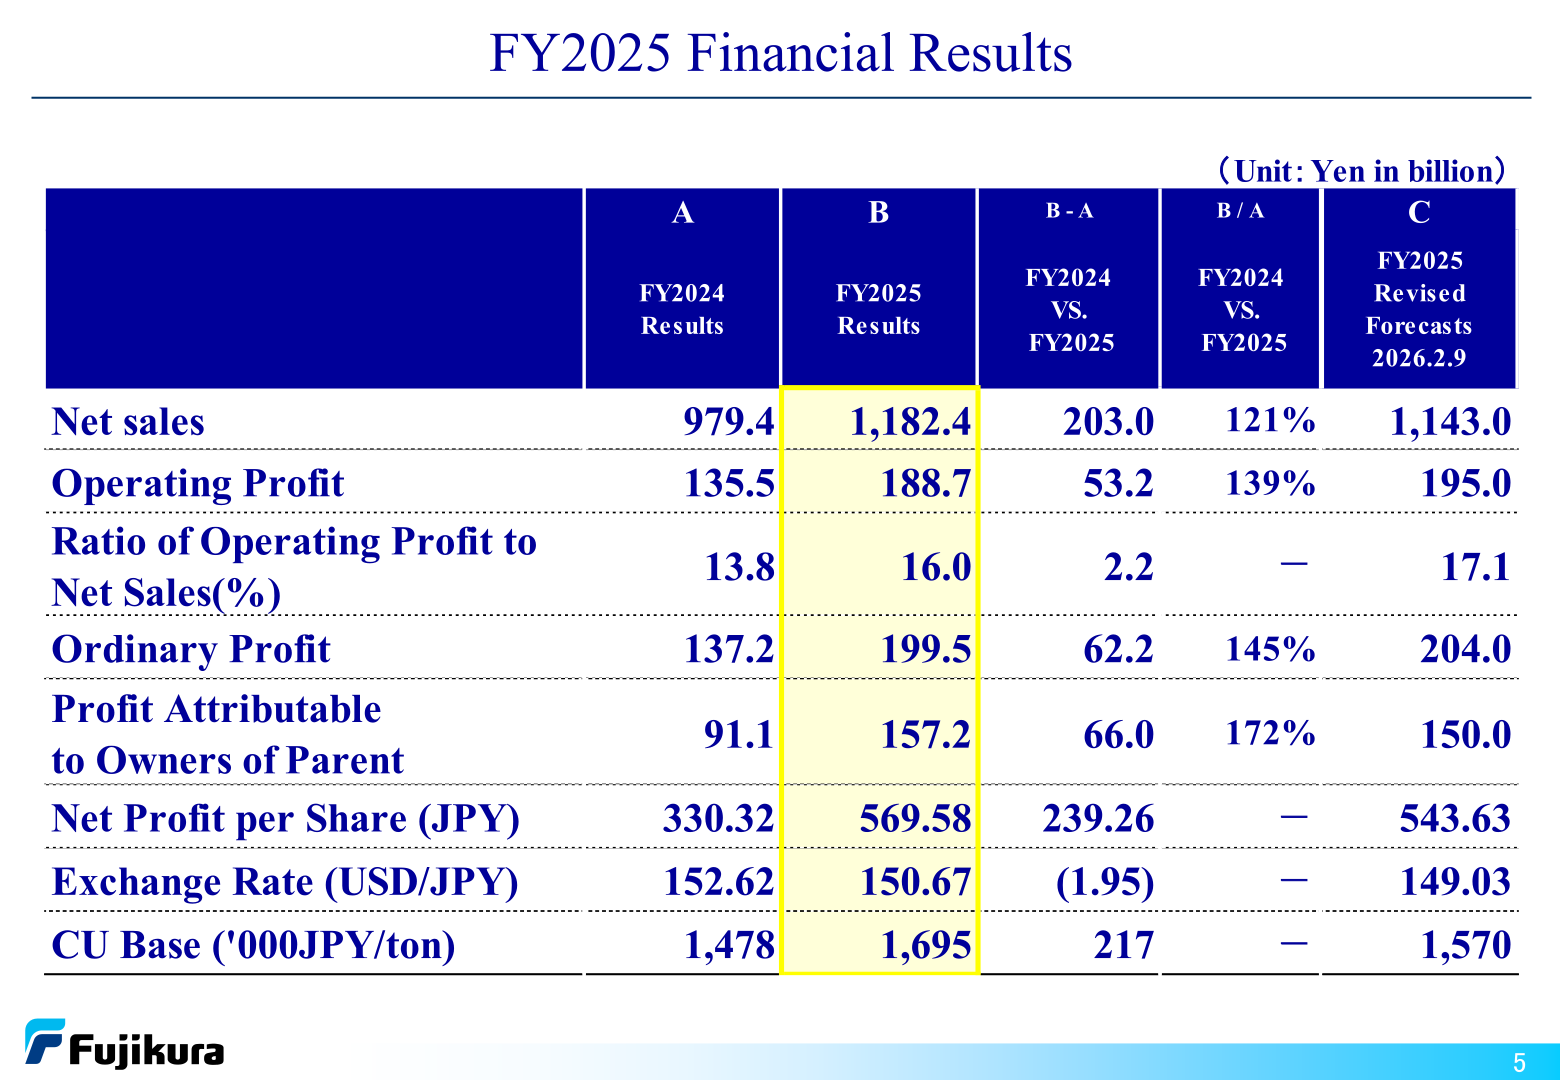
Fujikura Ltd. (5803) reported FY2025 (the fiscal year ended March 31, 2026) net sales of 1,182.4 billion yen and operating profit of 188.7 billion yen, 203.0 billion yen and 53.2 billion yen higher than FY2024 respectively, at 121% and 139% of the prior year. Ordinary profit was 199.5 billion yen (145%) and profit attributable to owners of parent was 157.2 billion yen (172%). Net sales and operating profit reached record highs for the second consecutive fiscal year, ordinary profit for the fourth and net profit for the fifth. Operating and ordinary profit came in below the forecasts revised on February 9, 2026, mainly due to 12.8 billion yen of provision recorded at a U.S. subsidiary of the Company relating to potential additional tariffs arising from differences with CBP. For FY2026 the Company forecasts net sales of 1,243.0 billion yen and operating profit of 211.0 billion yen.
Consolidated Results (FY2025 Actual)
By segment, Telecommunication Systems, Automotive Products and Power Systems achieved record-high profits. In Telecommunication Systems, net sales and operating profit increased due to demand for data centers continued to grow, on the back of the spread and expansion of generative AI; operating profit was 1.7 times higher than the previous year. In Electronics, net sales and operating profit decreased due to the downstream supply chain faced issues, in addition to intense competition, and higher costs due to the stronger THB. In Automotive Products, while rising copper prices could not be passed on to selling prices during the period, net sales and operating profit increased due to reflection temporary inflationary pressures and other factors on selling prices. In Power Systems, net sales and operating profit increased due to higher shipments of high margin products, improved selling prices, and derivative valuation gains resulting from higher copper prices; operating profit was 1.6 times higher than the previous year.
| Item (Yen in billion unless stated) | FY2025 Results | FY2024 Results | Change (B – A) | Change (B / A) | FY2025 Revised Forecasts 2026.2.9 |
|---|---|---|---|---|---|
| Net sales | 1,182.4 | 979.4 | 203.0 | 121% | 1,143.0 |
| Operating Profit | 188.7 | 135.5 | 53.2 | 139% | 195.0 |
| Ratio of Operating Profit to Net Sales (%) | 16.0 | 13.8 | 2.2 | - | 17.1 |
| Ordinary Profit | 199.5 | 137.2 | 62.2 | 145% | 204.0 |
| Profit Attributable to Owners of Parent | 157.2 | 91.1 | 66.0 | 172% | 150.0 |
| Net Profit per Share (JPY) | 569.58 | 330.32 | 239.26 | - | 543.63 |
| Exchange Rate (USD/JPY) | 150.67 | 152.62 | (1.95) | - | 149.03 |
| CU Base (‘000JPY/ton) | 1,695 | 1,478 | 217 | - | 1,570 |
Of the 203.0 billion yen increase in net sales, the actual value accounted for +196.8 billion yen, the effect of copper prices +11.1 billion yen and the effect of forex (4.9) billion yen. By segment, the actual value was Telecommunication Systems 208.3, Electronics (12.1), Automotive Products (0.9), Power Systems 0.7 and Others 0.8, for a total of 196.8. For operating profit, market environment factors were (19.9) billion yen and actual factors +73.0 billion yen; the market environment items were effect of forex (4.7), effect of copper prices +1.9, U.S. tariffs (3.1), effect of impairment +0.7 and COO tariffs (14.7). Within actual factors, the increase in marginal profit due to increase in sales was +76.2, fixed cost fluctuation (24.1), rising raw material prices (5.8), cost reduction +3.6, price pass-through +6.5 and profitability improvement +16.7. By segment, the actual value was Telecommunication Systems 81.0, Electronics (13.6), Automotive Products 0.7, Power Systems 5.1 and Others (0.1), for a total of 73.0.
On the tariffs provision, the Company explains that at its U.S. subsidiary, differences with CBP have arisen regarding the country-of-origin classification of certain component products using China-origin optical fibers, and that in response a provision of 12.8 billion yen has been recorded to cover potential additional tariffs on a retrospective basis. Going forward, the Company will file an objection with CBP based on advice from external experts and continue discussions regarding the tariffs assessment, and in parallel, from FY2026 onward, will proceed with price negotiations with customers to mitigate the impact.
Below operating profit, share of profit of entities accounted for using equity method was 12.0 billion yen (FY2024: 5.7). Extraordinary income was 8.6 billion yen (FY2024: 3.0), which the Company attributes to gain on sale of shares of subsidiaries and associates etc., and extraordinary losses were 3.5 billion yen (FY2024: 18.9). Profit before income taxes was 204.6 billion yen and total income taxes 42.6 billion yen; the Company notes that the effective tax rate was low at 21%, due to tax benefits from subsidiary liquidations. Profit attributable to non-controlling interests was 4.9 billion yen.
Balance Sheet and Financial Position
Total assets stood at 969.5 billion yen as of March 31, 2026, up 139.1 billion yen from a year earlier, with current assets of 657.6 billion yen and non-current assets of 311.9 billion yen. Notes and accounts receivable and contract assets rose 49.1 billion yen to 252.6 billion yen and inventories rose 36.6 billion yen to 183.8 billion yen. Liabilities decreased 18.7 billion yen to 376.3 billion yen as interest-bearing debt fell 62.2 billion yen to 85.0 billion yen, reflecting repayment of subordinated loans of 40.0 billion yen; net cash improved from 37.9 billion yen to 96.2 billion yen, an increase of 58.4 billion yen. Net assets increased 157.9 billion yen to 593.2 billion yen and the equity-to-assets ratio improved 8.7 points to 57.8%. For the cash conversion cycle, the FY2025 mid-term target was 92 days against an FY2025 result of 94 days, which the Company describes as generally achieved.
Segment Results
Telecommunication Systems drove the year, with net sales of 653.0 billion yen (FY2024: 451.3) and operating profit of 152.7 billion yen (FY2024: 92.2), lifting the segment operating margin to 23.4% from 20.4%. Electronics saw net sales fall to 172.3 billion yen and operating profit to 7.7 billion yen, a margin of 4.4% against 12.3% a year earlier. Automotive Products posted net sales of 179.4 billion yen and operating profit of 6.8 billion yen (margin 3.8%), and Power Systems net sales of 157.0 billion yen and operating profit of 18.9 billion yen (margin 12.1%). Real Estate recorded net sales of 11.0 billion yen and operating profit of 5.0 billion yen, with revenues from leasing real estate properties continuing to contribute to consolidated operating profit.
| Segment (Yen in billion) | Net sales FY2025 | Net sales FY2024 | Net sales FY2026 Forecasts | Operating profit FY2025 (margin) | Operating profit FY2024 (margin) | Operating profit FY2026 Forecasts (margin) |
|---|---|---|---|---|---|---|
| Telecommunication Systems | 653.0 | 451.3 | 719.4 | 152.7 (23.4%) | 92.2 (20.4%) | 185.4 (25.8%) |
| Electronics | 172.3 | 185.9 | 184.5 | 7.7 (4.4%) | 22.9 (12.3%) | 9.5 (5.1%) |
| Automotive Products | 179.4 | 177.1 | 170.8 | 6.8 (3.8%) | 5.8 (3.3%) | 5.6 (3.3%) |
| Power Systems | 157.0 | 145.2 | 151.7 | 18.9 (12.1%) | 11.9 (8.2%) | 10.2 (6.7%) |
| Real Estate | 11.0 | 10.8 | 11.2 | 5.0 (44.9%) | 4.9 (44.9%) | 5.0 (44.5%) |
| Other | 9.7 | 9.1 | 5.4 | (2.4) | (2.2) | (4.6) |
| Total | 1,182.4 | 979.4 | 1,243.0 | 188.7 (16.0%) | 135.5 (13.8%) | 211.0 (17.0%) |
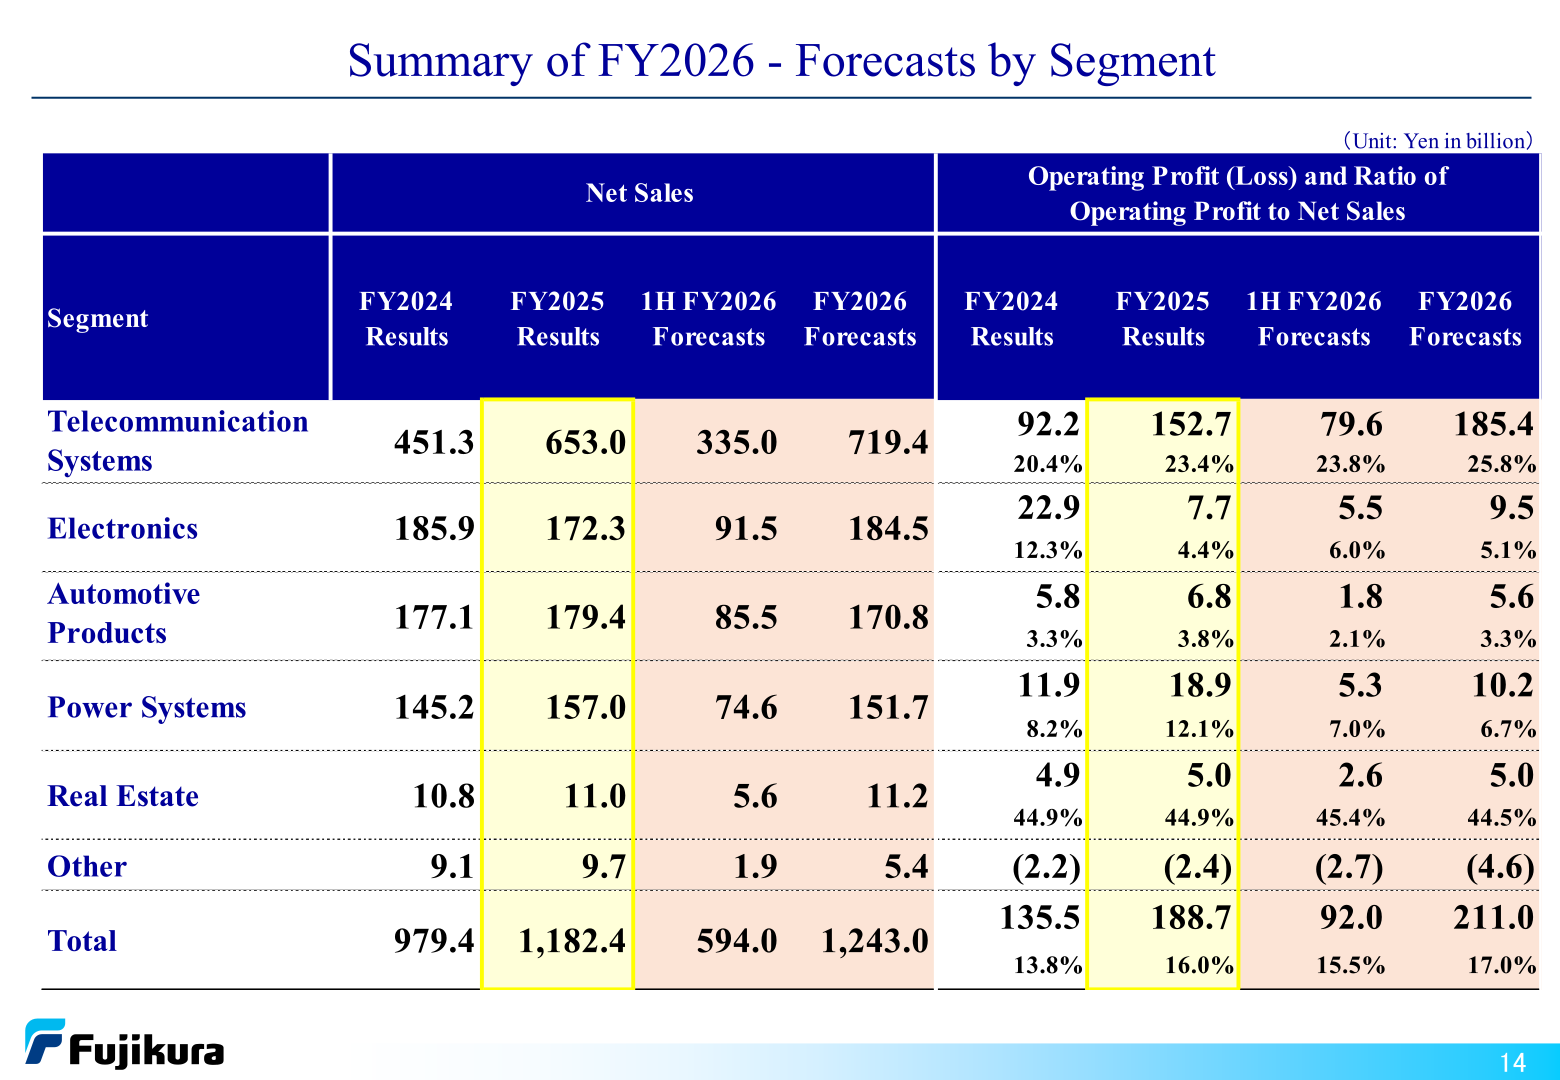
Looking into FY2026, the Company expects Telecommunication Systems net sales and operating profit to increase as it capitalizes on strong demand for data centers, while it plans a rapid increase in fiber optic cable production and conservatively factors in concerns that procurement of certain raw materials, such as hydrogen, may not keep pace. Electronics net sales and operating profit are expected to increase only slightly due to rising material costs and ongoing intense competition. In Automotive Products, net sales and operating profit are decreased compared to FY2025 due to the impact of the reflection on selling prices in FY2025, though the business remains consistently profitable and performance is expected to remain solid, supported by new product launches. Power Systems net sales and operating profit are expected to decrease because demand for large projects such as construction of factories will settle down.
FY2026 Forecast
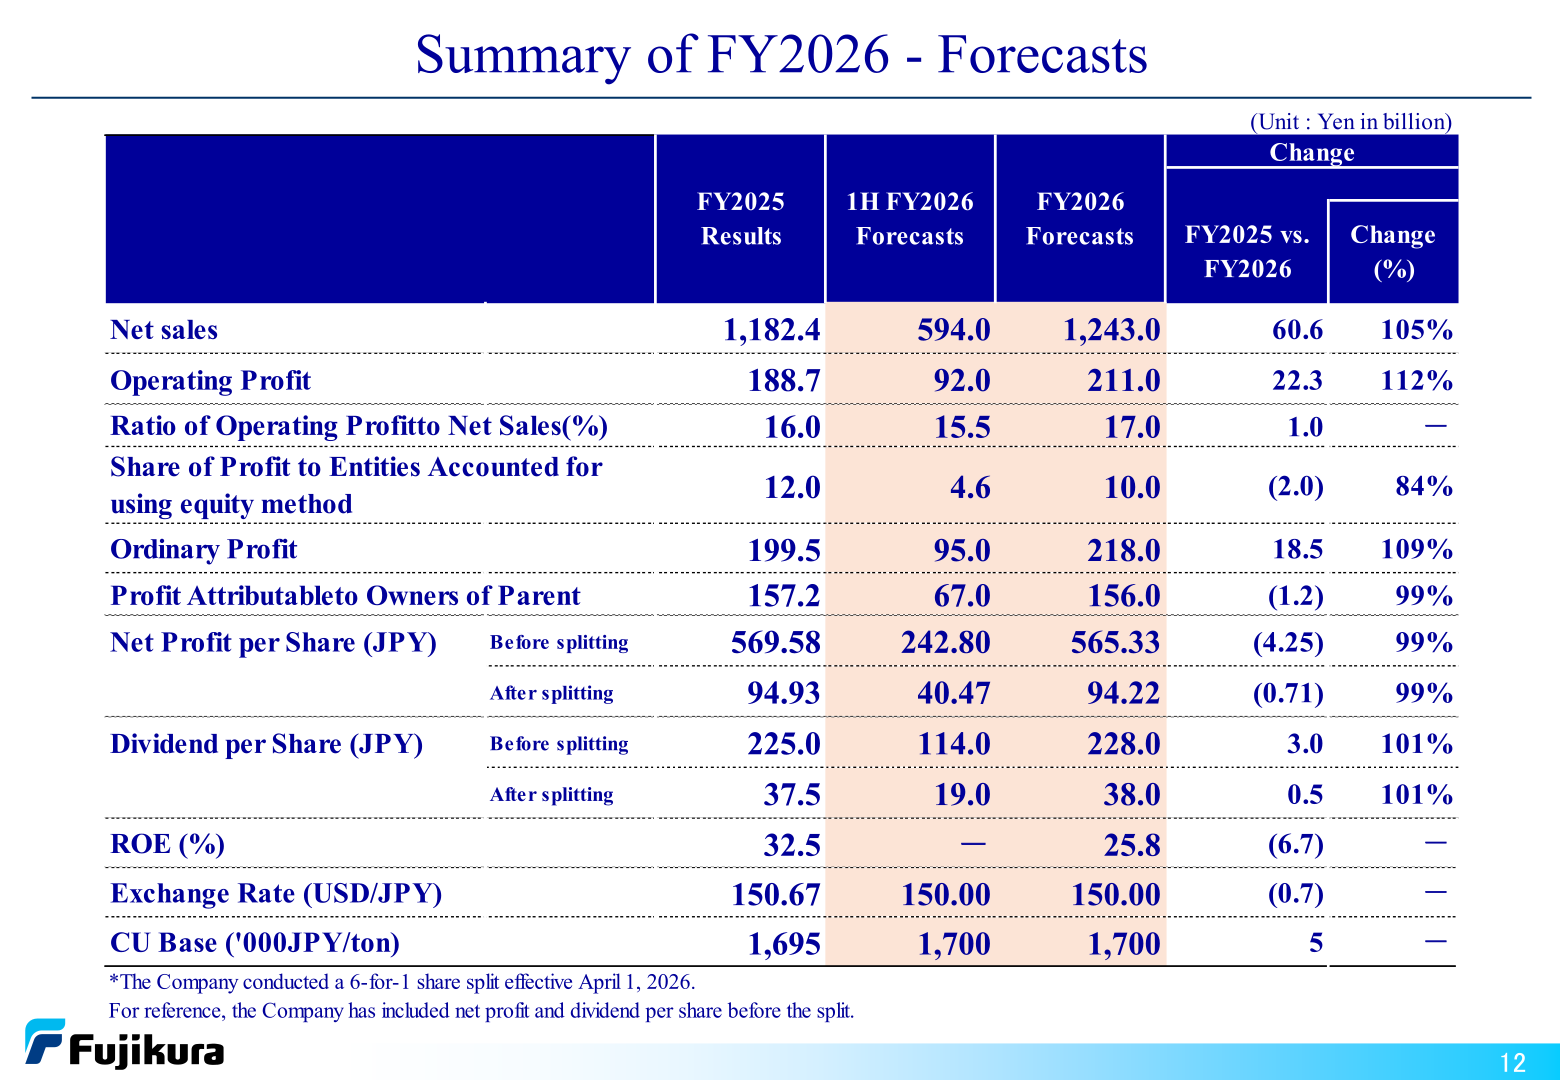
The Company expects net sales and operating profit to record highs as net sales will exceed 1.2 trillion yen and operating profit will exceed 200 billion yen. Concerns about supply chain due to stagnation in logistics caused by the blockade of the Strait of Hormuz are not factored into the business forecasts due to the high uncertainty, and the Company states it will disclose promptly if a significant impact on its performance is expected. In Telecommunication Systems, the Company expects strong performance supported by refunds of Trump tariffs and continued strong demand for data centers. The forecasts assume an exchange rate of 150.00 yen per U.S. dollar and a copper base of 1,700 thousand yen per ton.
| Item (Yen in billion unless stated) | FY2026 Forecasts | 1H FY2026 Forecasts | FY2025 Results | Change | Change (%) |
|---|---|---|---|---|---|
| Net sales | 1,243.0 | 594.0 | 1,182.4 | 60.6 | 105% |
| Operating Profit | 211.0 | 92.0 | 188.7 | 22.3 | 112% |
| Ratio of Operating Profit to Net Sales (%) | 17.0 | 15.5 | 16.0 | 1.0 | - |
| Share of Profit to Entities Accounted for using equity method | 10.0 | 4.6 | 12.0 | (2.0) | 84% |
| Ordinary Profit | 218.0 | 95.0 | 199.5 | 18.5 | 109% |
| Profit Attributable to Owners of Parent | 156.0 | 67.0 | 157.2 | (1.2) | 99% |
| Net Profit per Share (JPY), before splitting | 565.33 | 242.80 | 569.58 | (4.25) | 99% |
| Net Profit per Share (JPY), after splitting | 94.22 | 40.47 | 94.93 | (0.71) | 99% |
| ROE (%) | 25.8 | - | 32.5 | (6.7) | - |
| Exchange Rate (USD/JPY) | 150.00 | 150.00 | 150.67 | (0.7) | - |
| CU Base (‘000JPY/ton) | 1,700 | 1,700 | 1,695 | 5 | - |
Shareholder Returns
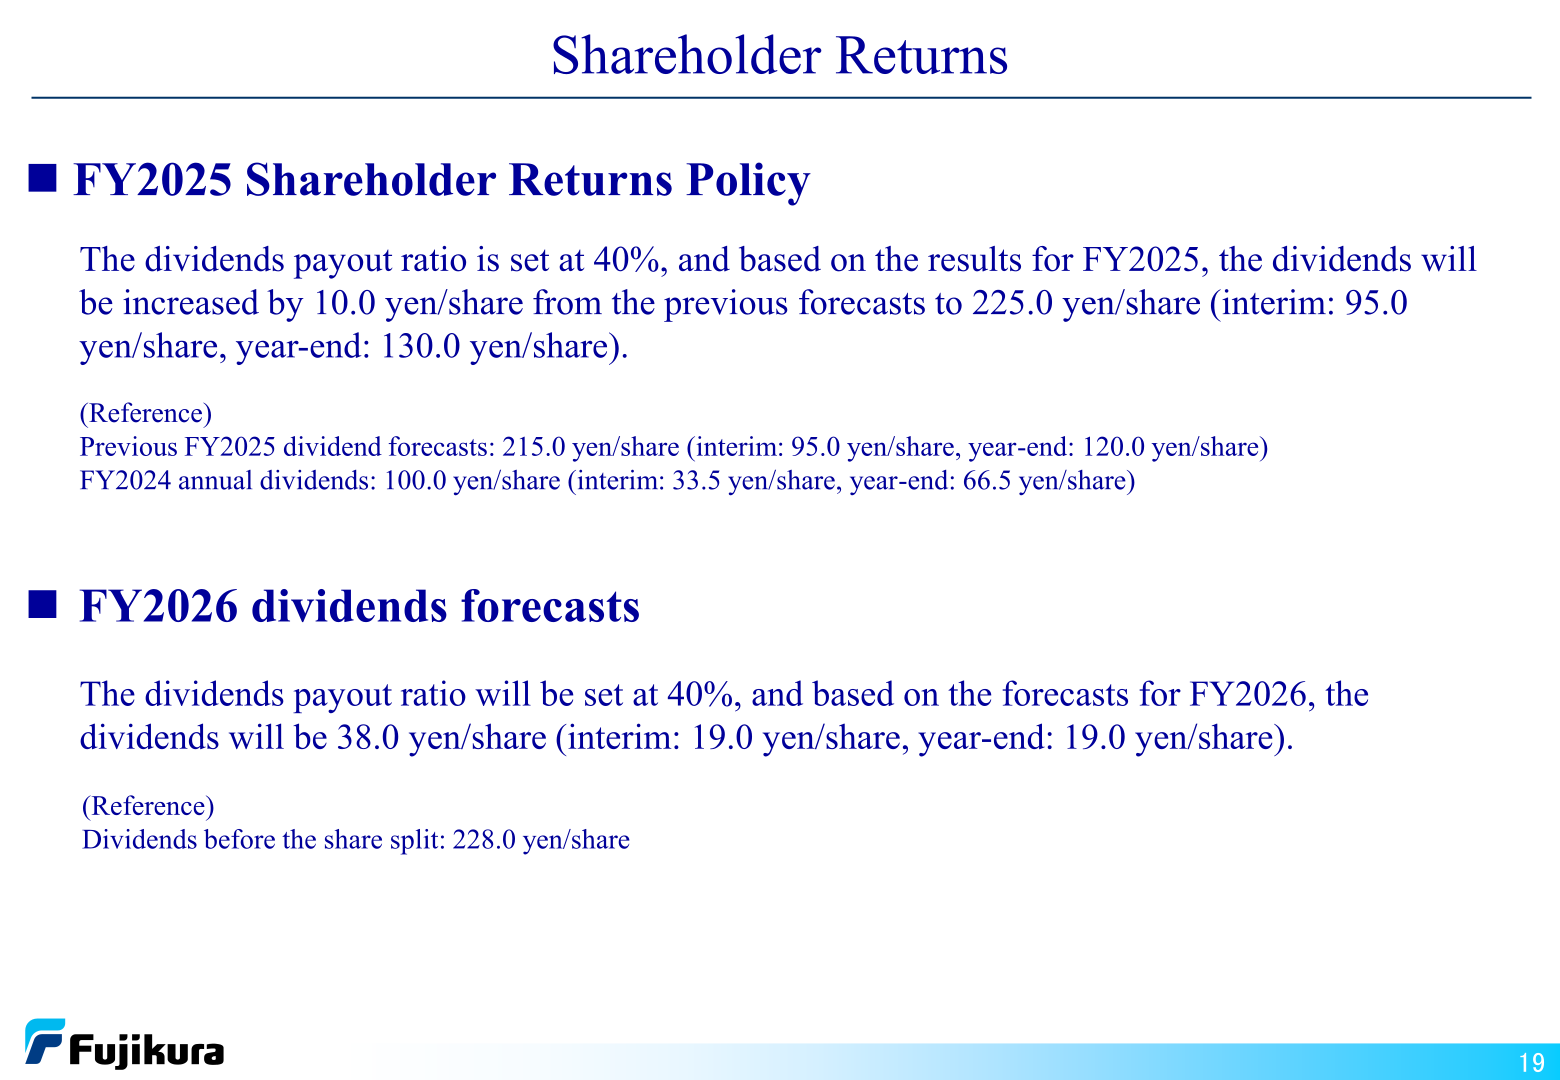
Under the FY2025 shareholder returns policy, the dividends payout ratio is set at 40%, and based on the results for FY2025, the dividends will be increased by 10.0 yen/share from the previous forecasts to 225.0 yen/share (interim: 95.0 yen/share, year-end: 130.0 yen/share). For reference, the previous FY2025 dividend forecasts were 215.0 yen/share (interim: 95.0 yen/share, year-end: 120.0 yen/share) and FY2024 annual dividends were 100.0 yen/share (interim: 33.5 yen/share, year-end: 66.5 yen/share). For FY2026 the dividends payout ratio will be set at 40%, and based on the forecasts for FY2026, the dividends will be 38.0 yen/share (interim: 19.0 yen/share, year-end: 19.0 yen/share); for reference, dividends before the share split are 228.0 yen/share. The Company conducted a 6-for-1 share split effective April 1, 2026, and has included net profit and dividend per share before the split for reference.
| Dividend per share (JPY) | FY2026 Forecasts | FY2025 Results | FY2024 Results |
|---|---|---|---|
| Annual (after the share split) | 38.0 | 37.5 | - |
| Annual (before the share split) | 228.0 | 225.0 | 100.0 |
| Interim | 19.0 (after the split) | 95.0 (before the split) | 33.5 (before the split) |
| Year-end | 19.0 (after the split) | 130.0 (before the split) | 66.5 (before the split) |
| Dividends payout ratio | 40% | 40% | - |
Medium-Term Targets and Topics
The materials disclose one mid-term financial target: for the cash conversion cycle, the FY2025 mid-term target was 92 days, against an FY2025 result of 94 days, which the Company describes as generally achieved. Other medium-term plan targets are not presented in this document. Key topics for the year were the 12.8 billion yen tariffs provision at the U.S. subsidiary and the related discussions with CBP over the country-of-origin classification of certain component products using China-origin optical fibers; the 6-for-1 share split effective April 1, 2026; the planned rapid increase in fiber optic cable production together with concerns over procurement of certain raw materials such as hydrogen; and supply chain concerns arising from stagnation in logistics caused by the blockade of the Strait of Hormuz, which are not factored into the FY2026 forecasts. The Company also notes that statements regarding the future such as the performance outlook are based on the information available on the date of the presentation and certain assumptions considered reasonable, and that actual results may differ due to various factors.
This article is an analysis based on publicly available information and is not a recommendation to buy or sell any specific securities. Investment decisions are your own responsibility.
![[Obayashi] Investors’ Guide 2026 — The Complete 24-Article Breakdown](https://japan-equity.com/wp-content/uploads/2026/07/hub_cover-1024x1024.png)
![[Obayashi] IR & SR Policy — Feeding Dialogue Back into Management](https://japan-equity.com/wp-content/uploads/2026/07/p32_sq-1024x1024.jpg)
![[Obayashi] Real Estate Development — 18.7% Margin, ¥287.7bn Unrealized Gains](https://japan-equity.com/wp-content/uploads/2026/07/p20_sq-1024x1024.jpg)
![[Obayashi] Domestic Civil Engineering — Resilience Spending Supports 9.6% Margin](https://japan-equity.com/wp-content/uploads/2026/07/p11_sq-1024x1024.jpg)
![[Obayashi] Share Price & External Ratings — vs TOPIX, ESG Index Inclusion](https://japan-equity.com/wp-content/uploads/2026/07/p40_sq-1024x1024.jpg)
![[Construction] ¥75.5tn Investment, Shrinking Workforce — Big-5 Market Share](https://japan-equity.com/wp-content/uploads/2026/07/p12_sq-1024x1024.jpg)



![[Obayashi] Capital Policy & Shareholder Returns — ROE 10%+, DOE ~5%, ¥100bn Buyback](https://japan-equity.com/wp-content/uploads/2026/07/p27_sq-1024x1024.jpg)
![[Obayashi] Reducing Cross-Shareholdings — ¥285.2bn Sold in Five Years](https://japan-equity.com/wp-content/uploads/2026/07/p29_sq-1024x1024.jpg)
![[Obayashi] ¥750bn Investment Plan — ¥300bn to Development, ¥190bn to Tech/DX](https://japan-equity.com/wp-content/uploads/2026/07/p30_sq-1024x1024.jpg)
![[Obayashi] MTP2022 KPIs — Operating Profit ~2x Target, ROE 14.4%](https://japan-equity.com/wp-content/uploads/2026/07/p25_sq-1024x1024.jpg)
![[Obayashi] Cash Allocation — ¥420bn Investment CF Over Five Years](https://japan-equity.com/wp-content/uploads/2026/07/p26_sq-1024x1024.jpg)
![[Obayashi] Green Energy — 44 Plants, 344MW, and the Green Hydrogen Challenge](https://japan-equity.com/wp-content/uploads/2026/07/p21_sq-1024x1024.jpg)
![[Obayashi] Tackling the Labor Shortage — Robotics Construction®](https://japan-equity.com/wp-content/uploads/2026/07/p14_sq-1024x1024.jpg)
