
This article is based on publicly available IR materials and is not a recommendation to buy or sell any specific securities.
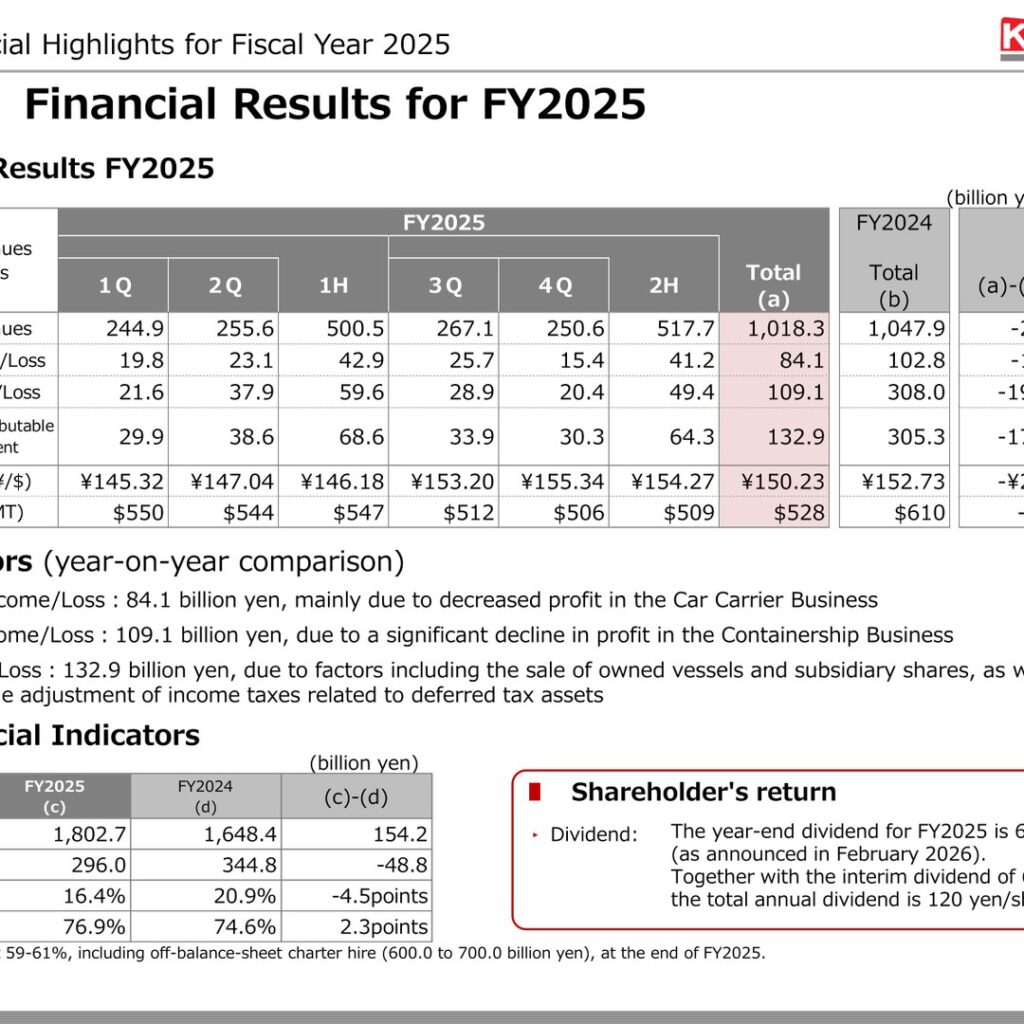
Kawasaki Kisen Kaisha, Ltd. (‘K’ Line) reported consolidated financial results for the fiscal year the company’s materials label FY2025 (fiscal year ended March 2026). Operating revenues were 1,018.3 billion yen, down from 1,047.9 billion yen in FY2024. Operating income declined to 84.1 billion yen (FY2024: 102.8 billion yen), mainly due to decreased profit in the Car Carrier Business. Ordinary income fell sharply to 109.1 billion yen (FY2024: 308.0 billion yen), due to a significant decline in profit in the Containership Business, while net income attributable to owners of parent was 132.9 billion yen (FY2024: 305.3 billion yen), reflecting factors including the sale of owned vessels and subsidiary shares, as well as a revision to the adjustment of income taxes related to deferred tax assets.
Consolidated Results (Full-Year Actual)
The full-year average exchange rate for FY2025 was ¥150.23/$ (FY2024: ¥152.73/$) and the average bunker price was $528/MT (FY2024: $610/MT). Equity capital rose to 1,802.7 billion yen (FY2024: 1,648.4 billion yen), while interest-bearing liabilities decreased to 296.0 billion yen (FY2024: 344.8 billion yen). DER improved to 16.4% (FY2024: 20.9%) and the equity ratio rose to 76.9% (FY2024: 74.6%); including off-balance-sheet charter hire (600.0 to 700.0 billion yen), the equity ratio stood at 59-61% at the end of FY2025.
| Item | FY2025 | FY2024 | Change |
|---|---|---|---|
| Operating Revenues | 1,018.3 billion yen | 1,047.9 billion yen | -29.5 billion yen |
| Operating Income/Loss | 84.1 billion yen | 102.8 billion yen | -18.6 billion yen |
| Ordinary Income/Loss | 109.1 billion yen | 308.0 billion yen | -198.9 billion yen |
| Net Income/Loss Attributable to Owners of Parent | 132.9 billion yen | 305.3 billion yen | -172.3 billion yen |
| Exchange Rate (¥/$) | ¥150.23 | ¥152.73 | -¥2.50 |
| Bunker Price ($/MT) | $528 | $610 | -$82 |
| Equity Capital | 1,802.7 billion yen | 1,648.4 billion yen | 154.2 billion yen |
| Interest-Bearing Liability | 296.0 billion yen | 344.8 billion yen | -48.8 billion yen |
| DER | 16.4% | 20.9% | -4.5 points |
| Equity Ratio | 76.9% | 74.6% | 2.3 points |
Segment Results
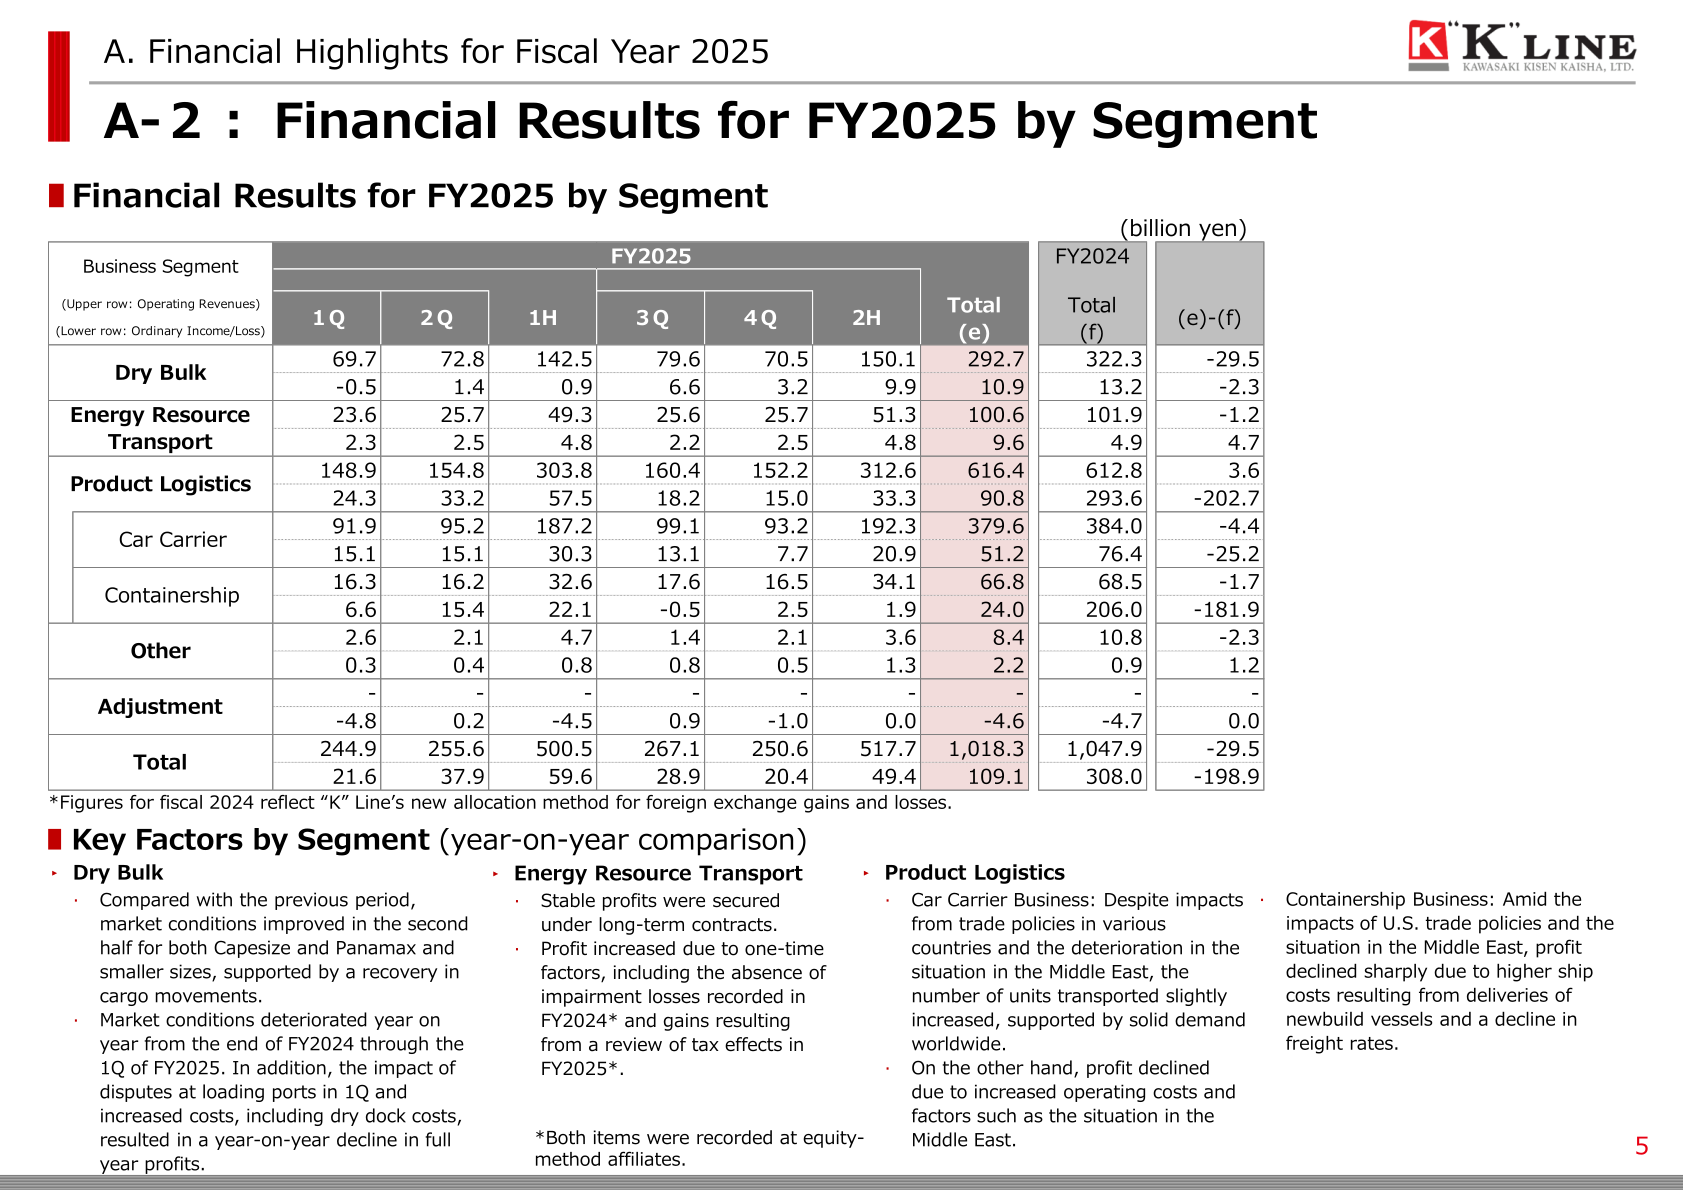
By segment, Dry Bulk ordinary income declined year on year as market conditions deteriorated from the end of FY2024 through the first quarter of FY2025, with disputes at loading ports in the first quarter and increased costs including dry dock costs, although conditions improved in the second half for Capesize, Panamax and smaller sizes. Energy Resource Transport secured stable profits under long-term contracts, with profit increasing due to one-time factors including the absence of impairment losses recorded in FY2024 and gains from a review of tax effects in FY2025 (both recorded at equity-method affiliates). Within Product Logistics, the Car Carrier Business saw a slight increase in units transported, supported by solid demand worldwide, but profit declined due to increased operating costs and factors such as the situation in the Middle East, despite impacts from trade policies in various countries. The Containership Business saw profit decline sharply amid the impacts of U.S. trade policies and the situation in the Middle East, due to higher ship costs resulting from deliveries of newbuild vessels and a decline in freight rates.
| Segment/Business | Metric | FY2025 | FY2024 | Change |
|---|---|---|---|---|
| Dry Bulk | Operating Revenues | 292.7 billion yen | 322.3 billion yen | -29.5 billion yen |
| Dry Bulk | Ordinary Income/Loss | 10.9 billion yen | 13.2 billion yen | -2.3 billion yen |
| Energy Resource Transport | Operating Revenues | 100.6 billion yen | 101.9 billion yen | -1.2 billion yen |
| Energy Resource Transport | Ordinary Income/Loss | 9.6 billion yen | 4.9 billion yen | 4.7 billion yen |
| Product Logistics | Operating Revenues | 616.4 billion yen | 612.8 billion yen | 3.6 billion yen |
| Product Logistics | Ordinary Income/Loss | 90.8 billion yen | 293.6 billion yen | -202.7 billion yen |
| Product Logistics – Car Carrier | Operating Revenues | 379.6 billion yen | 384.0 billion yen | -4.4 billion yen |
| Product Logistics – Car Carrier | Ordinary Income/Loss | 51.2 billion yen | 76.4 billion yen | -25.2 billion yen |
| Product Logistics – Containership | Operating Revenues | 66.8 billion yen | 68.5 billion yen | -1.7 billion yen |
| Product Logistics – Containership | Ordinary Income/Loss | 24.0 billion yen | 206.0 billion yen | -181.9 billion yen |
| Other | Operating Revenues | 8.4 billion yen | 10.8 billion yen | -2.3 billion yen |
| Other | Ordinary Income/Loss | 2.2 billion yen | 0.9 billion yen | 1.2 billion yen |
| Adjustment | Operating Revenues | – | – | – |
| Adjustment | Ordinary Income/Loss | -4.6 billion yen | -4.7 billion yen | 0.0 billion yen |
| Total | Operating Revenues | 1,018.3 billion yen | 1,047.9 billion yen | -29.5 billion yen |
| Total | Ordinary Income/Loss | 109.1 billion yen | 308.0 billion yen | -198.9 billion yen |
Note: the Car Carrier and Containership rows above are business-level components reported within the Product Logistics segment total in the source materials; the Total row is the consolidated segment total as stated in the materials, not a simple sum of every row above.
FY2026 Forecast
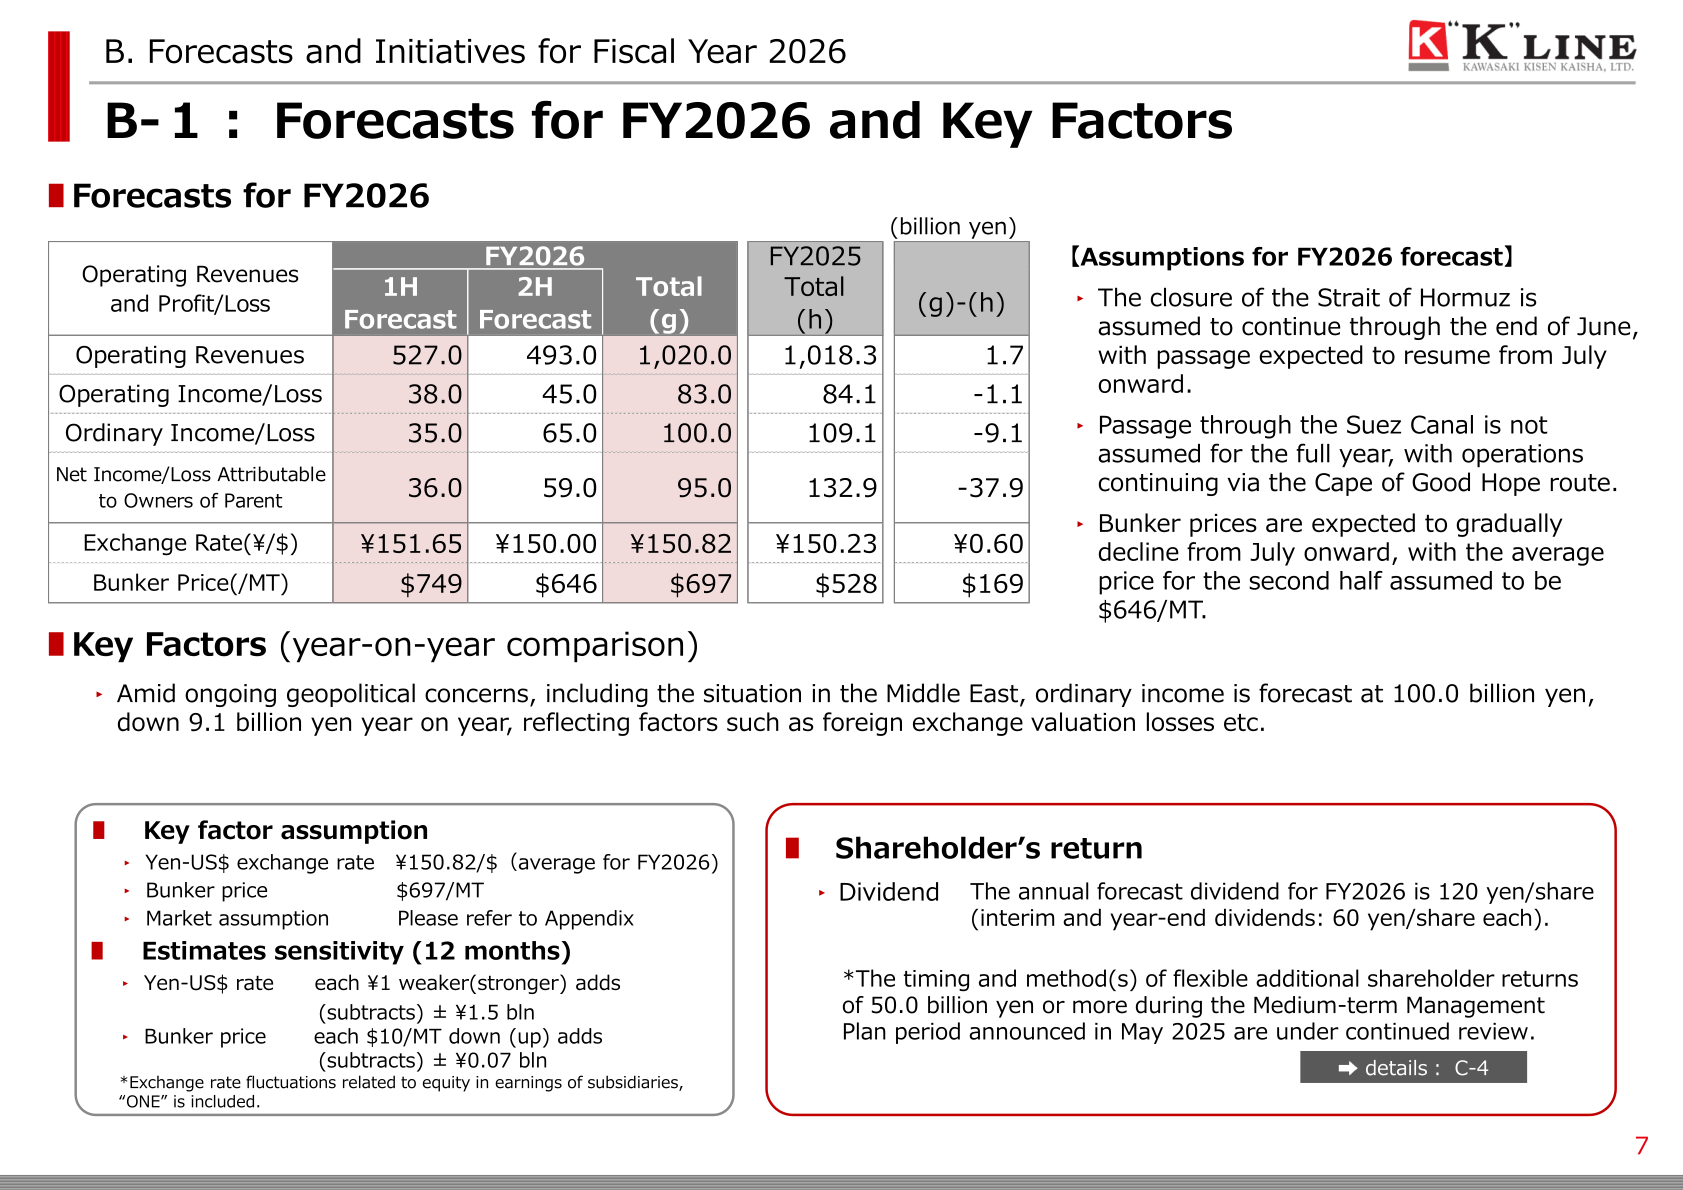
For FY2026, amid ongoing geopolitical concerns including the situation in the Middle East, ordinary income is forecast at 100.0 billion yen, down 9.1 billion yen year on year, reflecting factors such as foreign exchange valuation losses. Key assumptions include a yen-US$ exchange rate of ¥150.82/$ (average for FY2026) and a bunker price of $697/MT. Estimated sensitivities (12-month basis) are ±¥1.5 billion for each ¥1 change in the yen-US$ rate and ±¥0.07 billion for each $10/MT change in bunker price. Assumptions include the closure of the Strait of Hormuz continuing through the end of June, with passage expected to resume from July onward; Suez Canal passage is not assumed for the full year, with operations continuing via the Cape of Good Hope route; and bunker prices are expected to gradually decline from July onward, with the average price for the second half assumed at $646/MT.
| Item | FY2026 Forecast | FY2025 (Actual) | Change |
|---|---|---|---|
| Operating Revenues | 1,020.0 billion yen | 1,018.3 billion yen | 1.7 billion yen |
| Operating Income/Loss | 83.0 billion yen | 84.1 billion yen | -1.1 billion yen |
| Ordinary Income/Loss | 100.0 billion yen | 109.1 billion yen | -9.1 billion yen |
| Net Income/Loss Attributable to Owners of Parent | 95.0 billion yen | 132.9 billion yen | -37.9 billion yen |
| Exchange Rate (¥/$) | ¥150.82 | ¥150.23 | ¥0.60 |
| Bunker Price ($/MT) | $697 | $528 | $169 |
By segment, Dry Bulk profit is expected to increase as transportation demand remains solid and market conditions trend higher. Energy Resource Transport profit is expected to decline due to the absence of one-off gains recorded in the previous period. Within Product Logistics, Car Carrier profit is expected to decline due to the worsening situation in the Middle East, reflected in decreased cargo volumes to the region and increased operating costs such as fuel expenses, while the Containership Business is expected to be roughly in line with the previous year amid continued uncertainty from geopolitical risks including the situation in the Middle East; ONE will continue efficient operation and flexible vessel deployment in line with demand.
| Segment/Business | Metric | FY2026 Forecast | FY2025 (Actual) | Change |
|---|---|---|---|---|
| Dry Bulk | Operating Revenues | 290.0 billion yen | 292.7 billion yen | -2.7 billion yen |
| Dry Bulk | Ordinary Income/Loss | 16.5 billion yen | 10.9 billion yen | 5.6 billion yen |
| Energy Resource Transport | Operating Revenues | 93.5 billion yen | 100.6 billion yen | -7.1 billion yen |
| Energy Resource Transport | Ordinary Income/Loss | 4.0 billion yen | 9.6 billion yen | -5.6 billion yen |
| Product Logistics | Operating Revenues | 628.5 billion yen | 616.4 billion yen | 12.1 billion yen |
| Product Logistics | Ordinary Income/Loss | 82.5 billion yen | 90.8 billion yen | -8.3 billion yen |
| Product Logistics – Car Carrier | Operating Revenues | 392.0 billion yen | 379.6 billion yen | 12.4 billion yen |
| Product Logistics – Car Carrier | Ordinary Income/Loss | 44.0 billion yen | 51.2 billion yen | -7.2 billion yen |
| Product Logistics – Containership | Operating Revenues | 69.0 billion yen | 66.8 billion yen | 2.2 billion yen |
| Product Logistics – Containership | Ordinary Income/Loss | 26.0 billion yen | 24.0 billion yen | 2.0 billion yen |
| Other | Operating Revenues | 8.0 billion yen | 8.4 billion yen | -0.4 billion yen |
| Other | Ordinary Income/Loss | 0.5 billion yen | 2.2 billion yen | -1.7 billion yen |
| Adjustment | Operating Revenues | – | – | – |
| Adjustment | Ordinary Income/Loss | -3.5 billion yen | -4.6 billion yen | 1.1 billion yen |
| Total | Operating Revenues | 1,020.0 billion yen | 1,018.3 billion yen | 1.7 billion yen |
| Total | Ordinary Income/Loss | 100.0 billion yen | 109.1 billion yen | -9.1 billion yen |
Shareholder Returns
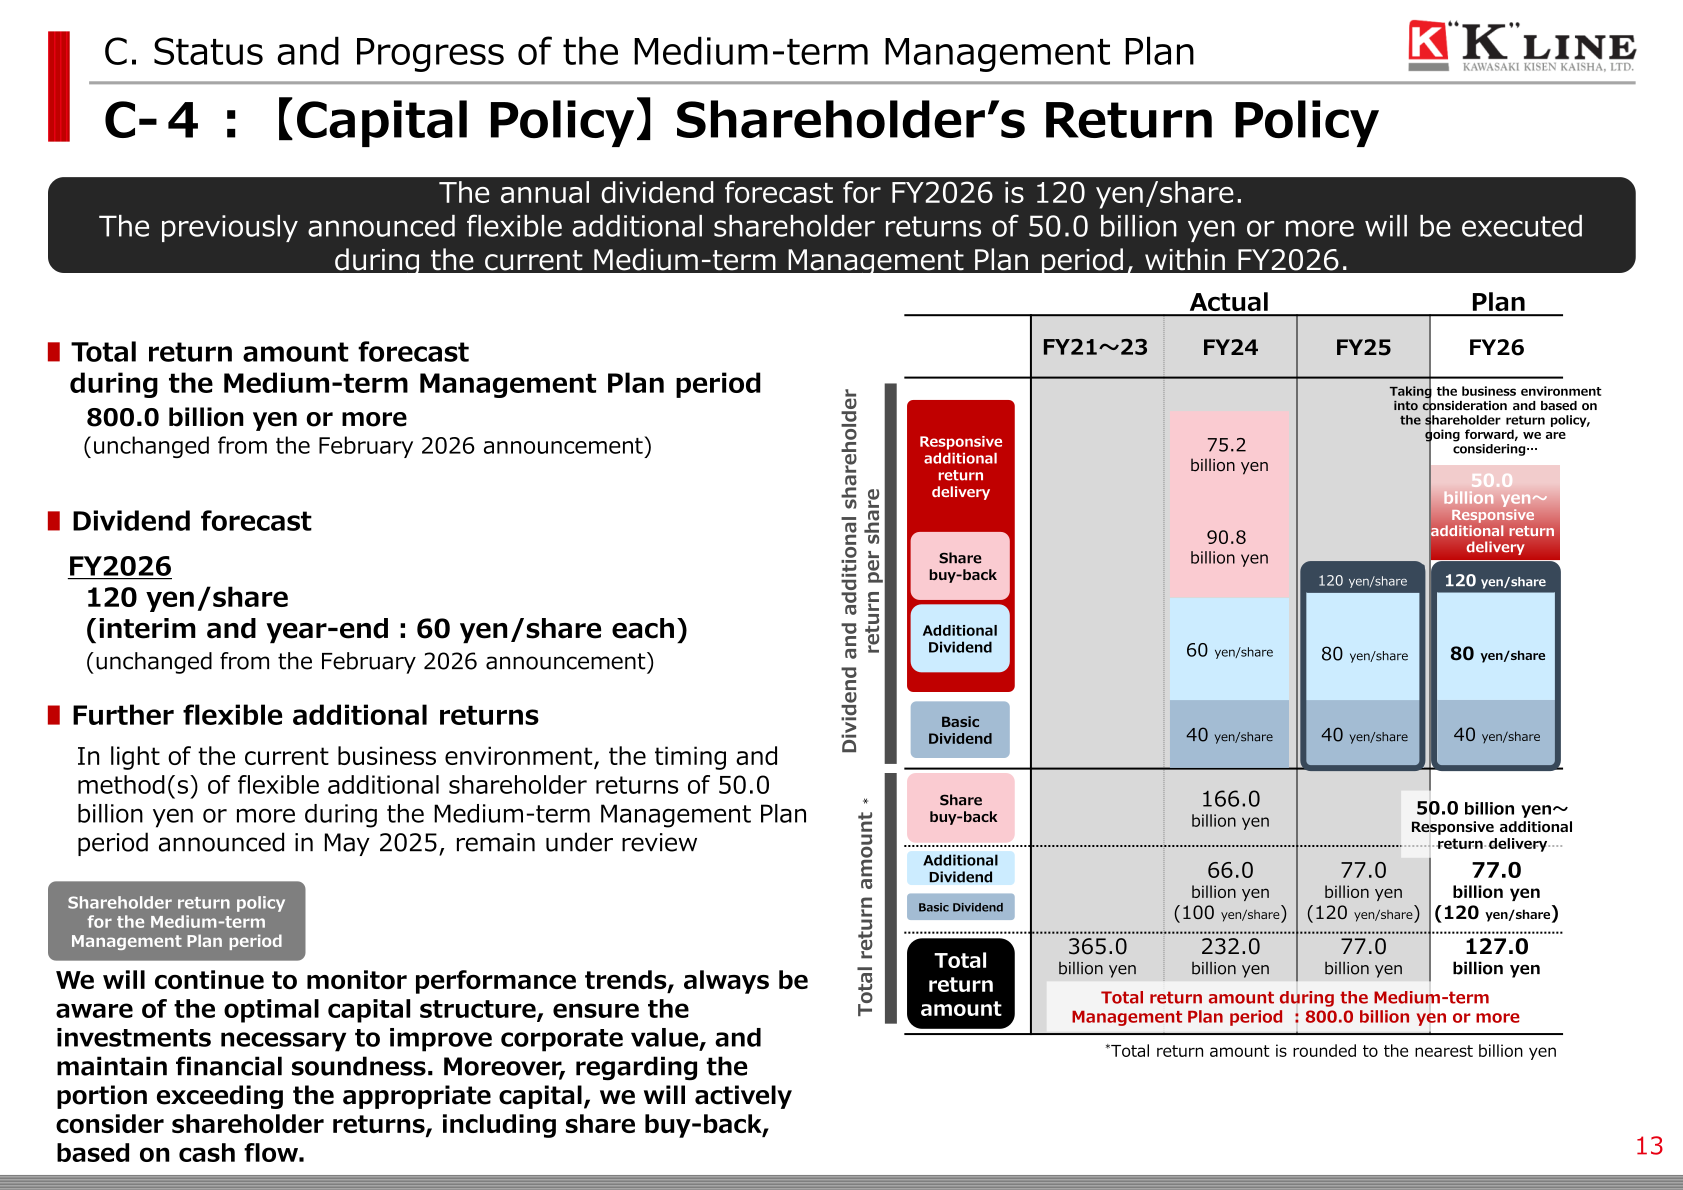
The year-end dividend for FY2025 is 60 yen/share (announced in February 2026); together with the interim dividend of 60 yen/share, the total annual dividend for FY2025 is 120 yen/share. The annual forecast dividend for FY2026 is also 120 yen/share (interim and year-end dividends of 60 yen/share each), unchanged from the February 2026 announcement. The total return amount during the current Medium-term Management Plan period is expected to be 800.0 billion yen or more (unchanged from the February 2026 announcement). The timing and method(s) of flexible additional shareholder returns of 50.0 billion yen or more during the Medium-term Management Plan period, announced in May 2025, remain under continued review.
Medium-Term Plan / Capital Policy Topics
Under the current Medium-term Management Plan, operating cash flow for the plan period is expected to be 1.5 trillion yen (unchanged from the February 2026 announcement), investing cash flow is expected to be 610.0 billion yen (unchanged from the February 2026 announcement), and shareholder returns are expected to be 800.0 billion yen or more. ROIC for FY2026 is forecast at 5% (company-wide), against a Medium-term Management Plan target of 6% to 7%. The company’s PBR target is to return to, maintain and improve a PBR of 1.0 or more. The next Medium-term Management Plan is scheduled for announcement during FY2026, targeting an ROE of 15% or higher over the medium to long term by pursuing profit growth and capital efficiency improvement as two key pillars, and aiming to optimize the capital structure in the short term with a target equity ratio (including off-balance-sheet items) of around 50%.
This article is an analysis based on publicly available information and is not a recommendation to buy or sell any specific securities. Investment decisions are your own responsibility.
![[Obayashi] Investors’ Guide 2026 — The Complete 24-Article Breakdown](https://japan-equity.com/wp-content/uploads/2026/07/hub_cover-1024x1024.png)
![[Obayashi] IR & SR Policy — Feeding Dialogue Back into Management](https://japan-equity.com/wp-content/uploads/2026/07/p32_sq-1024x1024.jpg)
![[Obayashi] Real Estate Development — 18.7% Margin, ¥287.7bn Unrealized Gains](https://japan-equity.com/wp-content/uploads/2026/07/p20_sq-1024x1024.jpg)
![[Obayashi] Domestic Civil Engineering — Resilience Spending Supports 9.6% Margin](https://japan-equity.com/wp-content/uploads/2026/07/p11_sq-1024x1024.jpg)
![[Obayashi] Share Price & External Ratings — vs TOPIX, ESG Index Inclusion](https://japan-equity.com/wp-content/uploads/2026/07/p40_sq-1024x1024.jpg)
![[Construction] ¥75.5tn Investment, Shrinking Workforce — Big-5 Market Share](https://japan-equity.com/wp-content/uploads/2026/07/p12_sq-1024x1024.jpg)



![[Obayashi] Capital Policy & Shareholder Returns — ROE 10%+, DOE ~5%, ¥100bn Buyback](https://japan-equity.com/wp-content/uploads/2026/07/p27_sq-1024x1024.jpg)
![[Obayashi] Reducing Cross-Shareholdings — ¥285.2bn Sold in Five Years](https://japan-equity.com/wp-content/uploads/2026/07/p29_sq-1024x1024.jpg)
![[Obayashi] ¥750bn Investment Plan — ¥300bn to Development, ¥190bn to Tech/DX](https://japan-equity.com/wp-content/uploads/2026/07/p30_sq-1024x1024.jpg)
![[Obayashi] MTP2022 KPIs — Operating Profit ~2x Target, ROE 14.4%](https://japan-equity.com/wp-content/uploads/2026/07/p25_sq-1024x1024.jpg)
![[Obayashi] Cash Allocation — ¥420bn Investment CF Over Five Years](https://japan-equity.com/wp-content/uploads/2026/07/p26_sq-1024x1024.jpg)
![[Obayashi] Green Energy — 44 Plants, 344MW, and the Green Hydrogen Challenge](https://japan-equity.com/wp-content/uploads/2026/07/p21_sq-1024x1024.jpg)
![[Obayashi] Tackling the Labor Shortage — Robotics Construction®](https://japan-equity.com/wp-content/uploads/2026/07/p14_sq-1024x1024.jpg)
