

This article is based on publicly available IR materials and is not a recommendation to buy or sell any specific securities.
Yamaha Motor Co., Ltd. reported consolidated results for the fiscal year ended December 31, 2025 (FY2025) with revenue of ¥2,534.2 billion (98% of FY2024) and operating income of ¥126.4 billion (70% of FY2024, operating income ratio 5.0%, down 2.0 points year on year). Net income attributable to owners of parent fell to ¥16.1 billion (15% of FY2024), as a larger-than-expected amount of deferred tax assets was reversed following a review of the company’s future outlook. The company has initiated companywide cost structure reforms in response to changes in the U.S. market environment. For FY2026, Yamaha Motor forecasts revenue of ¥2,700.0 billion (107% year on year) and operating income of ¥180.0 billion (142% year on year).
Consolidated Results (Full-Year Actual)
Revenue and operating income were largely in line with the company’s revised forecast, but net income fell short of the revised forecast due to a higher amount of deferred tax assets to be reversed.
| Item | FY2025 Results | FY2024 Results | Vs. FY2024 | FY2025 Revised Forecast |
|---|---|---|---|---|
| Revenue (¥ Bil.) | 2,534.2 | 2,576.2 | 98% | 2,570.0 |
| Operating Income (¥ Bil.) | 126.4 | 181.5 | 70% | 120.0 |
| Operating Income Ratio | 5.0% | 7.0% | -2.0 pts. | 4.7% |
| Net Income* (¥ Bil.) | 16.1 | 108.1 | 15% | 45.0 |
| EPS (¥) | 16.59 | 110.12 | 15% | 46.34 |
| Exchange Rate ($/€) | 150/169 | 152/164 | — | 147/161 |
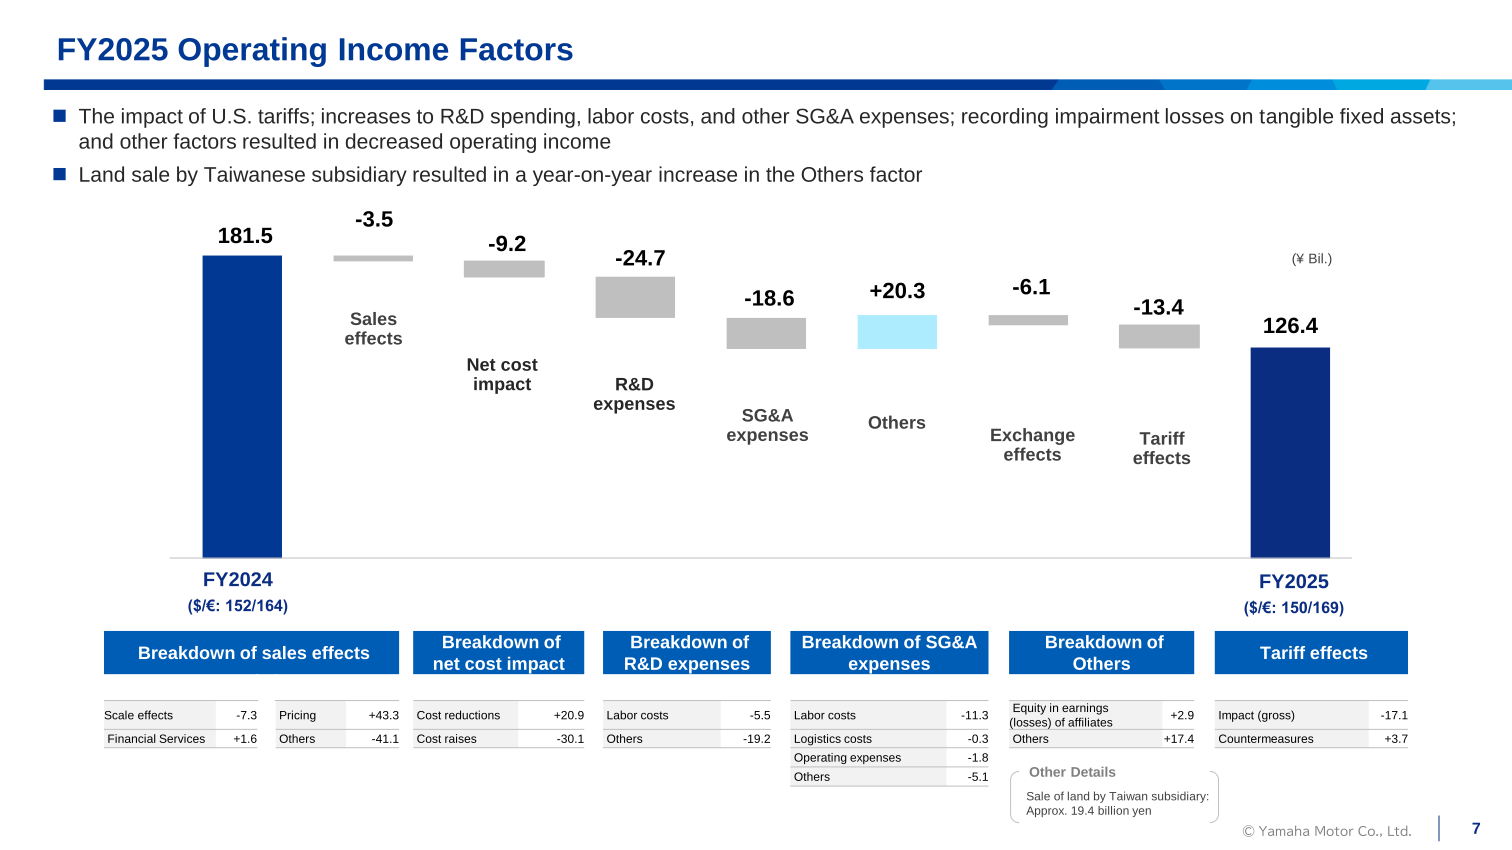
*Net income attributable to owners of parent. According to the company, the impact of U.S. tariffs, increases to R&D spending, higher labor costs and other SG&A expenses, and the recording of impairment losses on tangible fixed assets resulted in the year-on-year decrease in operating income. The land sale by a Taiwanese subsidiary (approximately ¥19.4 billion) contributed to a year-on-year increase in the “Others” factor within the operating income breakdown.
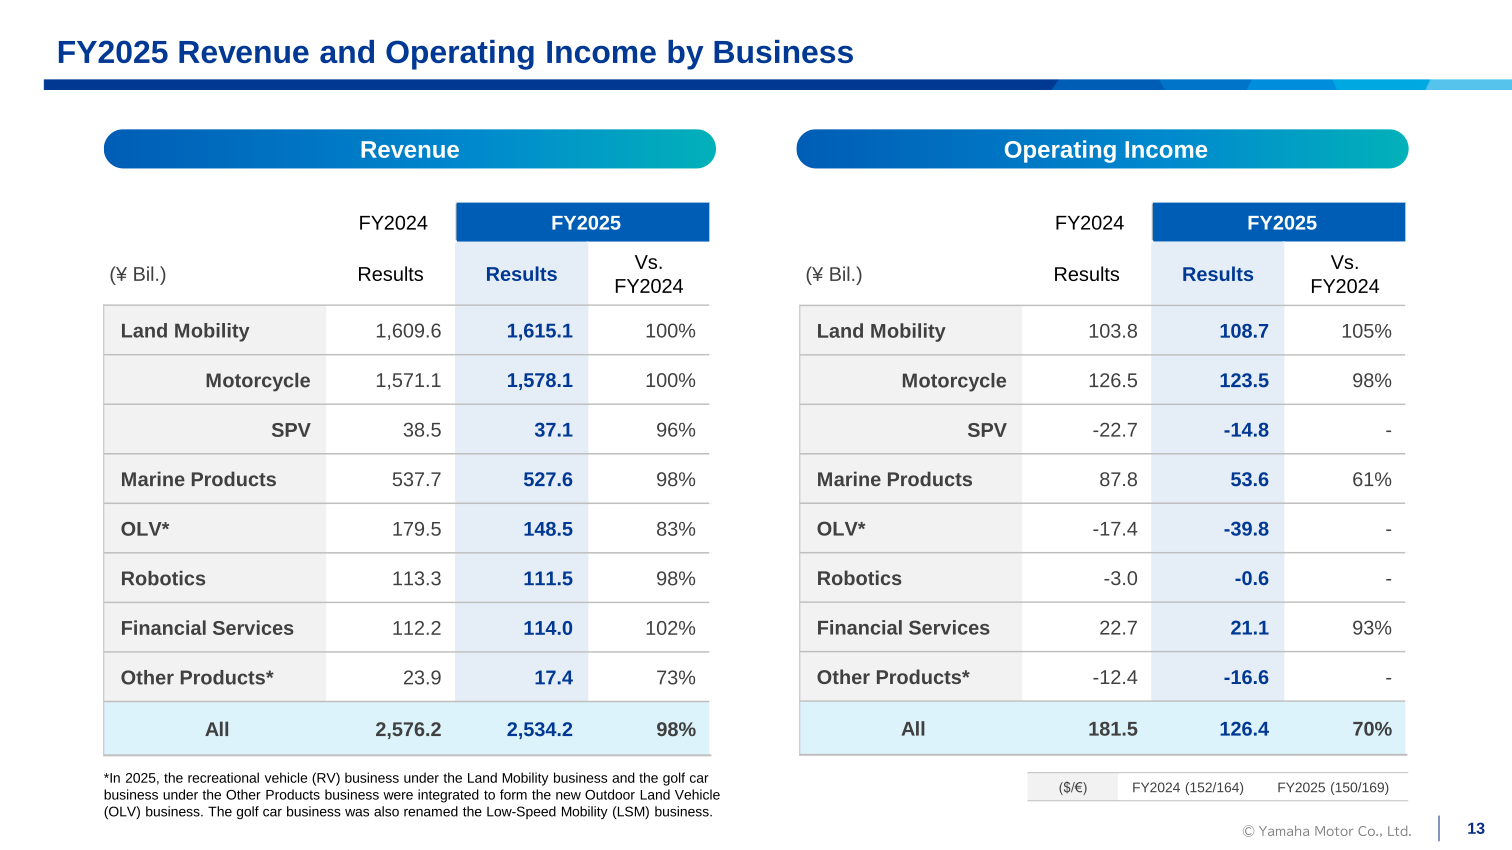
Segment Results (FY2025 Actual)
Note: in 2025, the recreational vehicle (RV) business under the Land Mobility business and the golf car business under the Other Products business were integrated to form the new Outdoor Land Vehicle (OLV) business; the golf car business was also renamed the Low-Speed Mobility (LSM) business. By segment, Land Mobility revenue was on par with FY2024 while operating income rose to 105% of FY2024. Marine Products operating income fell to 61% of FY2024. SPV, OLV, Robotics, and Other Products all recorded an operating loss.
| Segment | Metric | FY2025 Results | FY2024 Results | Vs. FY2024 |
|---|---|---|---|---|
| Land Mobility | Revenue (¥ Bil.) | 1,615.1 | 1,609.6 | 100% |
| Land Mobility | Operating Income (¥ Bil.) | 108.7 | 103.8 | 105% |
| – Motorcycle | Revenue (¥ Bil.) | 1,578.1 | 1,571.1 | 100% |
| – Motorcycle | Operating Income (¥ Bil.) | 123.5 | 126.5 | 98% |
| – SPV | Revenue (¥ Bil.) | 37.1 | 38.5 | 96% |
| – SPV | Operating Income (¥ Bil.) | -14.8 | -22.7 | – |
| Marine Products | Revenue (¥ Bil.) | 527.6 | 537.7 | 98% |
| Marine Products | Operating Income (¥ Bil.) | 53.6 | 87.8 | 61% |
| OLV* | Revenue (¥ Bil.) | 148.5 | 179.5 | 83% |
| OLV* | Operating Income (¥ Bil.) | -39.8 | -17.4 | – |
| Robotics | Revenue (¥ Bil.) | 111.5 | 113.3 | 98% |
| Robotics | Operating Income (¥ Bil.) | -0.6 | -3.0 | – |
| Financial Services | Revenue (¥ Bil.) | 114.0 | 112.2 | 102% |
| Financial Services | Operating Income (¥ Bil.) | 21.1 | 22.7 | 93% |
| Other Products* | Revenue (¥ Bil.) | 17.4 | 23.9 | 73% |
| Other Products* | Operating Income (¥ Bil.) | -16.6 | -12.4 | – |
| All | Revenue (¥ Bil.) | 2,534.2 | 2,576.2 | 98% |
| All | Operating Income (¥ Bil.) | 126.4 | 181.5 | 70% |
FY2026 Forecast
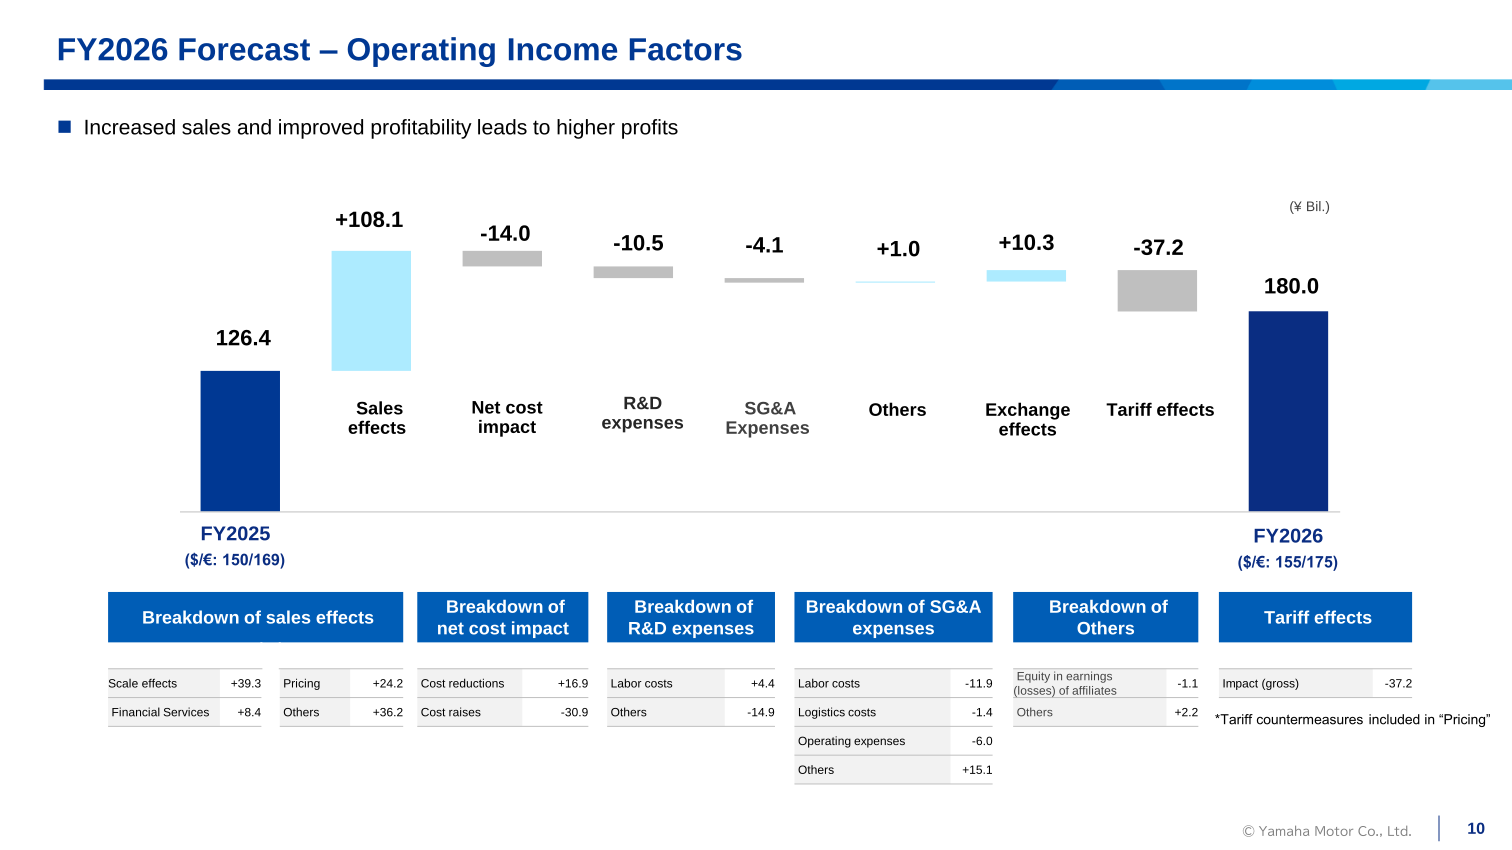
Revenue is forecast to increase primarily due to higher unit sales in core businesses. Increased tariffs are expected to impact results, but higher profits are targeted through pricing strategies and cost structure reforms.
| Item | FY2025 Results | FY2026 Forecast | Vs. FY2025 |
|---|---|---|---|
| Revenue (¥ Bil.) | 2,534.2 | 2,700.0 | 107% |
| Operating Income (¥ Bil.) | 126.4 | 180.0 | 142% |
| Operating Income Ratio | 5.0% | 6.7% | +1.7 pts. |
| Net Income* (¥ Bil.) | 16.1 | 100.0 | 621% |
| EPS (¥) | 16.59 | 103.05 | 621% |
| Exchange Rate ($/€) | 150/169 | 155/175 | — |
*Net income attributable to owners of parent.
By segment, FY2026 revenue and operating income are forecast to increase in Land Mobility, Marine Products, OLV, Robotics (excluding the Unmanned Systems business), and Financial Services, while Other Products revenue is forecast to decline. From 2026, the Unmanned Systems (UMS) business (drones and industrial unmanned helicopters), previously under Robotics, was transferred to the Other Products business; previous results have been adjusted accordingly.
| Segment | Metric | FY2025 Results | FY2026 Forecast | Vs. FY2025 |
|---|---|---|---|---|
| Land Mobility | Revenue (¥ Bil.) | 1,615.1 | 1,725.0 | 107% |
| Land Mobility | Operating Income (¥ Bil.) | 108.7 | 127.0 | 117% |
| – Motorcycle | Revenue (¥ Bil.) | 1,578.1 | 1,680.0 | 106% |
| – Motorcycle | Operating Income (¥ Bil.) | 123.5 | 134.0 | 108% |
| – SPV | Revenue (¥ Bil.) | 37.1 | 45.0 | 121% |
| – SPV | Operating Income (¥ Bil.) | -14.8 | -7.0 | – |
| Marine Products | Revenue (¥ Bil.) | 527.6 | 556.0 | 105% |
| Marine Products | Operating Income (¥ Bil.) | 53.6 | 61.0 | 114% |
| OLV | Revenue (¥ Bil.) | 148.5 | 160.0 | 108% |
| OLV | Operating Income (¥ Bil.) | -39.8 | -24.0 | – |
| Robotics* | Revenue (¥ Bil.) | 107.4 | 116.0 | 108% |
| Robotics* | Operating Income (¥ Bil.) | 1.7 | 6.0 | 360% |
| Financial Services | Revenue (¥ Bil.) | 114.0 | 128.0 | 112% |
| Financial Services | Operating Income (¥ Bil.) | 21.1 | 26.0 | 123% |
| Other Products* | Revenue (¥ Bil.) | 21.5 | 15.0 | 70% |
| Other Products* | Operating Income (¥ Bil.) | -18.9 | -16.0 | – |
| All | Revenue (¥ Bil.) | 2,534.2 | 2,700.0 | 107% |
| All | Operating Income (¥ Bil.) | 126.4 | 180.0 | 142% |
*From 2026, the Unmanned Systems (UMS) business (drones and industrial unmanned helicopters) that was under the Robotics business was transferred to the Other Products business; previous results shown above have been adjusted accordingly.
U.S. Market Environment: Cost Structure Reforms
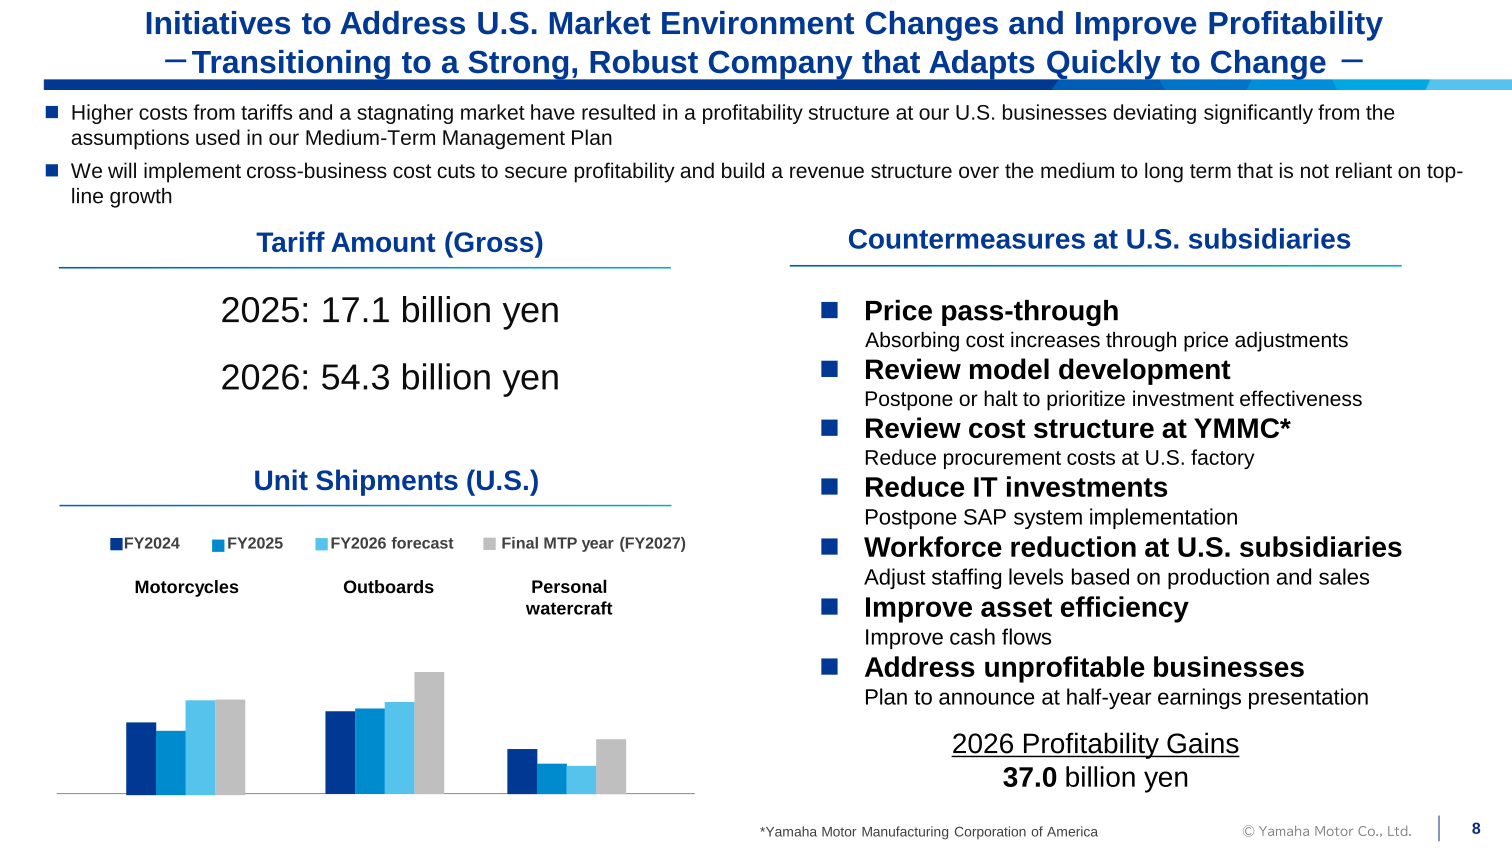
According to the company, higher costs from tariffs and a stagnating market have resulted in a profitability structure at Yamaha Motor’s U.S. businesses that deviates significantly from the assumptions used in its Medium-Term Management Plan. The gross tariff amount was ¥17.1 billion in 2025 and is estimated at ¥54.3 billion in 2026. The company targets 2026 profitability gains of ¥37.0 billion and will implement cross-business cost cuts to secure profitability and build a revenue structure not reliant on top-line growth. Initiatives disclosed include: price pass-through to absorb cost increases; reviewing model development to postpone or halt projects and prioritize investment effectiveness; reviewing the cost structure at Yamaha Motor Manufacturing Corporation of America (YMMC) to reduce procurement costs at the U.S. factory; reducing IT investments by postponing the SAP system implementation; workforce reduction at U.S. subsidiaries to adjust staffing levels based on production and sales; improving asset efficiency and cash flows; and addressing unprofitable businesses, with an announcement planned at the half-year earnings presentation.
Shareholder Returns
In consideration of business performance and financial soundness, Yamaha Motor plans to pay a year-end dividend of ¥10 per share for FY2025, resulting in an annual dividend of ¥35 per share (interim dividend ¥25, year-end dividend ¥10). For FY2026, the company forecasts an annual dividend of ¥50 per share (interim dividend ¥25, year-end dividend ¥25), based on its shareholder return policy of making consistent and ongoing dividend payments, and aims for flexible acquisition of treasury stock.
| Item | 2023 (Results) | 2024 (Results) | 2025 (Planned) | 2026 (Forecast) |
|---|---|---|---|---|
| EPS (¥) | 157.89 | 110.12 | 16.59 | 103.05 |
| Annual Dividend per Share (¥) | 48.3 | 50.0 | 35.0 | 50.0 |
| Acquisition of Treasury Stock | 30 bil. | 20 bil. | 10 bil. | Implement flexibly |
| Total Payout Ratio | 49.4% | 63.7% | 272.8% | 48.5% |
Medium-Term Management Plan Targets
Under the current Medium-Term Management Plan (2025–2027), Yamaha Motor’s 2025–2027 average targets include revenue CAGR over 7%, an operating income ratio over 9%, ROE in the 14% range, ROIC in the 8% range, ROA in the 9% range, and a total payout ratio over 40%. FY2025 results were well below these targets, with the company forecasting a recovery in FY2026.
| Item | FY2024 Result (IFRS) | FY2025 Result (IFRS) | FY2026 Forecast (IFRS) | FY2025–2027 Average Target |
|---|---|---|---|---|
| Revenue (¥ Bil.) | 2,576.2 | 2,534.2 | 2,700.0 | CAGR over 7% |
| Operating Income Ratio | 7.0% | 5.0% | 6.7% | Over 9% |
| ROE | 9.7% | 1.4% | 8.7% | 14% range |
| ROIC | 5.4% | 0.8% | 4.5% | 8% range |
| ROA | 6.8% | 4.4% | 6.1% | 9% range |
| Equity Ratio | 41.7% | 39.0% | 39.3% | – |
| EPS (¥) | 110.1 | 16.6 | 103.0 | – |
| Total Payout Ratio | 63.7% | 272.8% | 48.5% | Over 40% |
Financial Position and Cash Flow
| Item (¥ Bil.) | FY2024 Results | FY2025 Results | FY2026 Forecast |
|---|---|---|---|
| Cash flows from operating | 176.8 | 138.6 | – |
| Cash flows from investing | -128.7 | -86.1 | – |
| Free cash flow | 48.1 | 52.5 | – |
| Cash flows from financing | -46.4 | -30.4 | – |
| Capital expenditures | 126.6 | 128.0 | 140.0 |
| Depreciation | 83.1 | 88.8 | 89.0 |
| R&D expenditures | 136.0 | 159.1 | 170.0 |
| Cash and cash equivalents at end of period | 373.0 | 398.9 | – |
| Interest-bearing debt* balance at end of period | 952.0 | 1,044.3 | – |
| Net cash | -579.0 | -645.4 | – |
| Net cash (excluding the Financial Services business) | -19.8 | -59.0 | – |
*Excluding lease debt.
This article is an analysis based on publicly available information and is not a recommendation to buy or sell any specific securities. Investment decisions are your own responsibility.
![[Obayashi] Investors’ Guide 2026 — The Complete 24-Article Breakdown](https://japan-equity.com/wp-content/uploads/2026/07/hub_cover-1024x1024.png)
![[Obayashi] IR & SR Policy — Feeding Dialogue Back into Management](https://japan-equity.com/wp-content/uploads/2026/07/p32_sq-1024x1024.jpg)
![[Obayashi] Real Estate Development — 18.7% Margin, ¥287.7bn Unrealized Gains](https://japan-equity.com/wp-content/uploads/2026/07/p20_sq-1024x1024.jpg)
![[Obayashi] Domestic Civil Engineering — Resilience Spending Supports 9.6% Margin](https://japan-equity.com/wp-content/uploads/2026/07/p11_sq-1024x1024.jpg)
![[Obayashi] Share Price & External Ratings — vs TOPIX, ESG Index Inclusion](https://japan-equity.com/wp-content/uploads/2026/07/p40_sq-1024x1024.jpg)
![[Construction] ¥75.5tn Investment, Shrinking Workforce — Big-5 Market Share](https://japan-equity.com/wp-content/uploads/2026/07/p12_sq-1024x1024.jpg)



![[Obayashi] Capital Policy & Shareholder Returns — ROE 10%+, DOE ~5%, ¥100bn Buyback](https://japan-equity.com/wp-content/uploads/2026/07/p27_sq-1024x1024.jpg)
![[Obayashi] Reducing Cross-Shareholdings — ¥285.2bn Sold in Five Years](https://japan-equity.com/wp-content/uploads/2026/07/p29_sq-1024x1024.jpg)
![[Obayashi] ¥750bn Investment Plan — ¥300bn to Development, ¥190bn to Tech/DX](https://japan-equity.com/wp-content/uploads/2026/07/p30_sq-1024x1024.jpg)
![[Obayashi] MTP2022 KPIs — Operating Profit ~2x Target, ROE 14.4%](https://japan-equity.com/wp-content/uploads/2026/07/p25_sq-1024x1024.jpg)
![[Obayashi] Cash Allocation — ¥420bn Investment CF Over Five Years](https://japan-equity.com/wp-content/uploads/2026/07/p26_sq-1024x1024.jpg)
![[Obayashi] Green Energy — 44 Plants, 344MW, and the Green Hydrogen Challenge](https://japan-equity.com/wp-content/uploads/2026/07/p21_sq-1024x1024.jpg)
![[Obayashi] Tackling the Labor Shortage — Robotics Construction®](https://japan-equity.com/wp-content/uploads/2026/07/p14_sq-1024x1024.jpg)
