
This article is based on publicly available IR materials and is not a recommendation to buy or sell any specific securities.
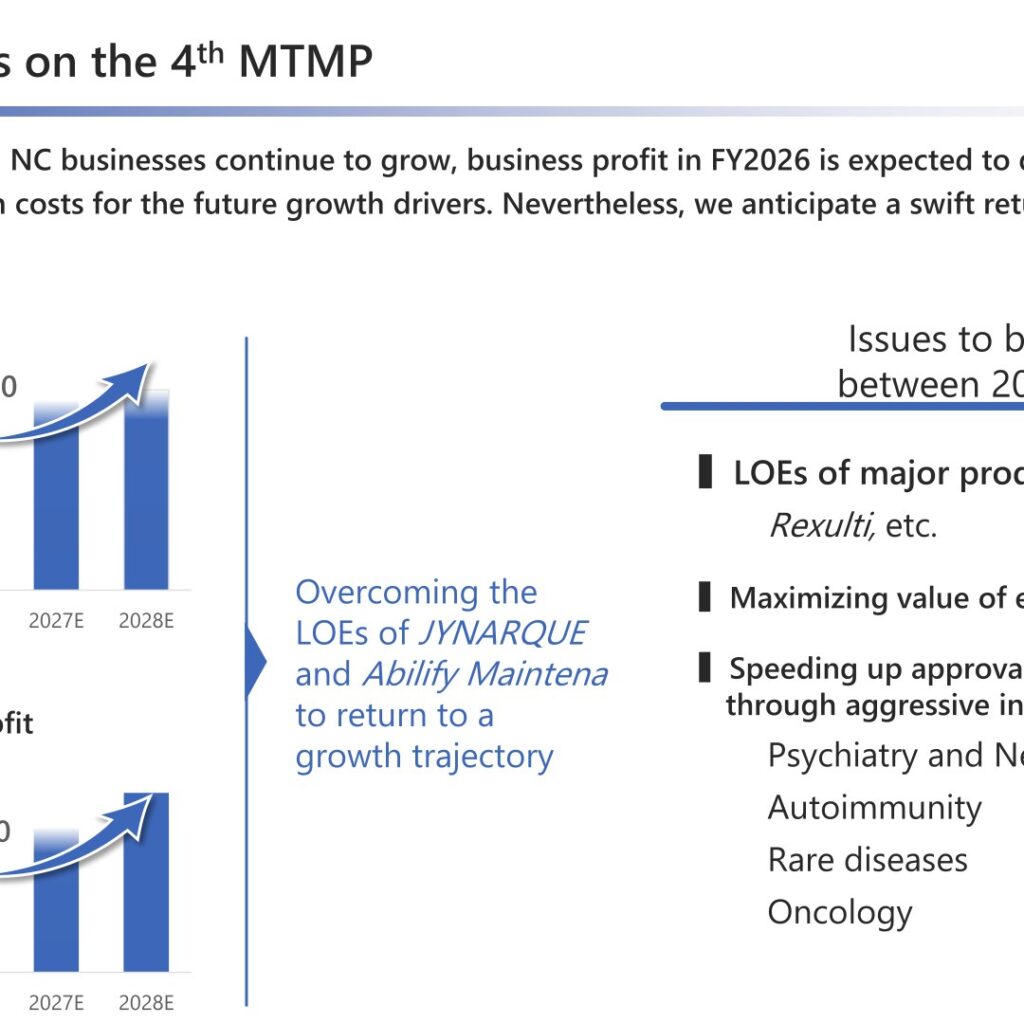
Otsuka Holdings Co., Ltd. reported FY2025 (fiscal year ended December 2025) consolidated results with revenue up 6.0% year-on-year to ¥2,468.9 Bil and business profit up 3.6% to ¥446.1 Bil, with revenue and all profit items reaching record highs. Performance was mainly driven by global products, royalty income and the Nutraceutical business. For FY2026, Otsuka forecasts revenue of ¥2,520.0 Bil (+2.1% YoY) and business profit of ¥355.0 Bil (–20.4% YoY), reflecting the impact of loss of exclusivity (LOE) on major products and investment in new growth drivers, while still exceeding the initial 4th Mid-Term Management Plan (MTMP) assumption for business profit by ¥85.0 Bil. Otsuka also plans to acquire ¥50 billion of treasury stock in FY2026, in addition to its dividend.
Consolidated Results (Full-Year Actual)
On a consolidated basis, revenue increased 6.0% YoY to ¥2,468.9 Bil, achieving 102.0% of the October-revised forecast. Business profit rose 3.6% YoY to ¥446.1 Bil, or 108.8% of the revised forecast. Operating profit increased 48.2% YoY and net profit attributable to owners of the parent company increased 5.8% YoY (see table below for absolute figures; unit: ¥100 Mil). ROE was 12.6%, down 0.8ppt YoY. The increase in business profit reflects sales-driven higher gross profit in the Pharmaceutical and Nutraceutical (NC) businesses and SG&A control, despite aggressive R&D investment.
| Item (Unit: ¥100 Mil) | FY2024 | FY2025 | YoY Change |
|---|---|---|---|
| Revenue | 23,299 | 24,689 | +6.0% |
| Cost of sales | 6,604 | 6,991 | +5.9% |
| SG&A | 9,583 | 10,045 | +4.8% |
| SG&A (excl. co-promotion expenses) | 7,897 | 8,072 | +2.2% |
| Business profit before R&D expenses | 7,447 | 7,990 | +7.3% |
| R&D expenses | 3,142 | 3,528 | +12.3% |
| Business profit | 4,305 | 4,461 | +3.6% |
| Operating profit | 3,236 | 4,794 | +48.2% |
| Net profit (attributable to owners of the parent) | 3,431 | 3,632 | +5.8% |
| ROE | 13.4% | 12.6% | -0.8ppt |
Segment Results
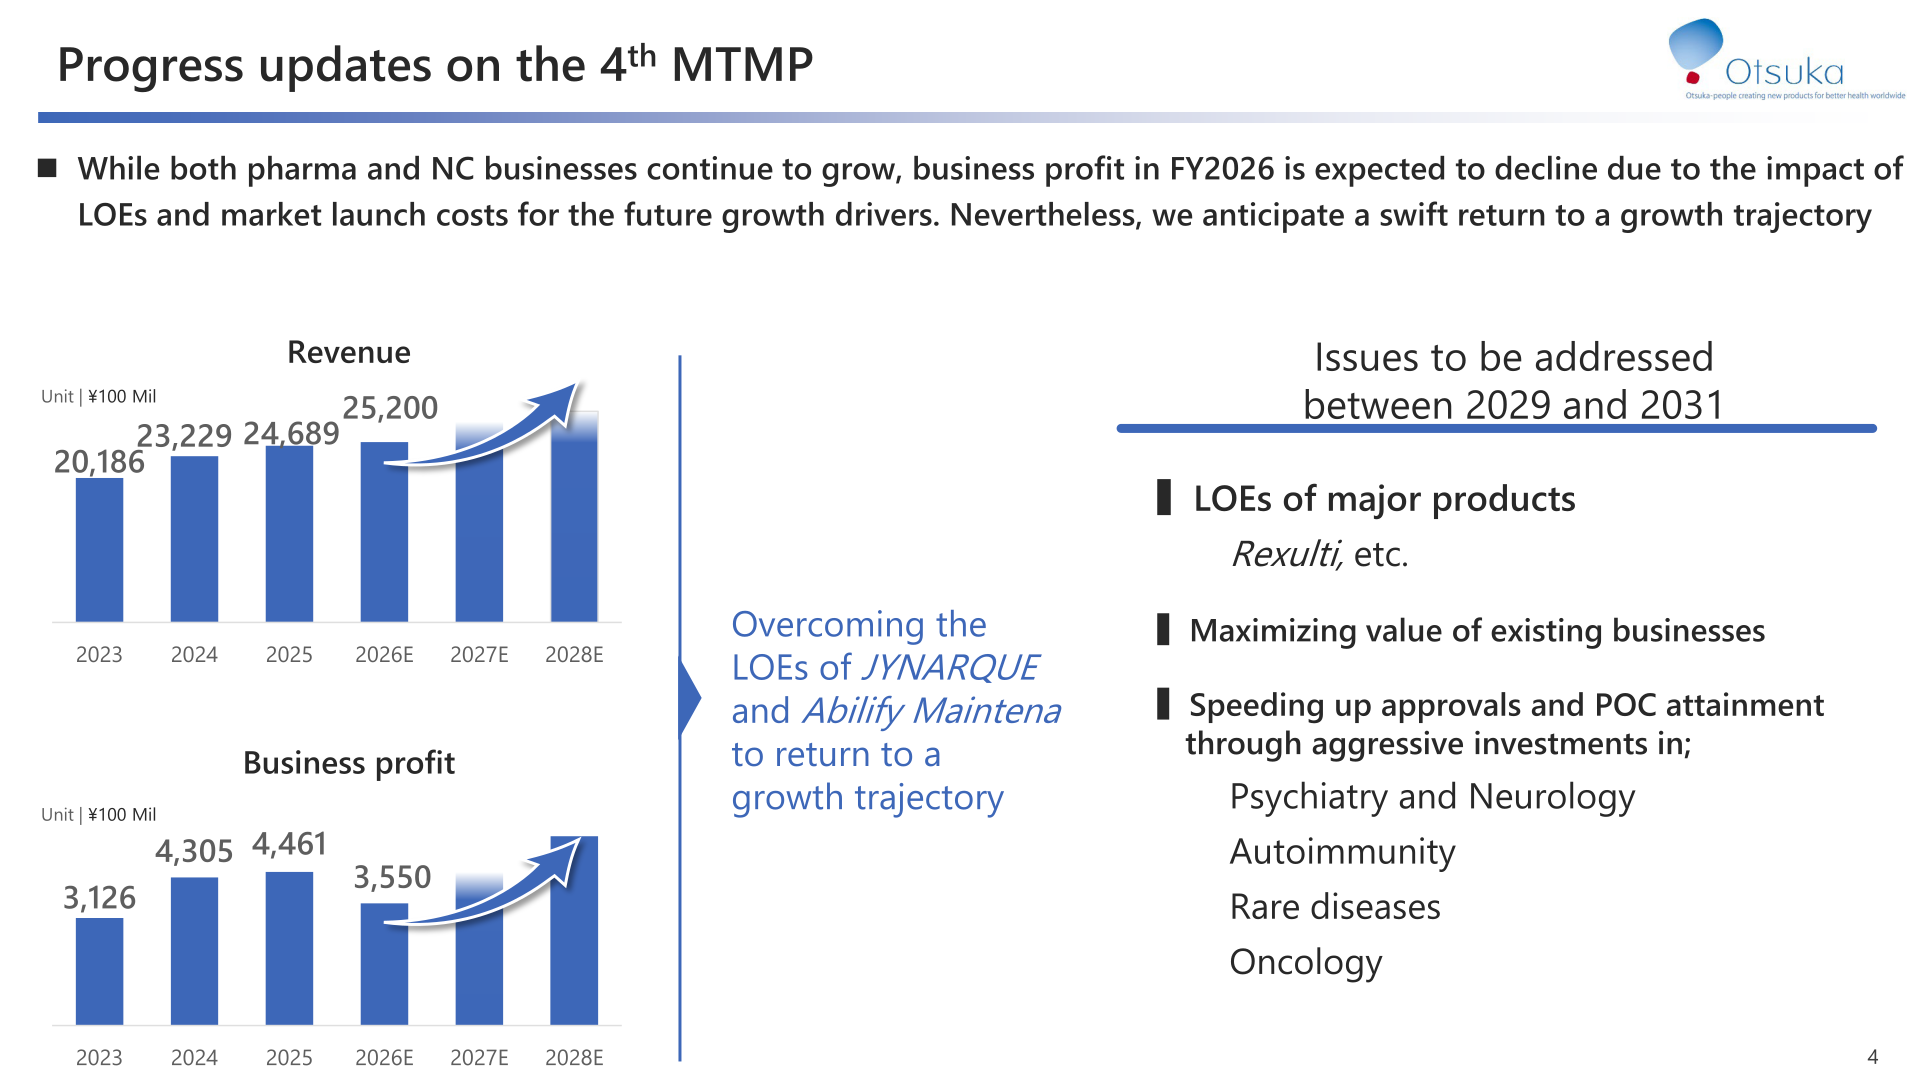
Pharmaceutical business revenue grew 7.1% YoY to ¥1,744.2 Bil (achievement 102.3% vs. the October revision), driven by strong sales of REXULTI and ABILIFY MAINTENA and higher royalty income, despite the impact of the JYNARQUE generic launch. Nutraceutical (NC) business revenue increased 3.7% YoY to ¥577.7 Bil, with all categories contributing to growth, led by the “For Women’s Health” and “For Healthier Life” categories. By segment, Pharmaceutical business profit rose 2.9% YoY to 4,020 (¥100 Mil) and Nutraceutical business profit rose 7.4% YoY to 689 (¥100 Mil).
| Segment | Metric (Unit: ¥100 Mil) | FY2024 | FY2025 | YoY Change |
|---|---|---|---|---|
| Pharmaceutical | Revenue | 16,290 | 17,442 | +7.1% |
| Pharmaceutical | Cost of sales | 2,845 | 3,136 | +10.2% |
| Pharmaceutical | SG&A | 6,621 | 6,980 | +5.4% |
| Pharmaceutical | R&D expenses | 2,964 | 3,345 | +12.8% |
| Pharmaceutical | Business profit | 3,906 | 4,020 | +2.9% |
| Nutraceutical | Revenue | 5,570 | 5,777 | +3.7% |
| Nutraceutical | Cost of sales | 2,694 | 2,761 | +2.5% |
| Nutraceutical | SG&A | 2,128 | 2,216 | +4.1% |
| Nutraceutical | R&D expenses | 120 | 123 | +2.7% |
| Nutraceutical | Business profit | 641 | 689 | +7.4% |
FY2026 Forecast
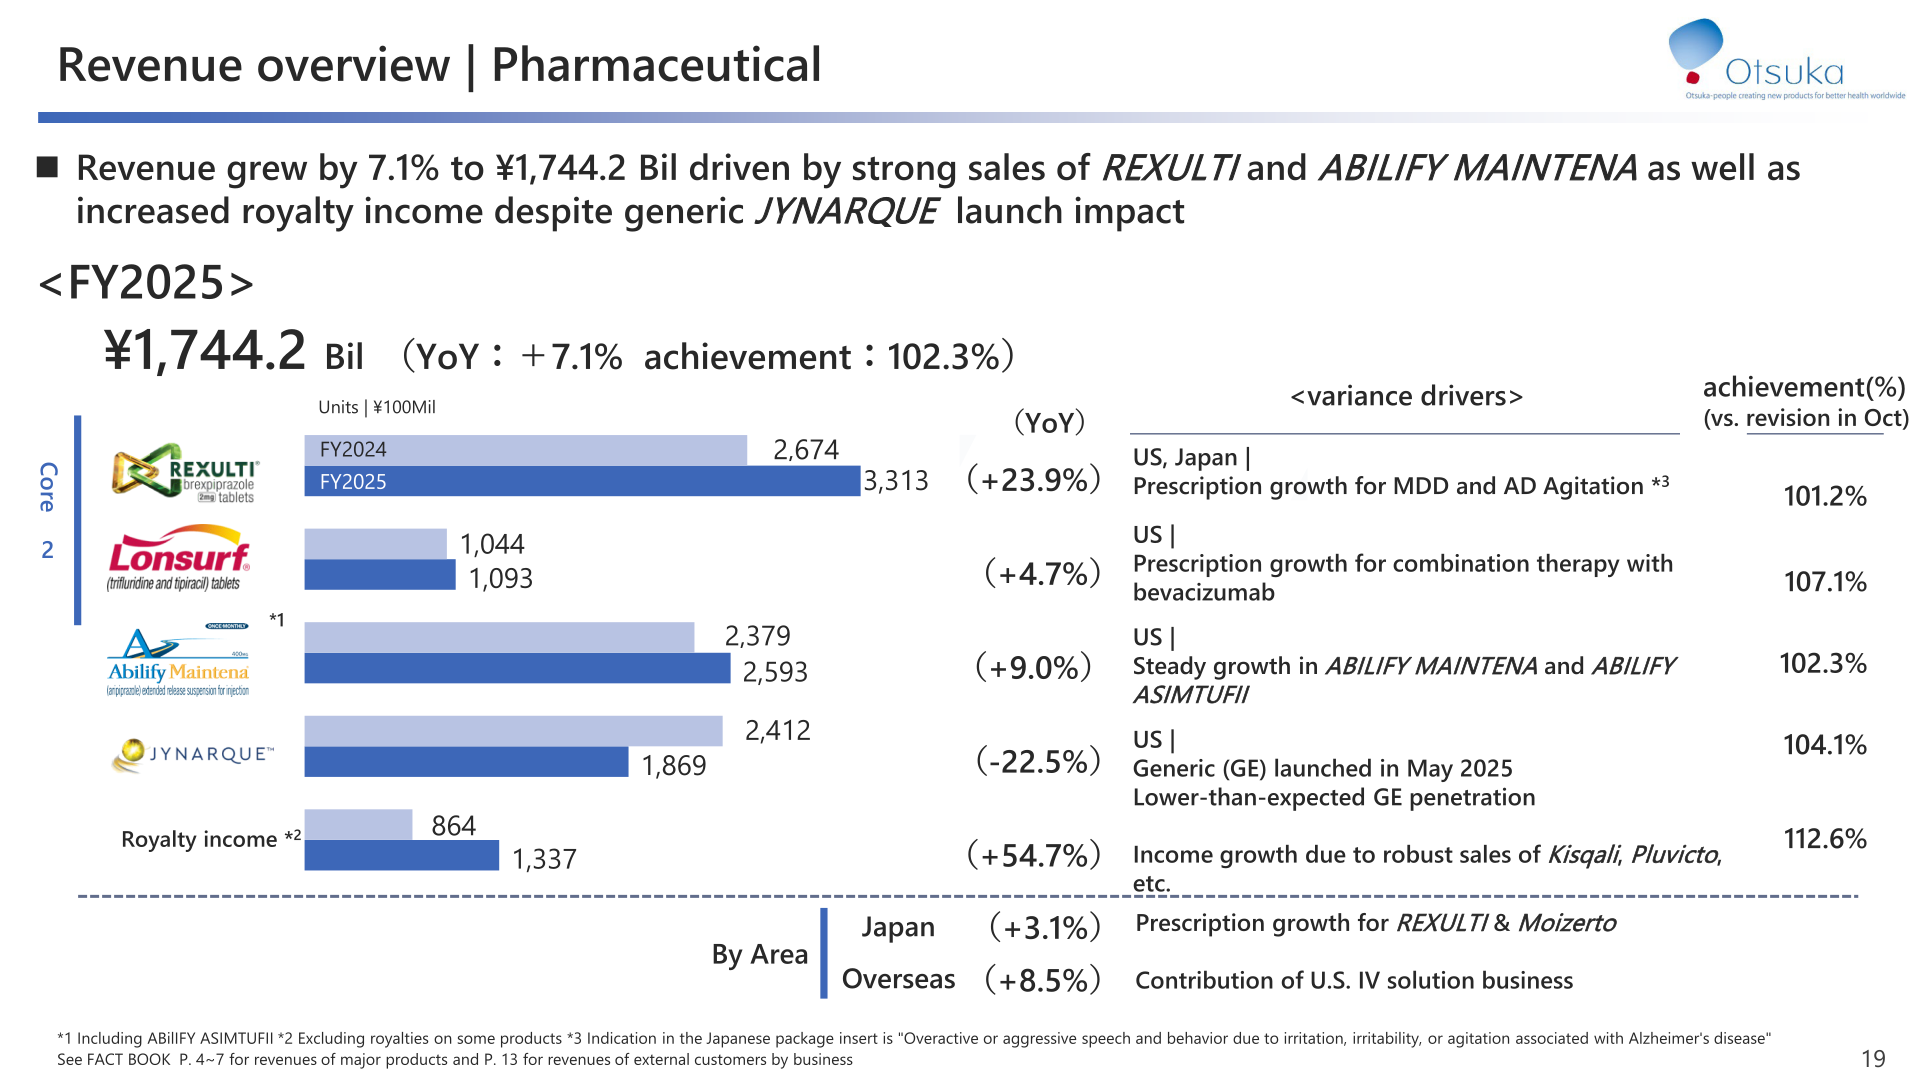
For FY2026, Otsuka forecasts consolidated revenue of ¥2,520.0 Bil (+2.1% YoY), driven by growth of “Global 10 plus 2” products and higher Nutraceutical business revenue. Business profit is forecast to decline by ¥91.1 Bil YoY (–20.4%) to ¥355.0 Bil, reflecting higher SG&A associated with revenue growth and new business development costs, but is expected to exceed the 4th MTMP assumption by ¥85.0 Bil. Growth in “Global 10 plus 2” products and the NC business is expected to partially offset the impact of LOEs on major products, resulting in a ¥19.8 Bil decrease in gross profit, while SG&A and R&D expenses are expected to rise by about ¥70.0 Bil for launch preparations and investment in growth drivers including the “Next 8” pipeline.
| Item (Unit: ¥100 Mil) | FY2025 (Actual) | FY2026 (Plan) | Change |
|---|---|---|---|
| Revenue | 24,689 | 25,200 | +2.1% |
| Cost of sales | 6,991 | 7,700 | +10.1% |
| SG&A | 10,045 | 10,500 | +4.5% |
| SG&A (excl. co-promotion expenses) | 8,072 | 8,455 | +4.8% |
| Business profit before R&D expenses | 7,990 | 7,330 | -8.3% |
| R&D expenses | 3,528 | 3,780 | +7.1% |
| Business profit | 4,461 | 3,550 | -20.4% |
| Operating profit | 4,794 | 3,600 | -24.9% |
| Net profit (attributable to owners of the Company) | 3,632 | 2,650 | -27.0% |
| ROE | 12.6% | >8.5% | – |
Shareholder Returns
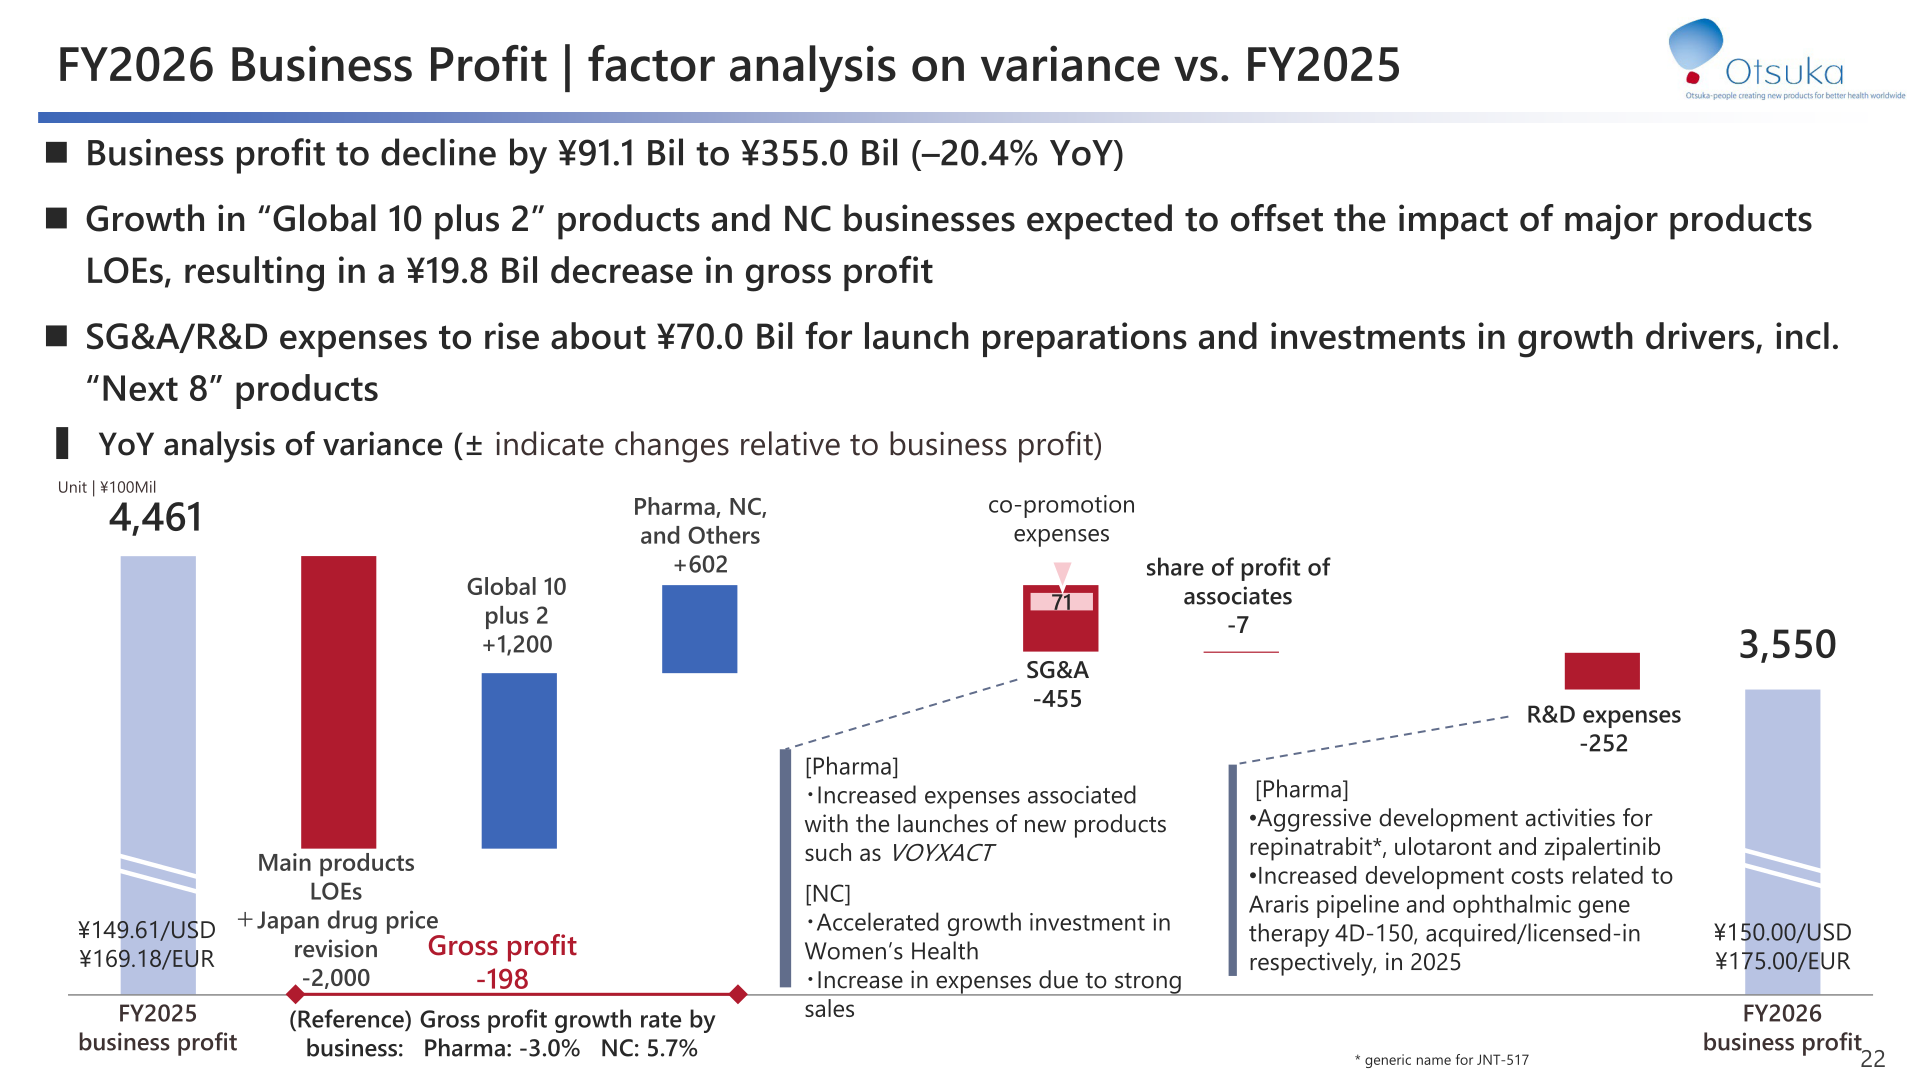
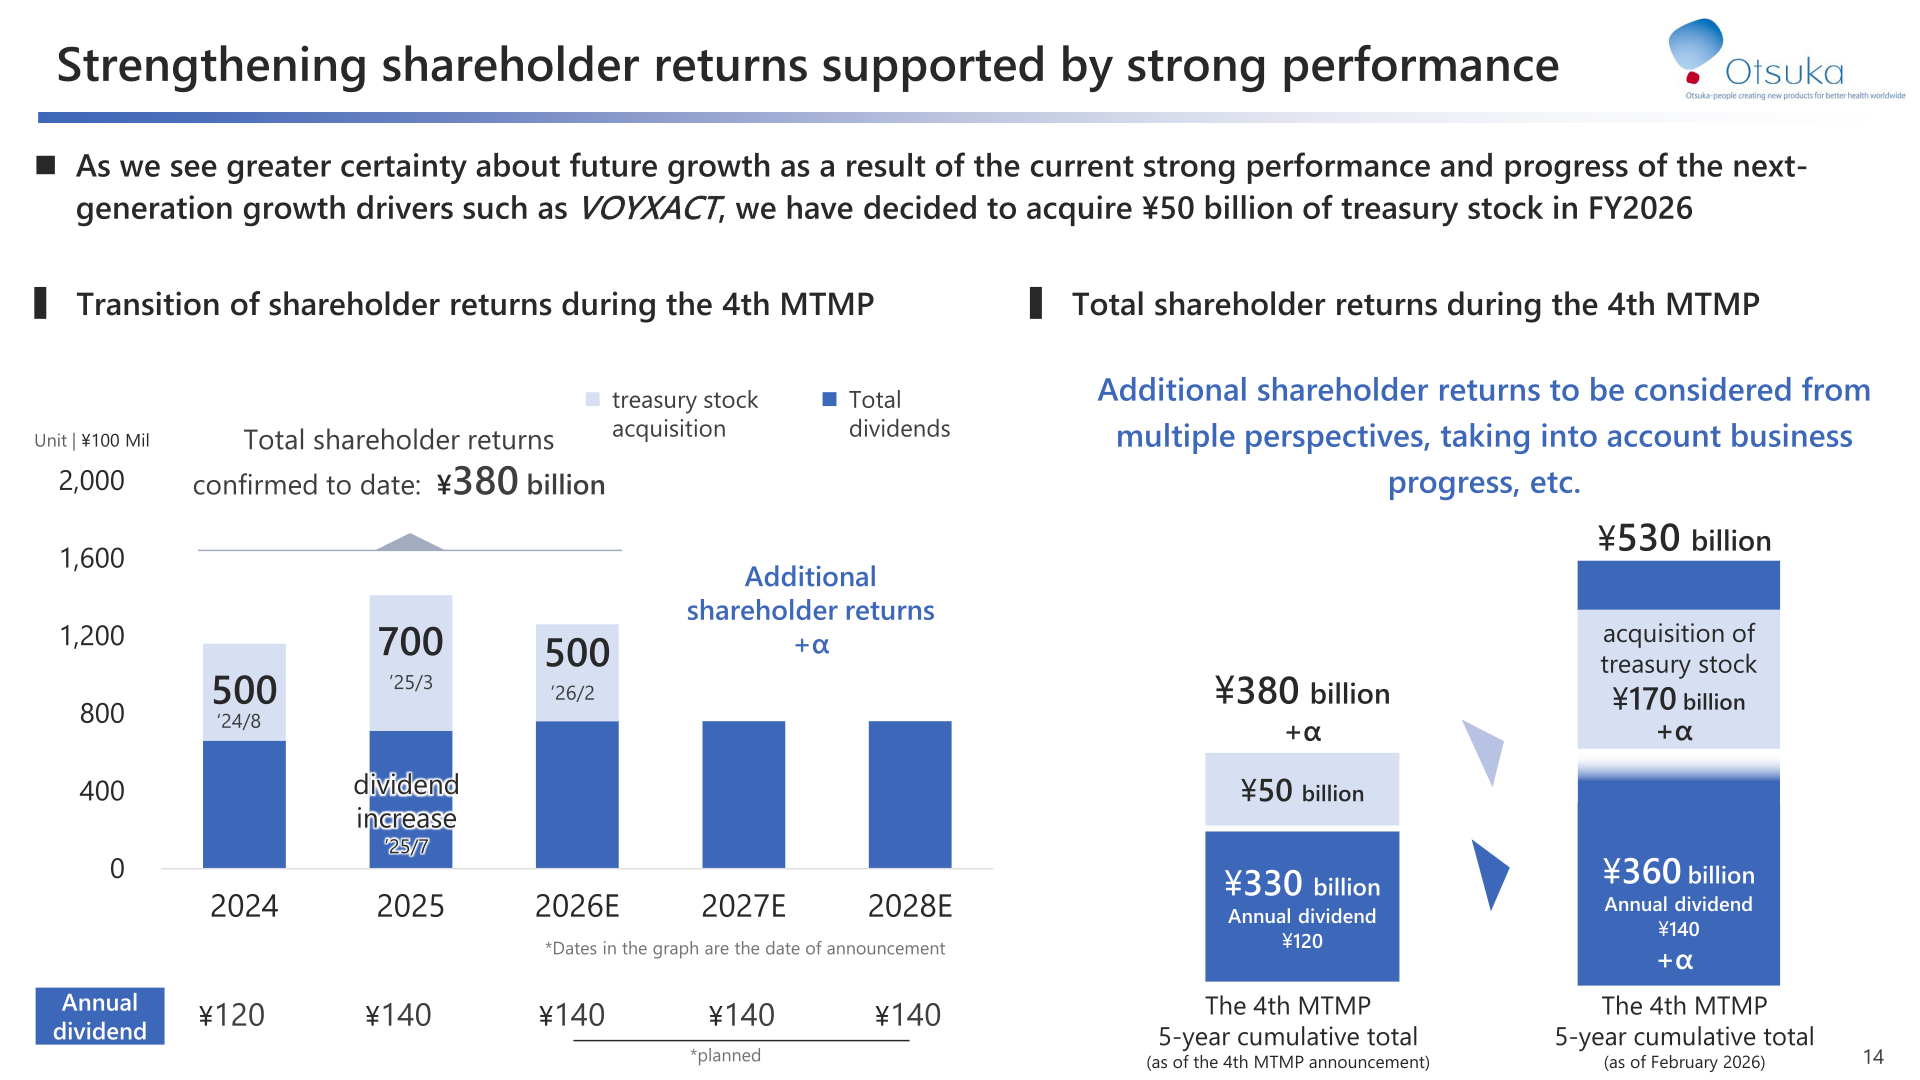
Otsuka plans to acquire ¥50 billion of treasury stock in FY2026, reflecting greater certainty about future growth from strong performance and progress of next-generation growth drivers such as VOYXACT. Annual dividend, which stood at ¥120 at the time of the 4th MTMP announcement (July 2024), has been raised to ¥140. As of February 2026, cumulative total shareholder returns over the 5-year 4th MTMP are projected at ¥530 billion +α (¥360 billion in dividends and ¥170 billion in treasury stock acquisitions), up from the original plan of ¥380 billion +α (¥330 billion in dividends and ¥50 billion in treasury stock acquisitions) as of the announcement. Total shareholder returns confirmed to date stand at ¥380 billion. Additional shareholder returns will be considered from multiple perspectives, taking into account business progress.
| Item | At 4th MTMP Announcement (Jul 2024) | As of February 2026 |
|---|---|---|
| Annual dividend | ¥120 | ¥140 |
| Total dividends (5-year cumulative) | ¥330 billion | ¥360 billion |
| Treasury stock acquisition (5-year cumulative) | ¥50 billion | ¥170 billion |
| Total shareholder returns (5-year cumulative) | ¥380 billion +α | ¥530 billion +α |
Medium-Term Plan / Capital Allocation
Over the two-year period FY2024–FY2025, Otsuka generated operating cash flow before R&D investments of approximately ¥1.4 trillion, reaching about 50% of the five-year MTMP target and exceeding the plan’s assumption. Of this, R&D expenses totaled ¥635.0 billion, capital investment totaled ¥185.0 billion, external asset acquisitions totaled ¥290.0 billion, and shareholder returns totaled ¥260.0 billion. Incremental cash has been allocated roughly equally (50:50) between growth investments and shareholder returns, a balance the company intends to continue in order to further expand its corporate value enhancement cycle.
On the pipeline side, VOYXACT (sibeprenlimab) was approved in the US for IgA nephropathy during FY2025, and centanafadine, a first-in-class ADHD treatment (NDSRI), has been filed with the FDA and granted priority review, with a PDUFA action date of July 24, 2026. Zipalertinib is under rolling NDA submission in the US for 2nd-line treatment of EGFR Ex20ins non-small cell lung cancer.
This article is an analysis based on publicly available information and is not a recommendation to buy or sell any specific securities. Investment decisions are your own responsibility.
![[Obayashi] Investors’ Guide 2026 — The Complete 24-Article Breakdown](https://japan-equity.com/wp-content/uploads/2026/07/hub_cover-1024x1024.png)
![[Obayashi] IR & SR Policy — Feeding Dialogue Back into Management](https://japan-equity.com/wp-content/uploads/2026/07/p32_sq-1024x1024.jpg)
![[Obayashi] Real Estate Development — 18.7% Margin, ¥287.7bn Unrealized Gains](https://japan-equity.com/wp-content/uploads/2026/07/p20_sq-1024x1024.jpg)
![[Obayashi] Domestic Civil Engineering — Resilience Spending Supports 9.6% Margin](https://japan-equity.com/wp-content/uploads/2026/07/p11_sq-1024x1024.jpg)
![[Obayashi] Share Price & External Ratings — vs TOPIX, ESG Index Inclusion](https://japan-equity.com/wp-content/uploads/2026/07/p40_sq-1024x1024.jpg)
![[Construction] ¥75.5tn Investment, Shrinking Workforce — Big-5 Market Share](https://japan-equity.com/wp-content/uploads/2026/07/p12_sq-1024x1024.jpg)



![[Obayashi] Capital Policy & Shareholder Returns — ROE 10%+, DOE ~5%, ¥100bn Buyback](https://japan-equity.com/wp-content/uploads/2026/07/p27_sq-1024x1024.jpg)
![[Obayashi] Reducing Cross-Shareholdings — ¥285.2bn Sold in Five Years](https://japan-equity.com/wp-content/uploads/2026/07/p29_sq-1024x1024.jpg)
![[Obayashi] ¥750bn Investment Plan — ¥300bn to Development, ¥190bn to Tech/DX](https://japan-equity.com/wp-content/uploads/2026/07/p30_sq-1024x1024.jpg)
![[Obayashi] MTP2022 KPIs — Operating Profit ~2x Target, ROE 14.4%](https://japan-equity.com/wp-content/uploads/2026/07/p25_sq-1024x1024.jpg)
![[Obayashi] Cash Allocation — ¥420bn Investment CF Over Five Years](https://japan-equity.com/wp-content/uploads/2026/07/p26_sq-1024x1024.jpg)
![[Obayashi] Green Energy — 44 Plants, 344MW, and the Green Hydrogen Challenge](https://japan-equity.com/wp-content/uploads/2026/07/p21_sq-1024x1024.jpg)
![[Obayashi] Tackling the Labor Shortage — Robotics Construction®](https://japan-equity.com/wp-content/uploads/2026/07/p14_sq-1024x1024.jpg)
