
This article is based on publicly available IR materials and is not a recommendation to buy or sell any specific securities.
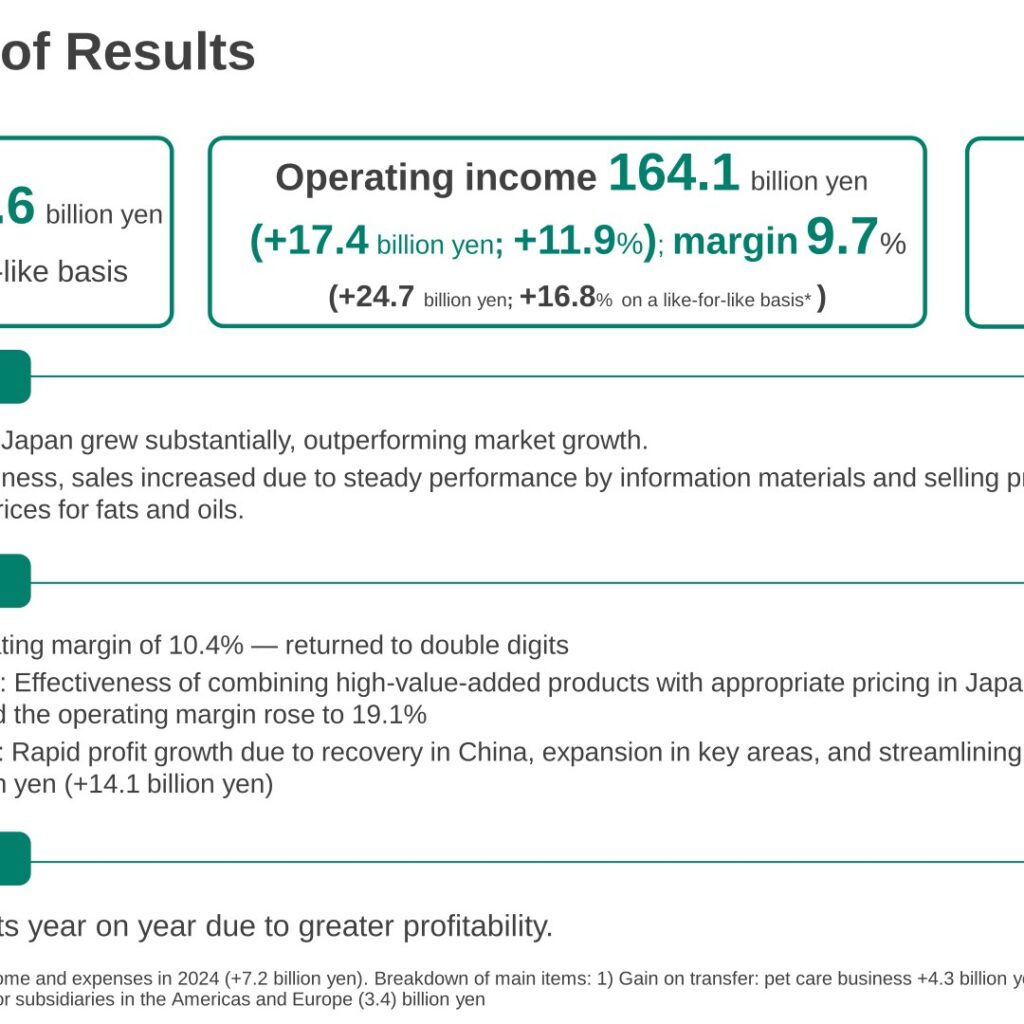
Kao Corporation reported consolidated net sales of 1,688.6 billion yen for the fiscal year ended December 31, 2025, up 3.7% year on year on a like-for-like basis. Operating income rose 11.9% to 164.1 billion yen (operating margin 9.7%, +0.7pts), and net income attributable to owners of the parent increased 11.4% to 120.1 billion yen. ROIC improved 0.5pts to 9.7%. For FY2026, Kao forecasts further growth in net sales, operating income and net income, together with a planned dividend increase for the 37th consecutive fiscal year and a 2-for-1 ordinary share split effective July 1, 2026.
Consolidated Results (Full-Year Actual)
Net sales grew 3.7% on a like-for-like basis, led by substantial growth in the GC Business in Japan and higher sales in the Chemical Business reflecting steady performance in information materials and selling price adjustments for rising raw material prices. Operating income increased 11.9% to 164.1 billion yen, with the operating margin up 0.7pts to 9.7%. Excluding the impact of one-time income and expenses recorded in FY2024 (+7.2 billion yen, comprising gains on transfer of the pet care and beverage businesses and structural reform expenses for subsidiaries in the Americas and Europe), like-for-like operating income growth was +24.7 billion yen (+16.8%).
| Item | FY2024 | FY2025 | Change |
|---|---|---|---|
| Net sales (¥bn) | 1,628.4 | 1,688.6 | +3.7% (of which like-for-like +3.7%, currency effect +0.0%); +60.2 (LFL +59.5, currency +0.7) |
| Gross profit (¥bn) | 638.4 | 668.2 | +4.7% (+29.8) |
| Gross margin (%) | 39.2% | 39.6% | +0.4pts |
| Operating income (¥bn) | 146.6 | 164.1 | +11.9% (+17.4) |
| Operating margin (%) | 9.0% | 9.7% | +0.7pts |
| Income before income taxes (¥bn) | 151.0 | 169.8 | +12.5% (+18.8) |
| Net income (¥bn) | 110.4 | 120.6 | +9.3% (+10.2) |
| Net income attributable to owners of the parent (¥bn) | 107.8 | 120.1 | +11.4% (+12.3) |
| EBITDA (¥bn) | 235.1 | 249.9 | +6.3% (+14.8) |
| Basic earnings per share (yen) | 231.94 | 260.30 | +12.2% (+28.36) |
| Cash dividends per share (yen) | 152.00 | 154.00 | +2.00 |
| Net cash flows from operating activities (¥bn) | 201.6 | 199.7 | (0.9%) ((1.9)) |
Segment Results
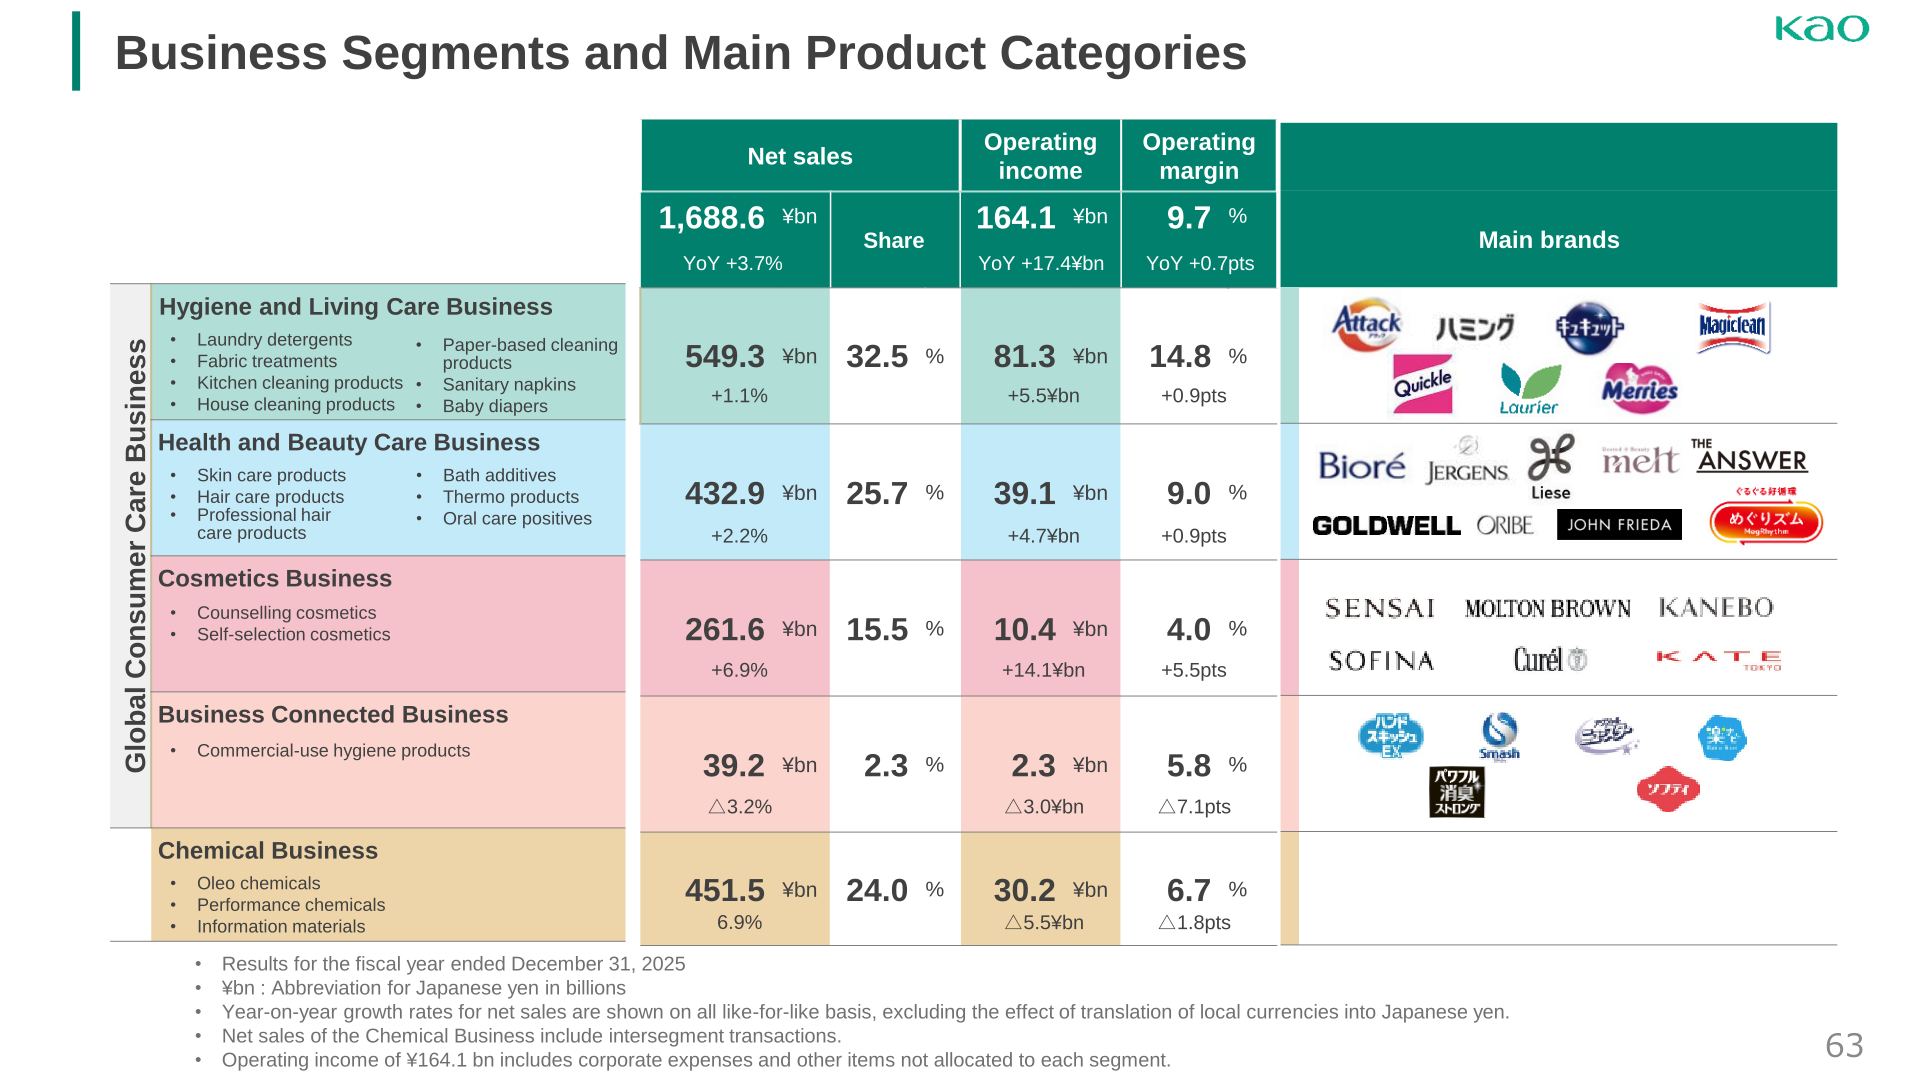
By segment, the GC Business’s operating margin returned to double digits at 10.4% (+1.5pts). Fabric & Home Care achieved an operating margin of 19.1%, driven by high-value-added products and selling price adjustments in Japan. The Cosmetics Business’s operating income rose 14.1 billion yen to 10.4 billion yen, driven by streamlining of fixed costs in Japan, a recovery in the China business and other factors, with the Japan cosmetics business returning to profitability. The Chemical Business’s operating income declined 5.5 billion yen to 30.2 billion yen, impacted by a decline in market demand for performance chemicals, shrinking margins for oleo chemicals, and inventory valuation losses.
| Segment | Net Sales (¥bn, FY2025) | Net Sales Change (Like-for-like) | Operating Income (¥bn, FY2025) | Operating Income Change (¥bn) | Operating Margin (FY2025) |
|---|---|---|---|---|---|
| Fabric & Home Care | 389.1 | +3.4% | 74.1 | +5.7 | 19.1% |
| Sanitary | 160.2 | (4.0%) | 7.1 | (0.2) | 4.5% |
| Hygiene Living Care Business | 549.3 | +1.1% | 81.3 | +5.5 | 14.8% |
| Health Beauty Care Business | 432.9 | +2.2% | 39.1 | +4.7 | 9.0% |
| Cosmetics Business | 261.6 | +6.9% | 10.4 | +14.1 | 4.0% |
| Business Connected Business | 39.2 | (3.2%) | 2.3 | (3.0) | 5.8% |
| GC Business | 1,283.0 | +2.5% | 133.1 | +21.3 | 10.4% |
| Chemical Business | 451.5 | +6.9% | 30.2 | (5.5) | 6.7% |
| Consolidated | 1,688.6 | +3.7% | 164.1 | +17.4 | 9.7% |
FY2026 Forecast
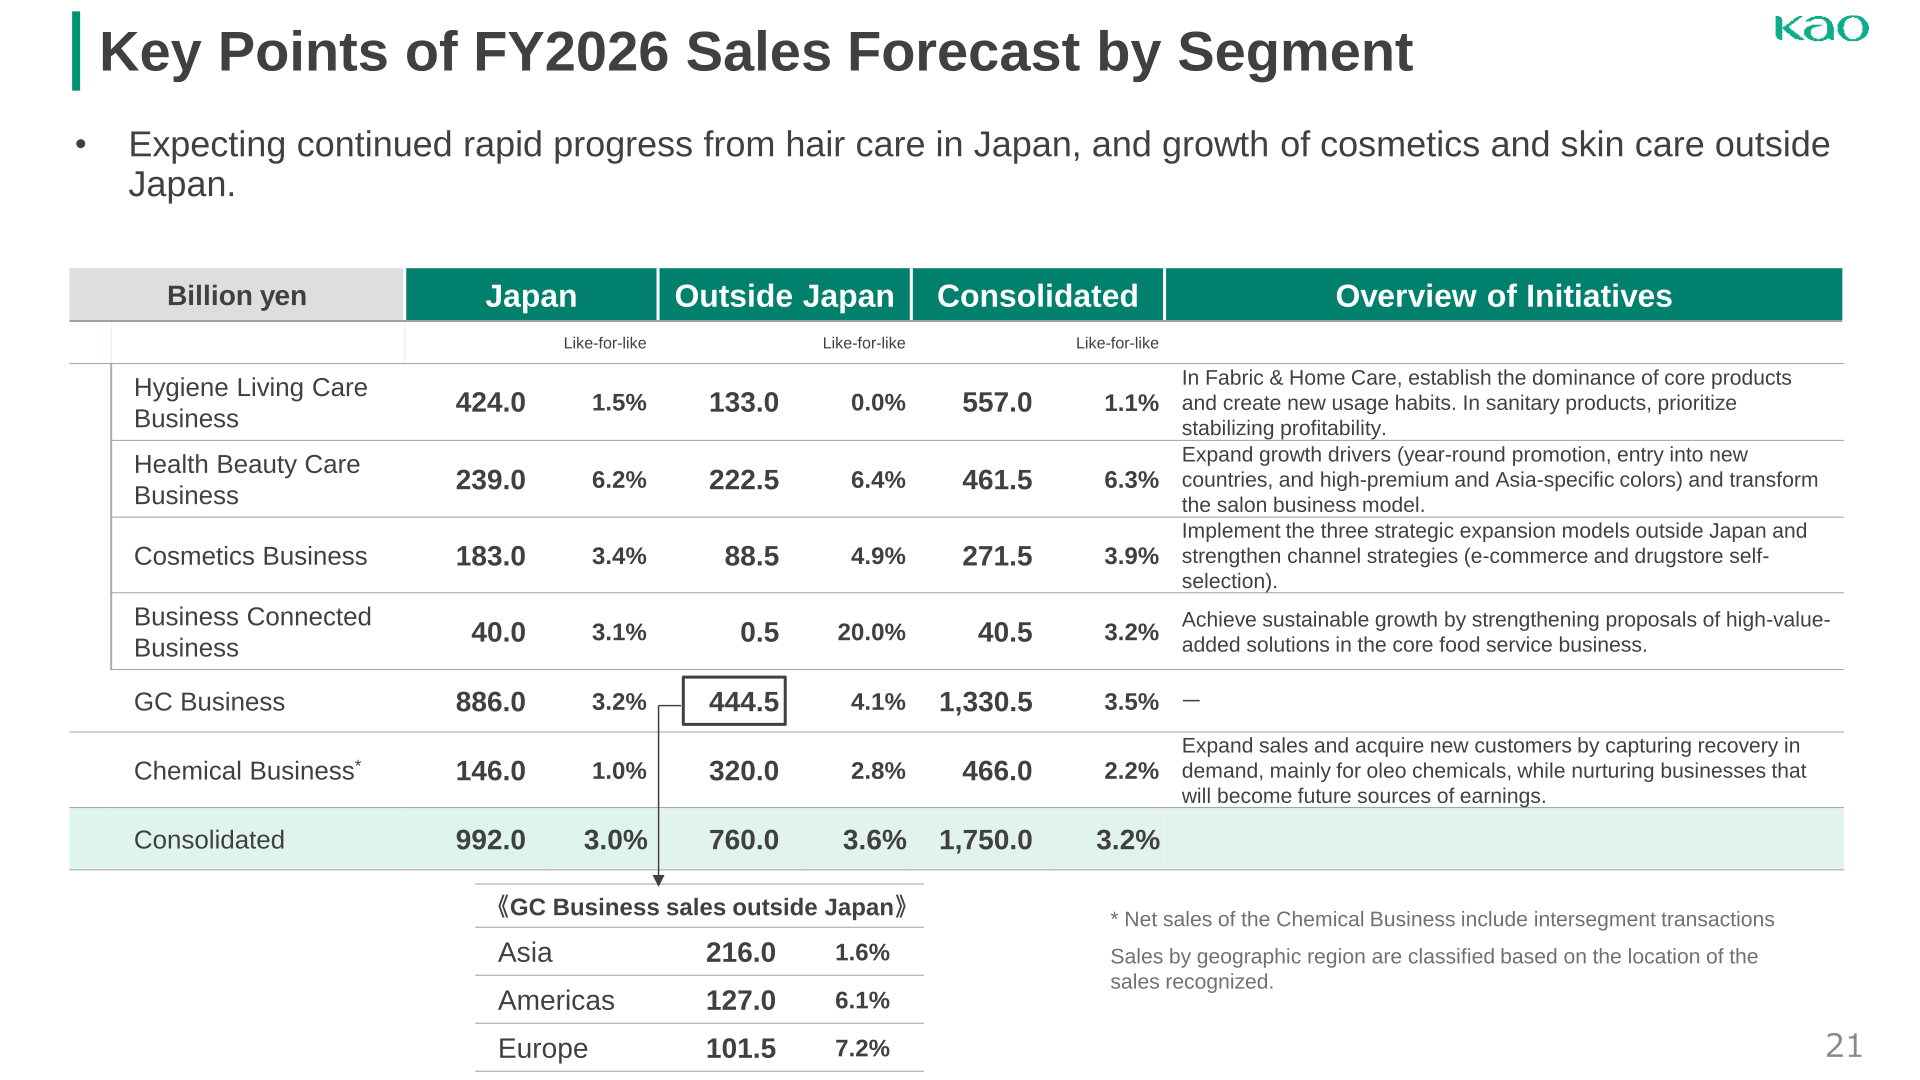
For FY2026, Kao forecasts consolidated net sales of 1,750.0 billion yen (+3.6%, of which like-for-like +3.2%), operating income of 182.0 billion yen (+10.9%, operating margin 10.4%), and net income attributable to owners of the parent of 130.0 billion yen (+8.3%). ROE is forecast to improve to 12.0% (+0.7pts). The forecast is based on exchange rate assumptions of 150 yen/USD, 175 yen/Euro and 21 yen/Yuan, and does not take into account the impact of the 2-for-1 ordinary share split scheduled to take effect on July 1, 2026. Kao aims to achieve operating income growth of more than 17.0 billion yen through improved earning power, planning above-market volume growth led mainly by hair care in Japan and UV care in the Americas, while mitigating the impact of rising personnel and logistics costs through proactive selling price adjustments aligned with high-value-added products.
| Item | FY2025 (Actual) | FY2026 (Forecast) | Change |
|---|---|---|---|
| Net sales (¥bn) | 1,688.6 | 1,750.0 | +3.6% (of which like-for-like +3.2%, currency effect +0.4%); +61.4 (LFL +53.6, currency +7.8) |
| Operating income (¥bn) | 164.1 | 182.0 | +10.9% (+17.9) |
| Operating margin (%) | 9.7% | 10.4% | +0.7pts |
| Income before income taxes (¥bn) | 169.8 | 185.0 | +8.9% (+15.2) |
| Net income attributable to owners of the parent (¥bn) | 120.1 | 130.0 | +8.3% (+9.9) |
| EBITDA (¥bn) | 249.9 | 270.0 | +8.0% (+20.1) |
| ROE (%) | 11.3% | 12.0% | +0.7pts |
| Basic core earnings per share (yen) | 260.30 | 287.41 | +10.4% (+27.11) |
| Cash dividends per share (yen) | 154.00 | 156.00 | +2.00 |
Shareholder Returns
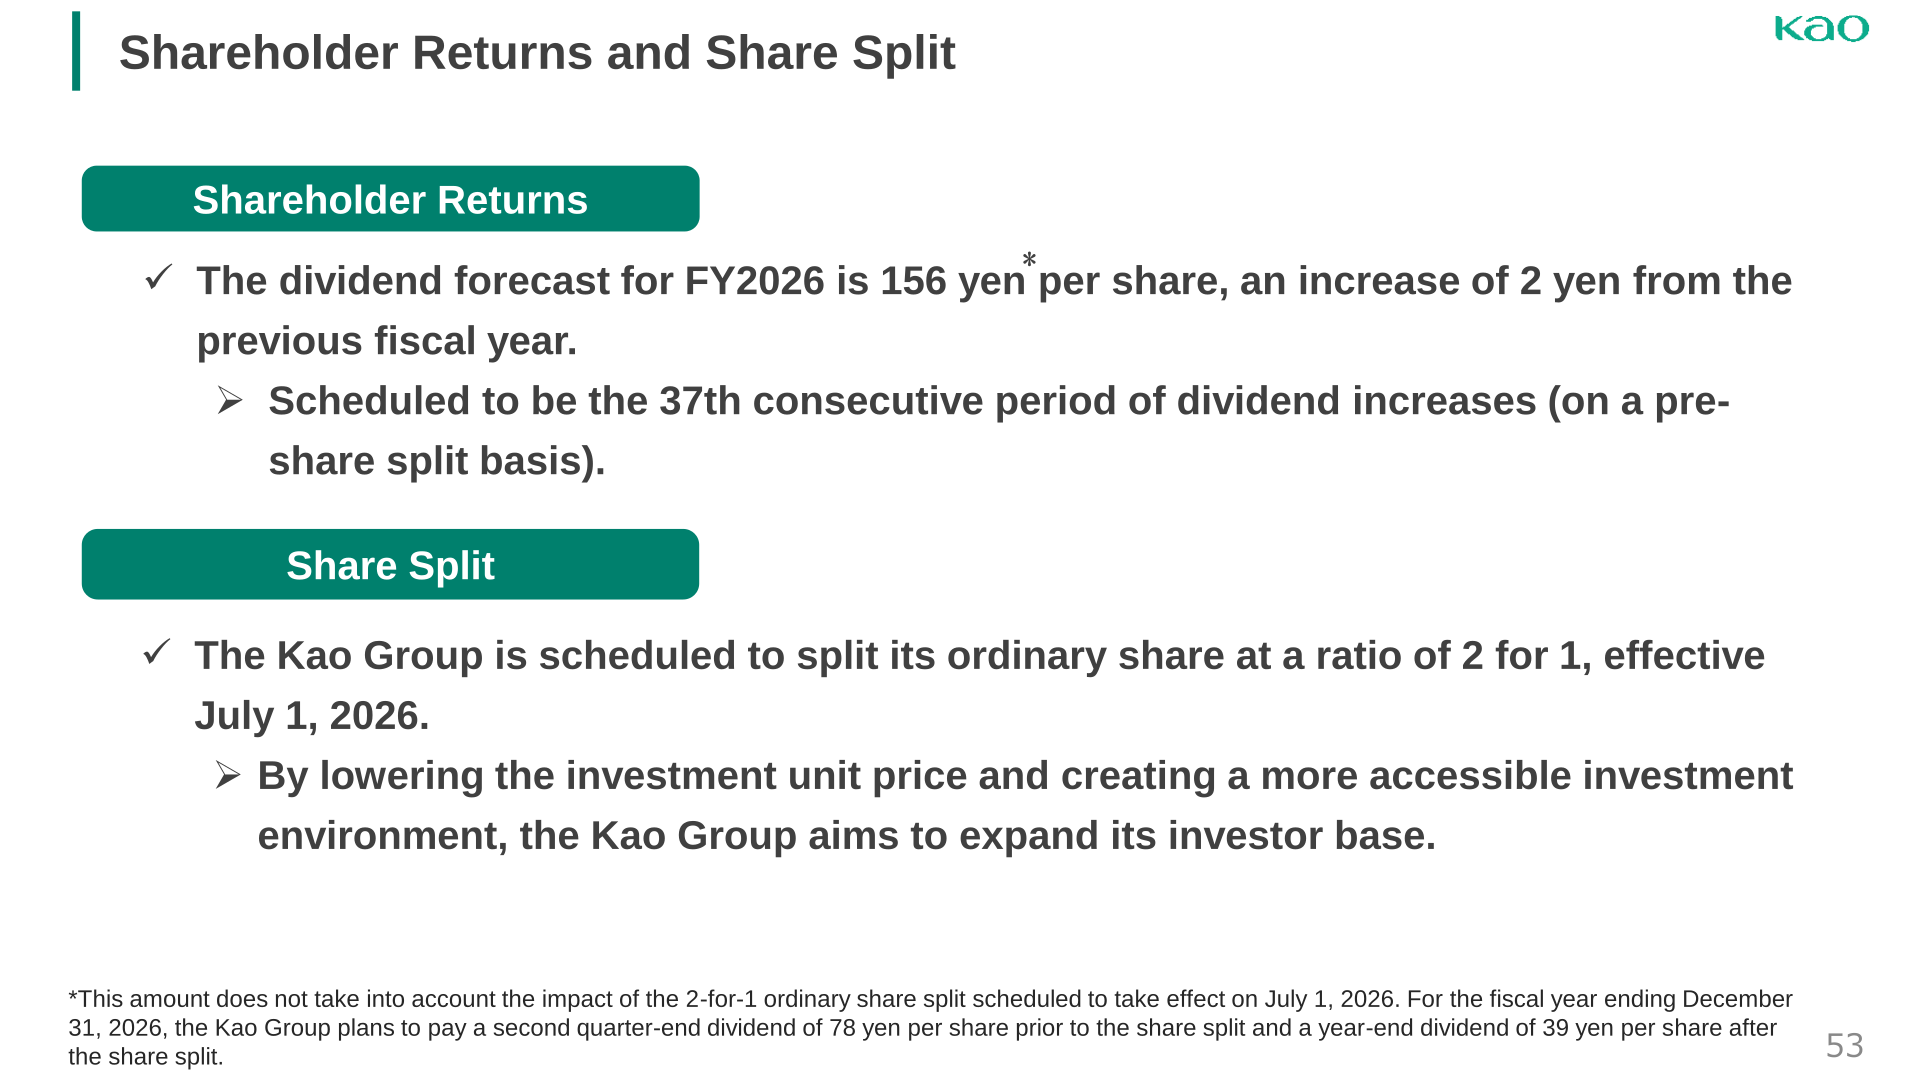
Kao plans a cash dividend of 156 yen per share for FY2026 (+2 yen year on year, on a pre-share-split basis), which is scheduled to mark the 37th consecutive fiscal year of dividend increases. The Kao Group is scheduled to conduct a 2-for-1 split of its ordinary shares effective July 1, 2026, aimed at lowering the investment unit price and creating a more accessible investment environment to expand its investor base; for FY2026, the Group plans to pay a second quarter-end dividend of 78 yen per share on a pre-split basis and a year-end dividend of 39 yen per share on a post-split basis. In FY2025, Kao carried out share repurchases totaling 80.0 billion yen together with retirement of shares. Under its capital allocation guideline, and underpinned by its capacity to generate more than 200 billion yen in operating cash flow annually, Kao allocates approximately 40% to strategic investments including M&A (also including share repurchases), approximately 30% to capital expenditures for future growth, and approximately 30% to steady and continuous dividend increases.
Medium-Term Plan “K27” Progress
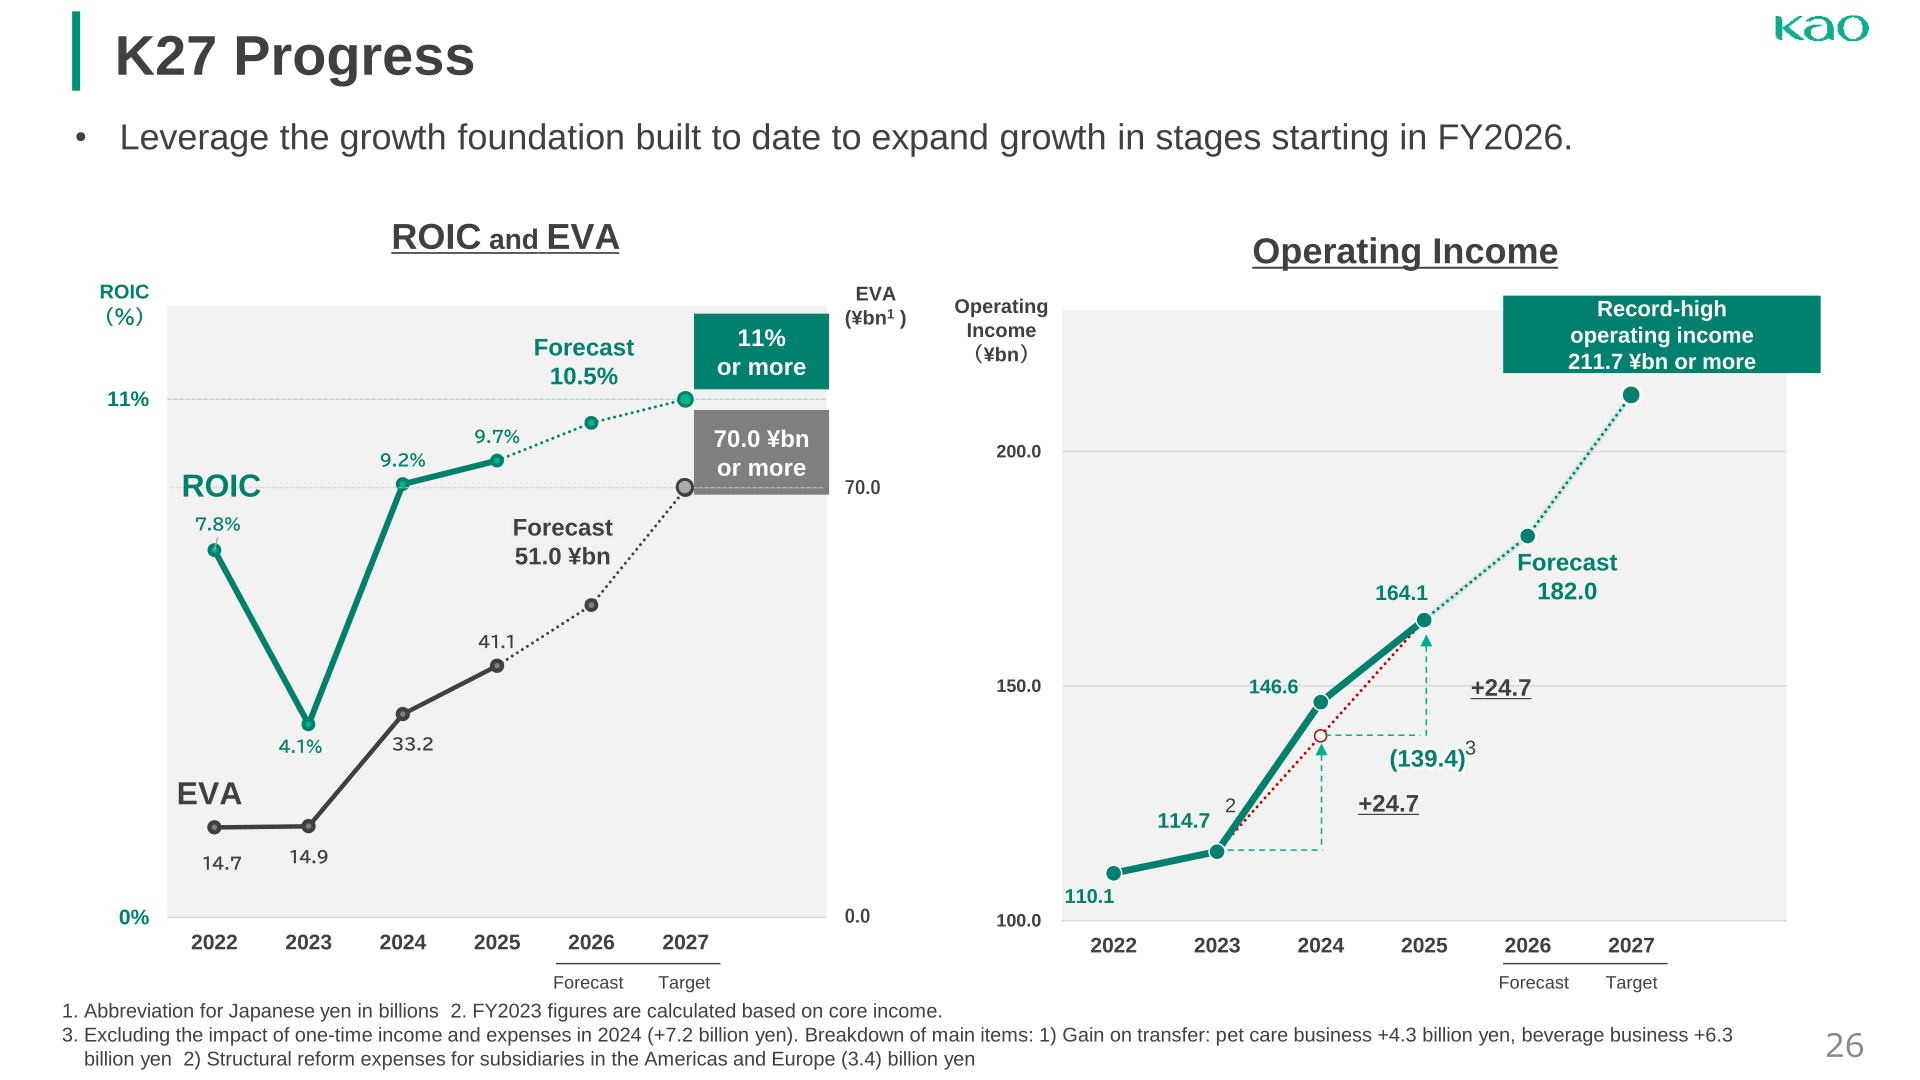
Kao is progressing as planned toward the targets of its medium-term plan “K27.” In FY2025, ROIC was 9.7% (FY2027 target: 11.0% or more), EVA was 41.1 billion yen (FY2027 target: 70.0 billion yen or more), operating income was 164.1 billion yen (FY2027 target: record-high operating income, exceeding the FY2019 record of 211.7 billion yen), and sales outside Japan were 725.2 billion yen (FY2027 target: 800.0 billion yen or more, sales CAGR +4.3%). For FY2026, Kao forecasts ROIC of 10.5%, EVA of 51.0 billion yen, operating income of 182.0 billion yen, and sales outside Japan of 760.0 billion yen.
| Metric | FY2024 Results | FY2025 Results | FY2026 Forecast | FY2027 Target |
|---|---|---|---|---|
| ROIC | 9.2% | 9.7% | 10.5% | 11.0% or more |
| EVA (¥bn) | 33.2 | 41.1 | 51.0 | 70.0 or more |
| Operating income (¥bn) | 146.6 | 164.1 | 182.0 | Record-high operating income (FY2019: 211.7¥bn) |
| Sales outside Japan (¥bn) | 705.5 | 725.2 | 760.0 | 800.0 or more (Sales CAGR +4.3%) |
This article is an analysis based on publicly available information and is not a recommendation to buy or sell any specific securities. Investment decisions are your own responsibility.
![[Obayashi] Investors’ Guide 2026 — The Complete 24-Article Breakdown](https://japan-equity.com/wp-content/uploads/2026/07/hub_cover-1024x1024.png)
![[Obayashi] IR & SR Policy — Feeding Dialogue Back into Management](https://japan-equity.com/wp-content/uploads/2026/07/p32_sq-1024x1024.jpg)
![[Obayashi] Domestic Civil Engineering — Resilience Spending Supports 9.6% Margin](https://japan-equity.com/wp-content/uploads/2026/07/p11_sq-1024x1024.jpg)
![[Obayashi] Overseas Construction — Orders Reach ¥1.2tn](https://japan-equity.com/wp-content/uploads/2026/07/p15_sq-1024x1024.jpg)
![[Obayashi] Share Price & External Ratings — vs TOPIX, ESG Index Inclusion](https://japan-equity.com/wp-content/uploads/2026/07/p40_sq-1024x1024.jpg)
![[Construction] ¥75.5tn Investment, Shrinking Workforce — Big-5 Market Share](https://japan-equity.com/wp-content/uploads/2026/07/p12_sq-1024x1024.jpg)



![[Obayashi] Capital Policy & Shareholder Returns — ROE 10%+, DOE ~5%, ¥100bn Buyback](https://japan-equity.com/wp-content/uploads/2026/07/p27_sq-1024x1024.jpg)
![[Obayashi] Reducing Cross-Shareholdings — ¥285.2bn Sold in Five Years](https://japan-equity.com/wp-content/uploads/2026/07/p29_sq-1024x1024.jpg)
![[Obayashi] ¥750bn Investment Plan — ¥300bn to Development, ¥190bn to Tech/DX](https://japan-equity.com/wp-content/uploads/2026/07/p30_sq-1024x1024.jpg)
![[Obayashi] MTP2022 KPIs — Operating Profit ~2x Target, ROE 14.4%](https://japan-equity.com/wp-content/uploads/2026/07/p25_sq-1024x1024.jpg)
![[Obayashi] Cash Allocation — ¥420bn Investment CF Over Five Years](https://japan-equity.com/wp-content/uploads/2026/07/p26_sq-1024x1024.jpg)
![[Obayashi] Green Energy — 44 Plants, 344MW, and the Green Hydrogen Challenge](https://japan-equity.com/wp-content/uploads/2026/07/p21_sq-1024x1024.jpg)
![[Obayashi] Tackling the Labor Shortage — Robotics Construction®](https://japan-equity.com/wp-content/uploads/2026/07/p14_sq-1024x1024.jpg)
