
This article is based on publicly available IR materials and is not a recommendation to buy or sell any specific securities.
Mitsui O.S.K. Lines (MOL) reported consolidated FY2025 results (fiscal year ended March 31, 2026) with revenue of ¥1,825.0 billion, up ¥49.6 billion year on year, and ordinary profit of ¥175.8 billion, down ¥243.8 billion from FY2024’s ¥419.7 billion. Net income was ¥213.2 billion, down ¥212.2 billion year on year but ¥13.2 billion above the previous forecast of ¥200.0 billion. MOL notes the year-on-year decline mainly reflects that FY2024 figures included the finalization of provisional accounting treatment for a business combination. For FY2026, MOL forecasts ordinary profit of ¥145.0 billion and net income of ¥170.0 billion, and plans to raise the annual dividend to ¥205 per share from ¥200 per share in FY2025.
Consolidated Results (Full-Year Actual)
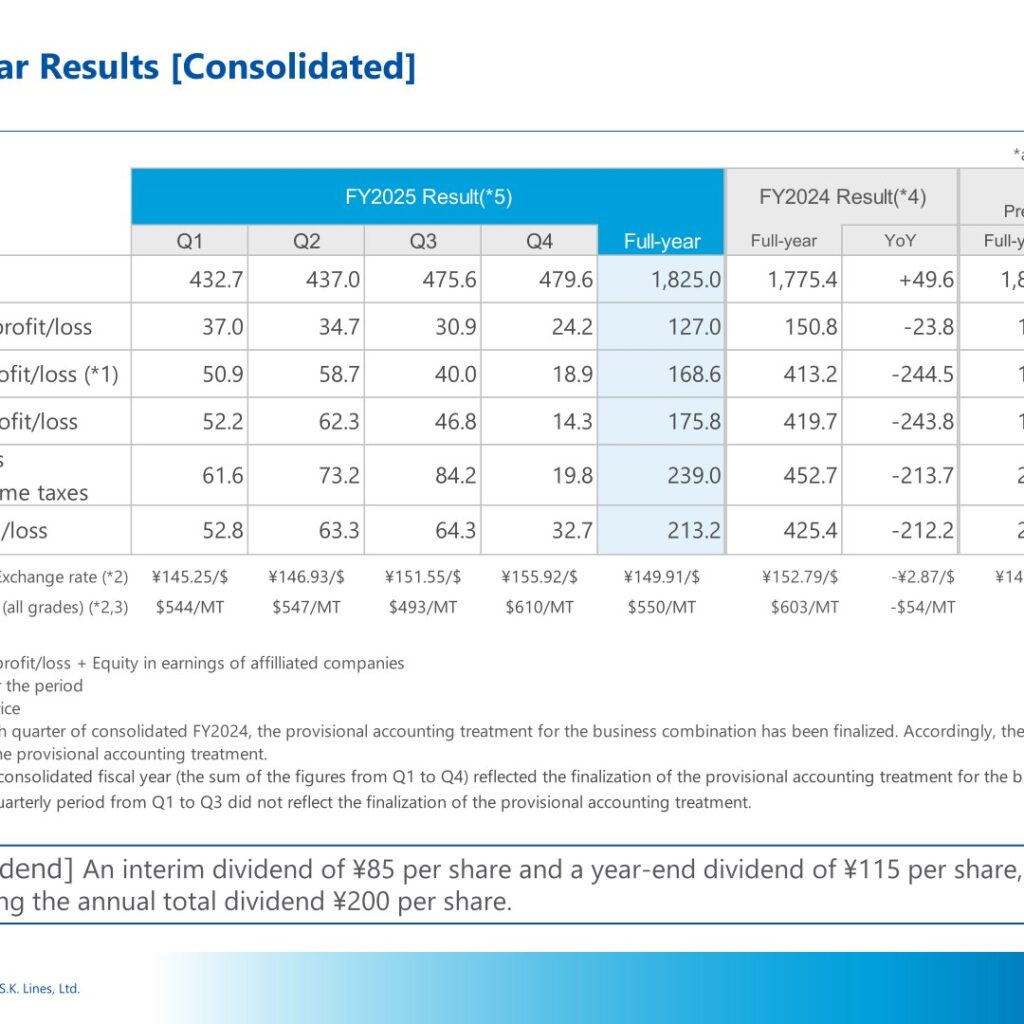
For FY2025 (fiscal year ended March 31, 2026), revenue rose ¥49.6 billion year on year to ¥1,825.0 billion, ¥4.9 billion below the previous forecast of ¥1,830.0 billion. Operating profit was ¥127.0 billion, down ¥23.8 billion year on year but ¥2.0 billion above forecast. Business profit (operating profit plus equity in earnings of affiliated companies) was ¥168.6 billion, down ¥244.5 billion year on year and ¥10.3 billion below forecast. Ordinary profit was ¥175.8 billion, down ¥243.8 billion year on year and ¥4.1 billion below forecast. Net income was ¥213.2 billion, down ¥212.2 billion year on year but ¥13.2 billion above the previous forecast of ¥200.0 billion. MOL states that in the fourth quarter of FY2024, the provisional accounting treatment for a business combination was finalized, and the FY2024 figures reflect that finalization; the FY2025 full-year figures also reflect the finalization, whereas the Q1–Q3 FY2025 quarterly figures did not. The average exchange rate for FY2025 was ¥149.91/US$ (FY2024: ¥152.79/US$), and the average bunker price (all grades) was $550/MT (FY2024: $603/MT). The interim dividend was ¥85 per share and the year-end dividend ¥115 per share, for an annual total of ¥200 per share.
| Item | FY2025 (Result) | FY2024 (Result) | YoY Change | FY2025 (Previous Forecast) | Variance vs Forecast |
|---|---|---|---|---|---|
| Revenue (¥bn) | 1,825.0 | 1,775.4 | +49.6 | 1,830.0 | -4.9 |
| Operating Profit/Loss (¥bn) | 127.0 | 150.8 | -23.8 | 125.0 | +2.0 |
| Business Profit/Loss (¥bn) | 168.6 | 413.2 | -244.5 | 179.0 | -10.3 |
| Ordinary Profit/Loss (¥bn) | 175.8 | 419.7 | -243.8 | 180.0 | -4.1 |
| Income before Income Taxes (¥bn) | 239.0 | 452.7 | -213.7 | 240.0 | -0.9 |
| Net Income/Loss (¥bn) | 213.2 | 425.4 | -212.2 | 200.0 | +13.2 |
| Exchange Rate, Average (¥/US$) | 149.91 | 152.79 | -2.87 | 148.94 | +0.97 |
| Bunker Price, All Grades, Average ($/MT) | 550 | 603 | -54 | – | – |
Segment Results
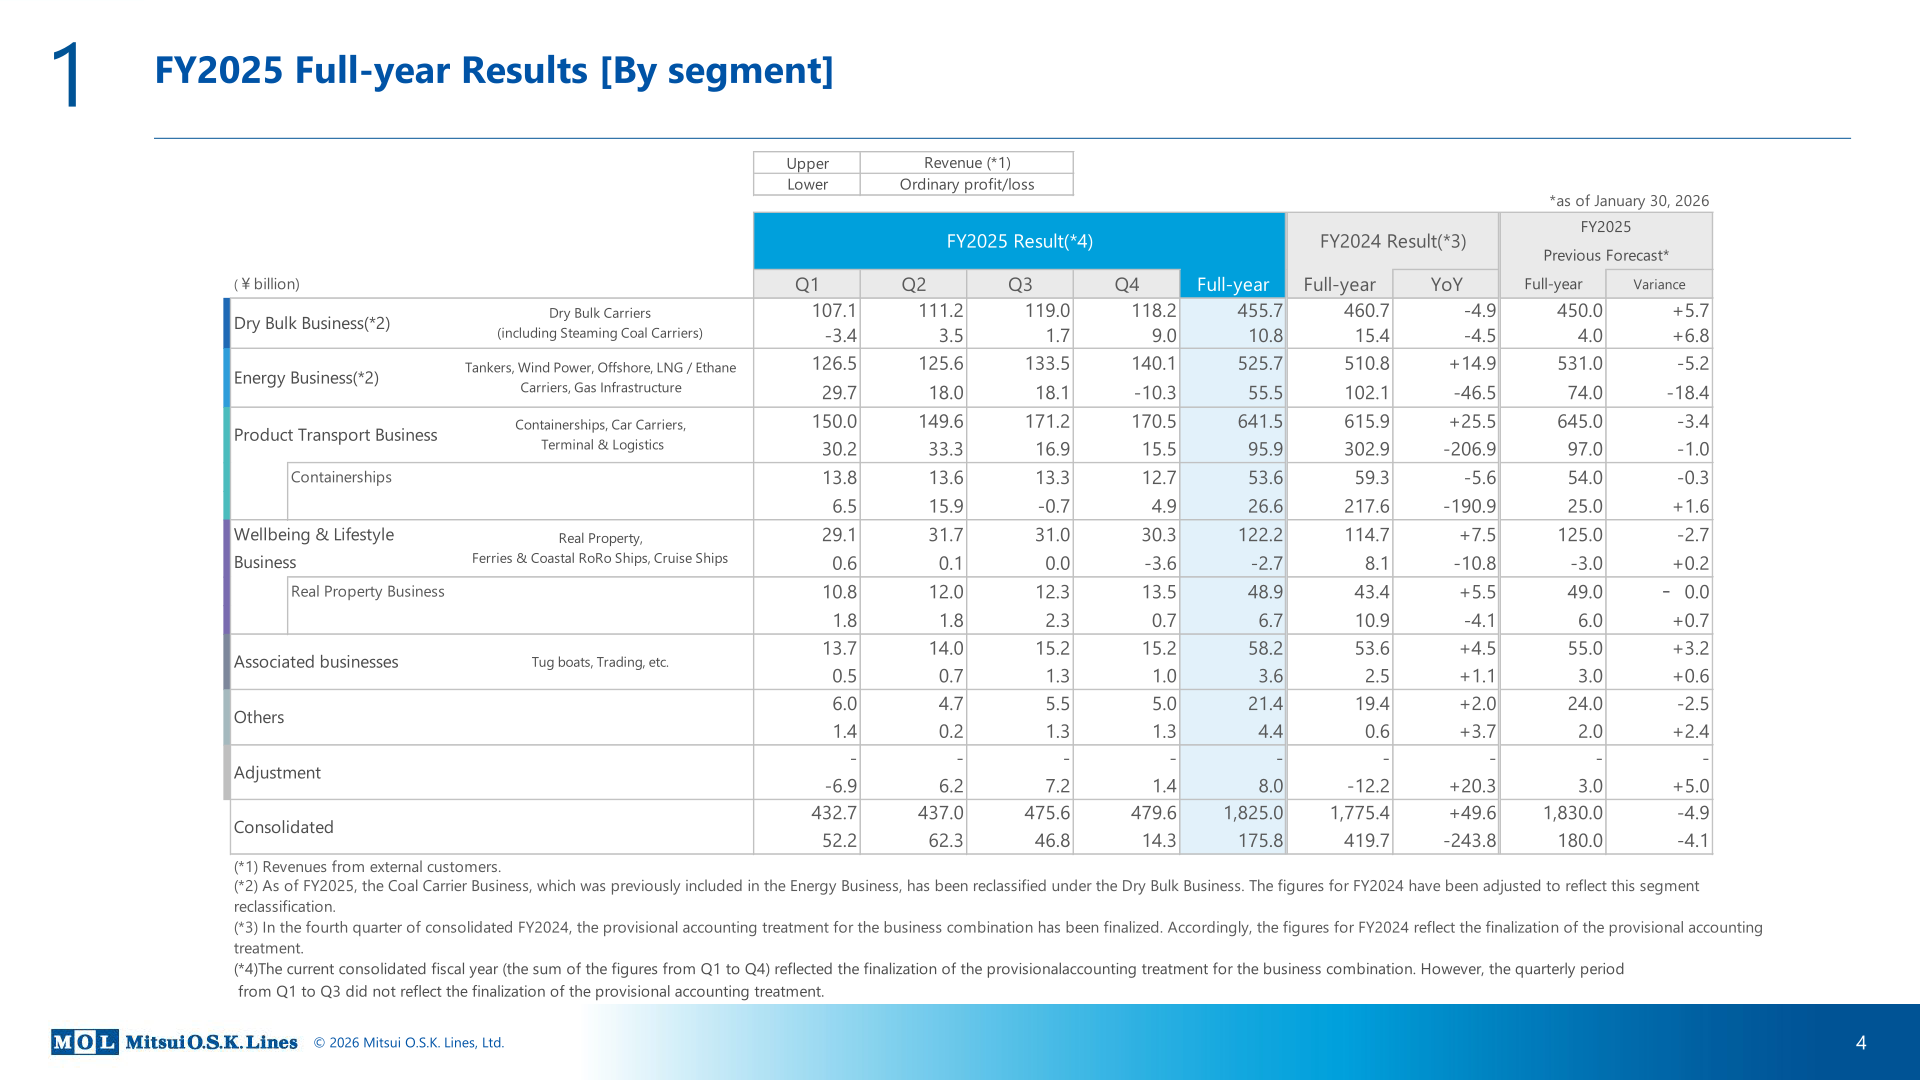
By segment, the Dry Bulk Business posted ordinary profit of ¥10.8 billion (FY2024: ¥15.4 billion), ¥6.8 billion above the previous forecast, helped by increased Panamax and smaller-vessel demand from China, increased South American grain shipments, and derivative valuation gains. The Energy Business posted ordinary profit of ¥55.5 billion (FY2024: ¥102.1 billion), ¥18.4 billion below forecast, due to one-off expenses at equity-method affiliates in the Chemical Tankers business (lump-sum goodwill amortization) and in LNG/Ethane Carriers (finance-related factors); MOL notes the impact of the Middle East situation on FY2025 profit was relatively limited. The Product Transport Business posted ordinary profit of ¥95.9 billion (FY2024: ¥302.9 billion), ¥1.0 billion below forecast, as improved Containerships earnings ahead of the Chinese New Year holiday were offset by lower Car Carrier fleet deployment efficiency and higher operating costs linked to the Middle East situation; within this segment, Containerships ordinary profit was ¥26.6 billion (FY2024: ¥217.6 billion). The Wellbeing & Lifestyle Business posted an ordinary loss of ¥2.7 billion (FY2024: profit of ¥8.1 billion), ¥0.2 billion better than forecast, as lower Real Property-related expenses were partly offset by a delayed recovery in Cruise passenger numbers; Real Property Business ordinary profit within this segment was ¥6.7 billion (FY2024: ¥10.9 billion). Associated Businesses posted ordinary profit of ¥3.6 billion (FY2024: ¥2.5 billion), ¥0.6 billion above forecast, driven by steady growth in Tugboat work orders.
| Segment | Metric | FY2025 (Result, ¥bn) | FY2024 (Result, ¥bn) |
|---|---|---|---|
| Dry Bulk Business | Revenue | 455.7 | 460.7 |
| Dry Bulk Business | Ordinary Profit/Loss | 10.8 | 15.4 |
| Energy Business | Revenue | 525.7 | 510.8 |
| Energy Business | Ordinary Profit/Loss | 55.5 | 102.1 |
| Product Transport Business | Revenue | 641.5 | 615.9 |
| Product Transport Business | Ordinary Profit/Loss | 95.9 | 302.9 |
| – Containerships (within Product Transport) | Revenue | 53.6 | 59.3 |
| – Containerships (within Product Transport) | Ordinary Profit/Loss | 26.6 | 217.6 |
| Wellbeing & Lifestyle Business | Revenue | 122.2 | 114.7 |
| Wellbeing & Lifestyle Business | Ordinary Profit/Loss | -2.7 | 8.1 |
| – Real Property Business (within Wellbeing & Lifestyle) | Revenue | 48.9 | 43.4 |
| – Real Property Business (within Wellbeing & Lifestyle) | Ordinary Profit/Loss | 6.7 | 10.9 |
| Associated Businesses | Revenue | 58.2 | 53.6 |
| Associated Businesses | Ordinary Profit/Loss | 3.6 | 2.5 |
| Others | Revenue | 21.4 | 19.4 |
| Others | Ordinary Profit/Loss | 4.4 | 0.6 |
| Adjustment | Ordinary Profit/Loss | 8.0 | -12.2 |
| Consolidated | Revenue | 1,825.0 | 1,775.4 |
| Consolidated | Ordinary Profit/Loss | 175.8 | 419.7 |
FY2026 Forecast
For FY2026, MOL forecasts consolidated revenue of ¥2,040.0 billion (+¥214.9 billion year on year), operating profit of ¥105.0 billion (-¥22.0 billion), business profit of ¥170.0 billion (+¥1.3 billion), ordinary profit of ¥145.0 billion (-¥30.8 billion), income before income taxes of ¥200.0 billion (-¥39.0 billion), and net income of ¥170.0 billion (-¥43.2 billion). The forecast assumes an average exchange rate of ¥150.77/US$ (FY2025: ¥149.91/US$) and an average VLSFO bunker price of $655/MT (FY2025: $531/MT). From FY2026, the fiscal year-end of consolidated subsidiaries previously closing on a date other than March 31 will be aligned to March 31; accordingly, the FY2026 forecast includes the results of such subsidiaries for the 15-month period from January 1, 2026 to March 31, 2027. At the start of FY2026, MOL’s sensitivity analysis indicated ordinary income sensitivity of ±¥1.8 billion per ¥1/US$ change in the exchange rate and ±¥0.07 billion per $1/MT change in the VLSFO bunker price, and the forecast assumes navigation around the Strait of Hormuz will be largely normalized in July 2026.
| Item | FY2026 (Forecast) | FY2025 (Result) | YoY Change |
|---|---|---|---|
| Revenue (¥bn) | 2,040.0 | 1,825.0 | +214.9 |
| Operating Profit/Loss (¥bn) | 105.0 | 127.0 | -22.0 |
| Business Profit/Loss (¥bn) | 170.0 | 168.6 | +1.3 |
| Ordinary Profit/Loss (¥bn) | 145.0 | 175.8 | -30.8 |
| Income before Income Taxes (¥bn) | 200.0 | 239.0 | -39.0 |
| Net Income/Loss (¥bn) | 170.0 | 213.2 | -43.2 |
| Exchange Rate, Average (¥/US$) | 150.77 | 149.91 | +0.86 |
| Bunker Price VLSFO, Average ($/MT) | 655 | 531 | +124 |
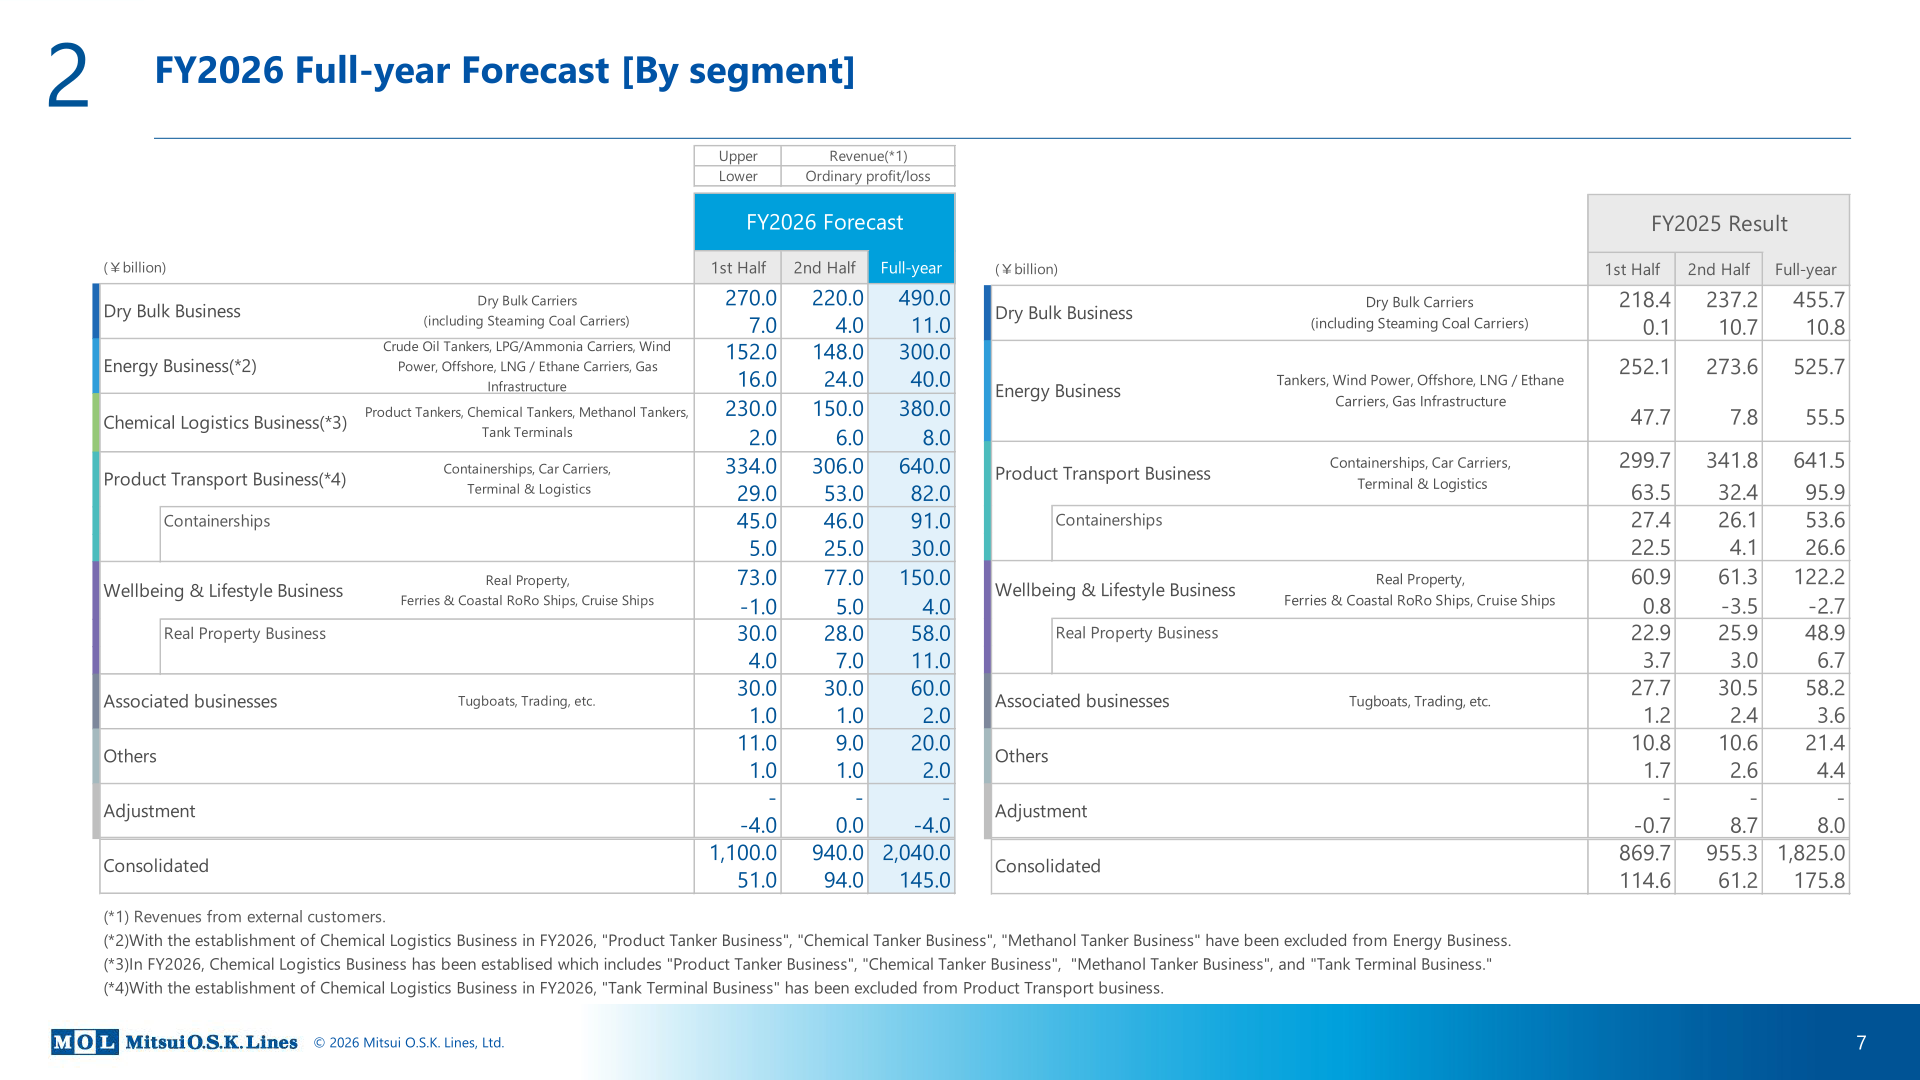
From FY2026, MOL has newly established the Chemical Logistics Business (Product Tankers, Chemical Tankers, Methanol Tankers, and Tank Terminals), which had previously been included within the Energy Business and Product Transport Business; the FY2025 comparison figures for Energy Business and Product Transport Business in the table below reflect the previous, broader segment definitions and have not been restated. On the new basis, FY2026 ordinary profit is forecast at: Dry Bulk Business ¥11.0 billion (+¥0.2 billion year on year), supported by steady Capesize iron ore and bauxite shipments and limited newbuilding deliveries, partly offset by higher fuel costs for Panamax and smaller vessels linked to the Middle East situation; Energy Business ¥40.0 billion, helped by a tighter crude tanker supply-demand balance and stable LNG/Ethane Carrier profit contribution (absence of the prior year’s one-off equity-method affiliate expenses), while Chemical Tankers face route constraints and higher fuel costs; Chemical Logistics Business ¥8.0 billion (-¥7.5 billion year on year), mainly due to increased Tank Terminal goodwill amortization following the LBC acquisition; Product Transport Business ¥82.0 billion (-¥13.9 billion), as Car Carriers and ONE face fleet deployment impacts and higher fuel costs from the Middle East situation plus increased newbuilding deliveries; Wellbeing & Lifestyle Business ¥4.0 billion (+¥6.7 billion), helped by completion of newly acquired Real Property assets and capital-gain investment contributions; and Associated Businesses ¥2.0 billion (-¥1.6 billion), reflecting higher Tugboat fuel costs.
| Segment | Metric | FY2026 (Forecast, ¥bn) |
|---|---|---|
| Dry Bulk Business | Revenue | 490.0 |
| Dry Bulk Business | Ordinary Profit/Loss | 11.0 |
| Energy Business | Revenue | 300.0 |
| Energy Business | Ordinary Profit/Loss | 40.0 |
| Chemical Logistics Business (new for FY2026) | Revenue | 380.0 |
| Chemical Logistics Business (new for FY2026) | Ordinary Profit/Loss | 8.0 |
| Product Transport Business | Revenue | 640.0 |
| Product Transport Business | Ordinary Profit/Loss | 82.0 |
| – Containerships (within Product Transport) | Revenue | 91.0 |
| – Containerships (within Product Transport) | Ordinary Profit/Loss | 30.0 |
| Wellbeing & Lifestyle Business | Revenue | 150.0 |
| Wellbeing & Lifestyle Business | Ordinary Profit/Loss | 4.0 |
| – Real Property Business (within Wellbeing & Lifestyle) | Revenue | 58.0 |
| – Real Property Business (within Wellbeing & Lifestyle) | Ordinary Profit/Loss | 11.0 |
| Associated Businesses | Revenue | 60.0 |
| Associated Businesses | Ordinary Profit/Loss | 2.0 |
| Others | Revenue | 20.0 |
| Others | Ordinary Profit/Loss | 2.0 |
| Adjustment | Ordinary Profit/Loss | -4.0 |
| Consolidated | Revenue | 2,040.0 |
| Consolidated | Ordinary Profit/Loss | 145.0 |
Shareholder Returns
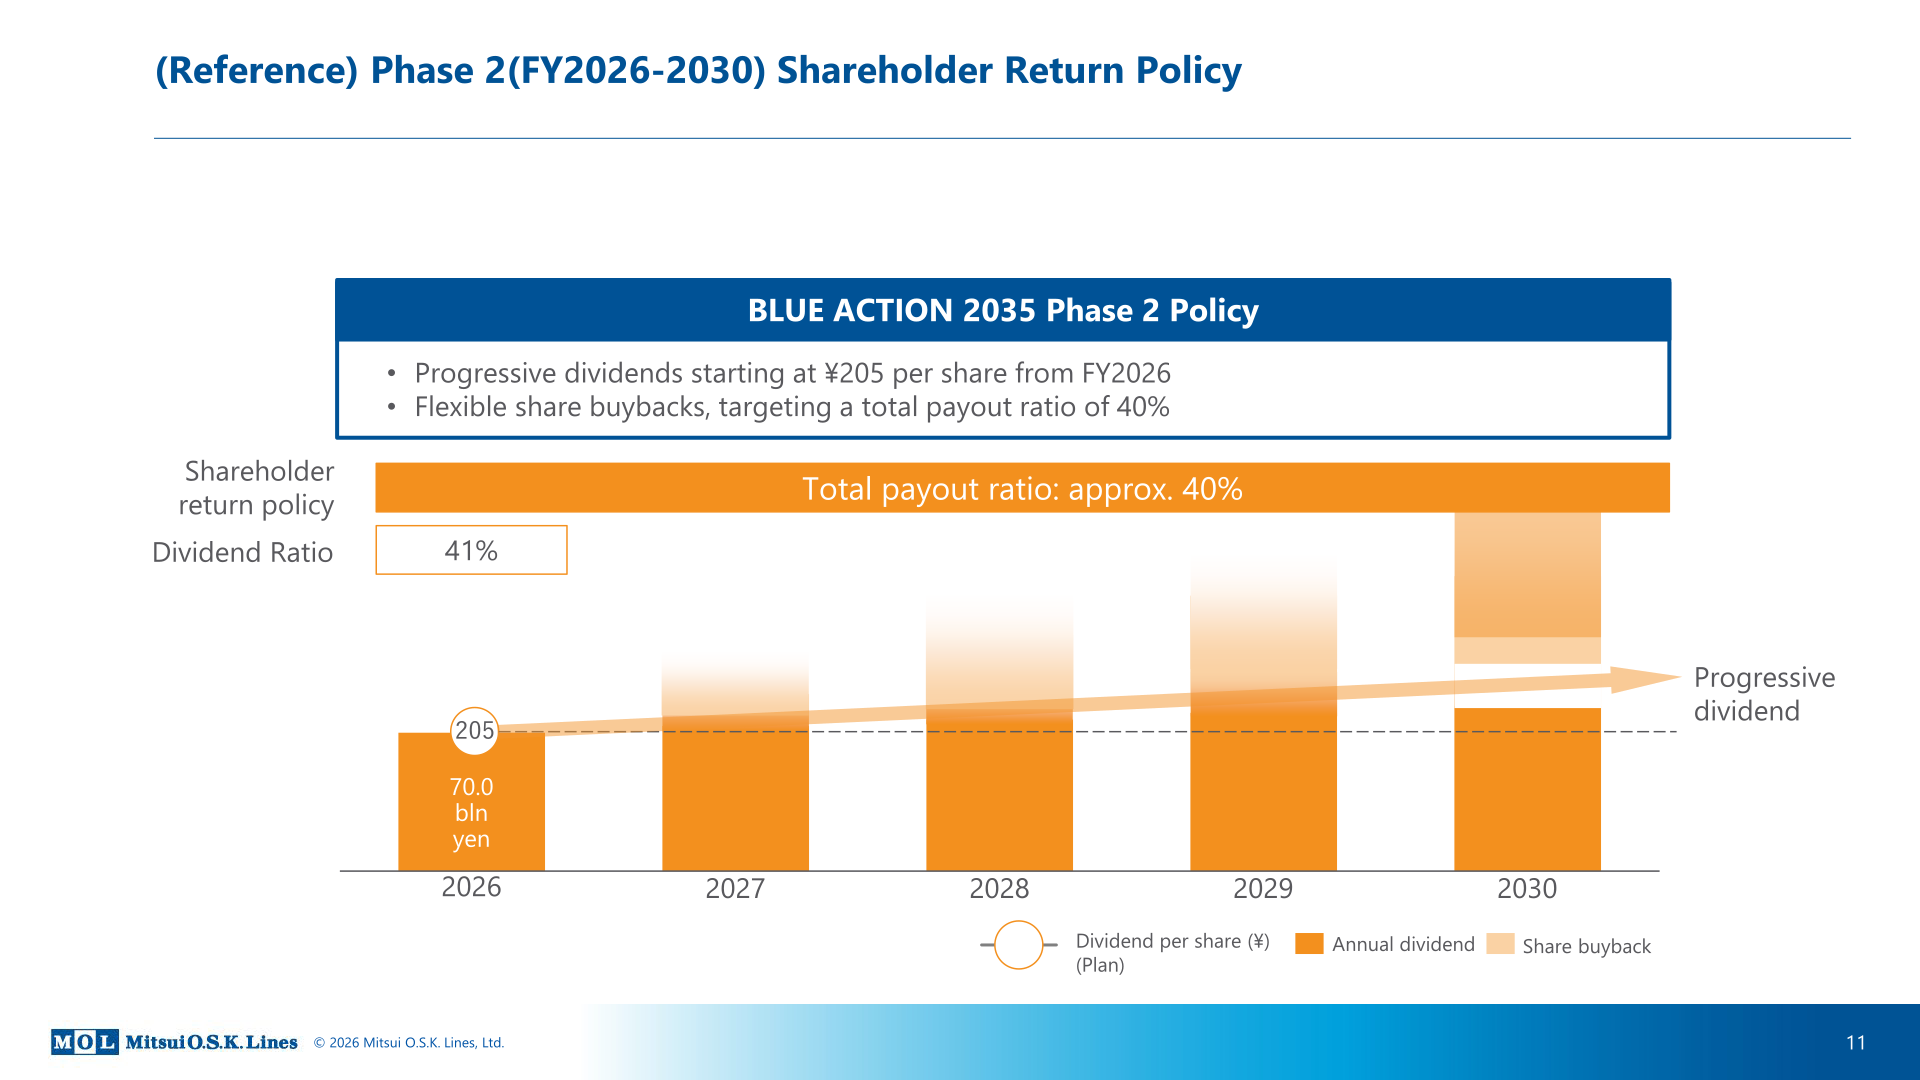
For FY2025, MOL paid an interim dividend of ¥85 per share and a year-end dividend of ¥115 per share, for an annual total of ¥200 per share. For FY2026, MOL plans an interim dividend of ¥100 per share and a year-end dividend of ¥105 per share, for a planned annual total of ¥205 per share. Under the Phase 2 (FY2026–2030) shareholder return policy of BLUE ACTION 2035, MOL plans progressive dividends starting at ¥205 per share from FY2026, together with flexible share buybacks, targeting a total payout ratio of approximately 40%.
| Item | FY2025 (Result) | FY2026 (Forecast) |
|---|---|---|
| Interim Dividend (¥/share) | 85 | 100 |
| Year-end Dividend (¥/share) | 115 | 105 |
| Annual Total (¥/share) | 200 | 205 |
ONE 2030 Update (Appendix)
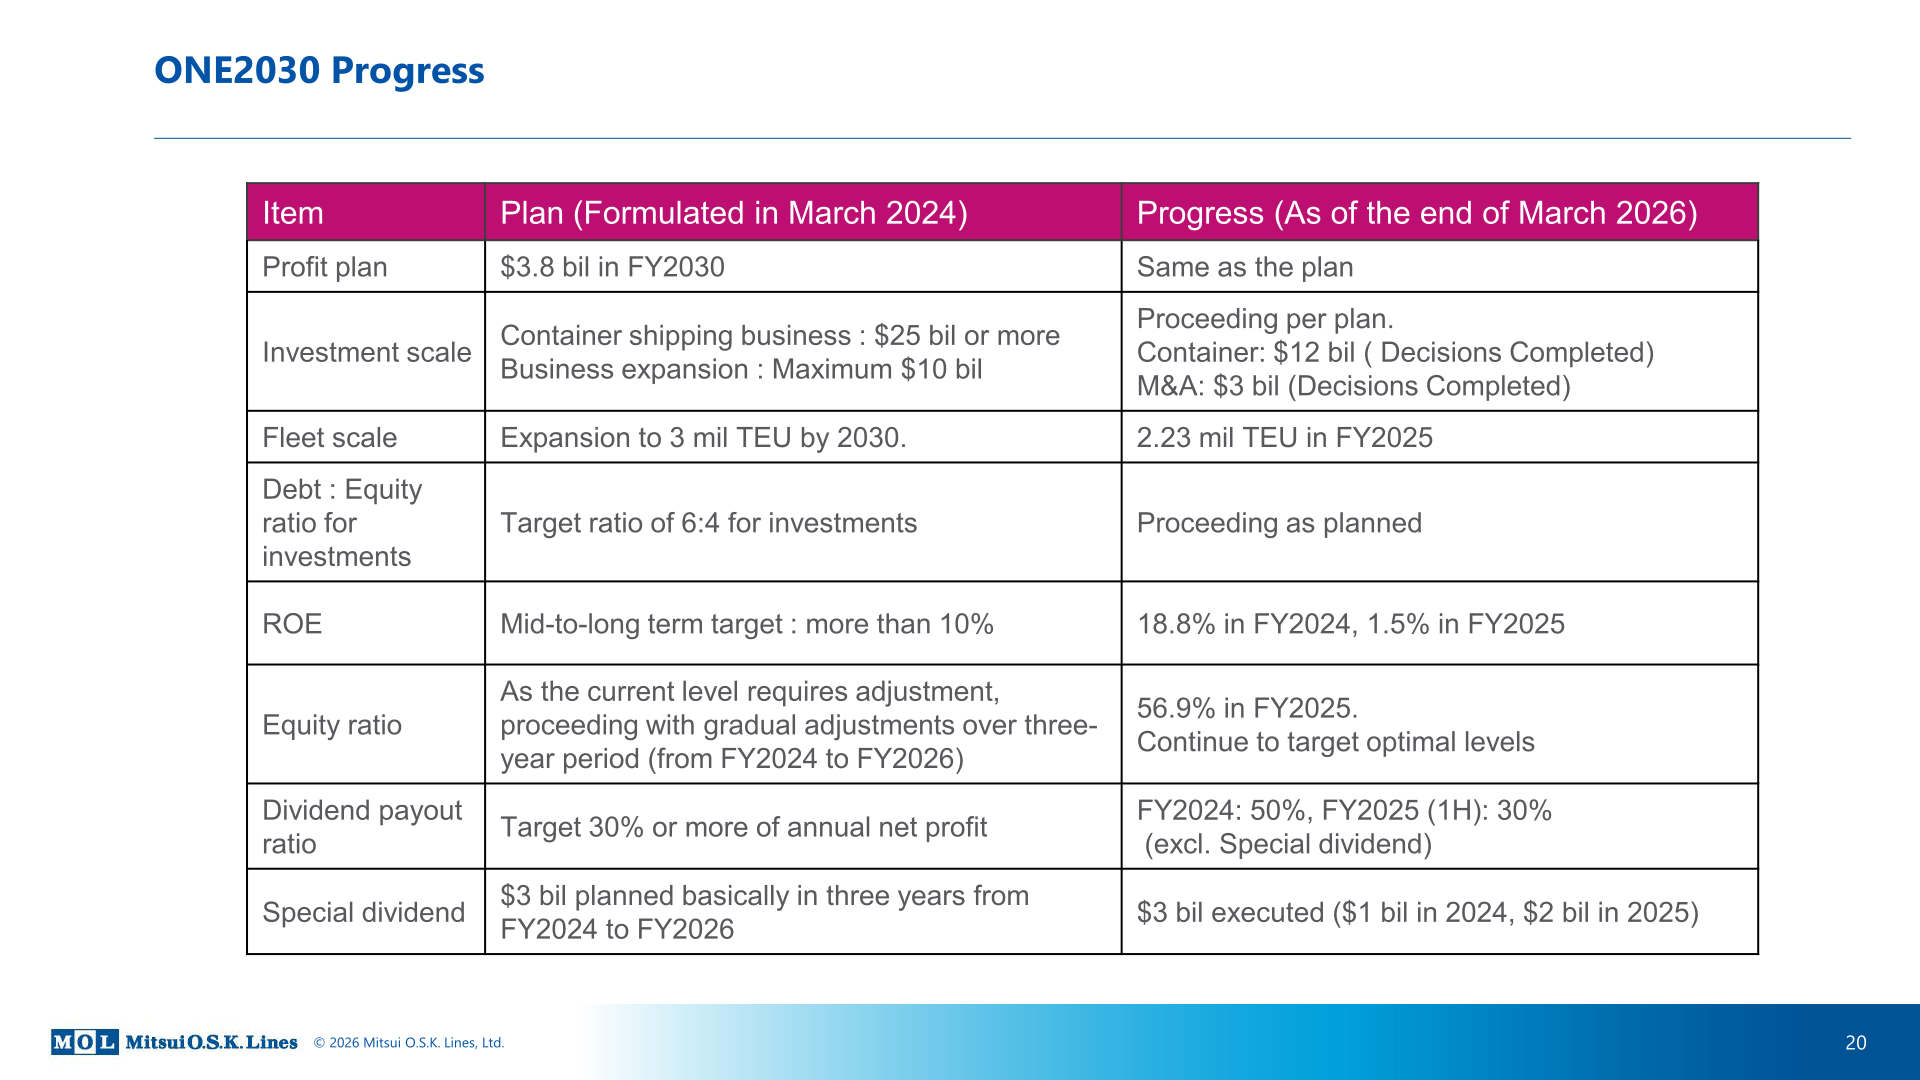
MOL’s Appendix provides an update on ONE (Ocean Network Express) 2030 progress against the plan formulated in March 2024, as of the end of March 2026. The profit plan of $3.8 billion in FY2030 is unchanged. On investment scale, container shipping business investment decisions of $12 billion and business expansion M&A decisions of $3 billion have been completed, against targets of $25 billion or more and up to $10 billion respectively, described as proceeding per plan. Fleet scale was 2.23 million TEU in FY2025, against a target of expansion to 3 million TEU by 2030. The target debt-to-equity ratio for investments of 6:4 is proceeding as planned. ROE was 18.8% in FY2024 and 1.5% in FY2025, against a mid-to-long term target of more than 10%. The equity ratio was 56.9% in FY2025, which MOL states requires adjustment, to be addressed gradually over the three-year period from FY2024 to FY2026. The dividend payout ratio was 50% in FY2024 and 30% in FY2025 (first half, excluding special dividend), against a target of 30% or more of annual net profit. Special dividends totaling $3 billion, planned over the three years from FY2024 to FY2026, have been executed as $1 billion in 2024 and $2 billion in 2025, resulting in the 56.9% equity ratio. MOL states the ONE 2030 target indicators remain unchanged from the initial plan: fleet scale of more than 3 million TEU, a profit plan of approximately $3.8 billion in FY2030, investment scale of approximately $35 billion, average ROE of 10% or more over the ONE2030 period, and a debt-to-equity ratio for investments of 6:4; based on recent performance, the dividend payout ratio target has been revised to 40%.
| Item | Plan (Formulated March 2024) | Progress (As of End of March 2026) |
|---|---|---|
| Profit Plan (FY2030) | $3.8 bil | Same as the plan |
| Investment Scale | Container shipping business: $25 bil or more; Business expansion: Maximum $10 bil | Container: $12 bil (Decisions Completed); M&A: $3 bil (Decisions Completed) |
| Fleet Scale | Expansion to 3 mil TEU by 2030 | 2.23 mil TEU in FY2025 |
| Debt:Equity Ratio for Investments | Target ratio of 6:4 | Proceeding as planned |
| ROE | Mid-to-long term target: more than 10% | 18.8% in FY2024, 1.5% in FY2025 |
| Equity Ratio | Gradual adjustment over three years (FY2024-FY2026) | 56.9% in FY2025 |
| Dividend Payout Ratio | Target 30% or more of annual net profit | FY2024: 50%, FY2025 (1H): 30% (excl. special dividend) |
| Special Dividend | $3 bil planned over three years (FY2024-FY2026) | $3 bil executed ($1 bil in 2024, $2 bil in 2025) |
Topics
Among strategic and materiality-related actions disclosed in the materials, MOL completed the acquisition of LBC Tank Terminals on 2025-07-01, positioning the company as a global leading company in the chemical logistics business. MOL and Mitsui & Co. jointly acquired port service, steel processing, and machinery/equipment manufacturing businesses serving the U.K. offshore energy industry (2025-07-31). MOL and India’s ONGC signed a long-term charter deal for two liquefied ethane carriers, described as building the world’s largest ethane carrier fleet (2026-01-28), and MOL and GAIL signed a long-term charter contract for an LNG carrier (2026-01-28). MOL signed long-term charter contracts for two new liquefied CO2 carriers for the Northern Lights project, described as the world’s first cross-border CO2 transport and storage project (2026-01-30). MOL and PSA Singapore formed a strategic joint venture to establish a Ro-Ro terminal in Singapore (2026-01-29), and MOL and Mitsubishi Estate jointly invested in a logistics facility project in Vietnam (2026-02-27). MOL and Hitachi launched an initiative to convert used ships into floating data centers to provide digital infrastructure for growing AI demand (2026-03-30).
This article is an analysis based on publicly available information and is not a recommendation to buy or sell any specific securities. Investment decisions are your own responsibility.
![[Obayashi] Investors’ Guide 2026 — The Complete 24-Article Breakdown](https://japan-equity.com/wp-content/uploads/2026/07/hub_cover-1024x1024.png)
![[Obayashi] IR & SR Policy — Feeding Dialogue Back into Management](https://japan-equity.com/wp-content/uploads/2026/07/p32_sq-1024x1024.jpg)
![[Obayashi] Real Estate Development — 18.7% Margin, ¥287.7bn Unrealized Gains](https://japan-equity.com/wp-content/uploads/2026/07/p20_sq-1024x1024.jpg)
![[Obayashi] Domestic Civil Engineering — Resilience Spending Supports 9.6% Margin](https://japan-equity.com/wp-content/uploads/2026/07/p11_sq-1024x1024.jpg)
![[Obayashi] Share Price & External Ratings — vs TOPIX, ESG Index Inclusion](https://japan-equity.com/wp-content/uploads/2026/07/p40_sq-1024x1024.jpg)
![[Construction] ¥75.5tn Investment, Shrinking Workforce — Big-5 Market Share](https://japan-equity.com/wp-content/uploads/2026/07/p12_sq-1024x1024.jpg)



![[Obayashi] Capital Policy & Shareholder Returns — ROE 10%+, DOE ~5%, ¥100bn Buyback](https://japan-equity.com/wp-content/uploads/2026/07/p27_sq-1024x1024.jpg)
![[Obayashi] Reducing Cross-Shareholdings — ¥285.2bn Sold in Five Years](https://japan-equity.com/wp-content/uploads/2026/07/p29_sq-1024x1024.jpg)
![[Obayashi] ¥750bn Investment Plan — ¥300bn to Development, ¥190bn to Tech/DX](https://japan-equity.com/wp-content/uploads/2026/07/p30_sq-1024x1024.jpg)
![[Obayashi] MTP2022 KPIs — Operating Profit ~2x Target, ROE 14.4%](https://japan-equity.com/wp-content/uploads/2026/07/p25_sq-1024x1024.jpg)
![[Obayashi] Cash Allocation — ¥420bn Investment CF Over Five Years](https://japan-equity.com/wp-content/uploads/2026/07/p26_sq-1024x1024.jpg)
![[Obayashi] Green Energy — 44 Plants, 344MW, and the Green Hydrogen Challenge](https://japan-equity.com/wp-content/uploads/2026/07/p21_sq-1024x1024.jpg)
![[Obayashi] Tackling the Labor Shortage — Robotics Construction®](https://japan-equity.com/wp-content/uploads/2026/07/p14_sq-1024x1024.jpg)
