
This article is based on publicly available IR materials and is not a recommendation to buy or sell any specific securities.
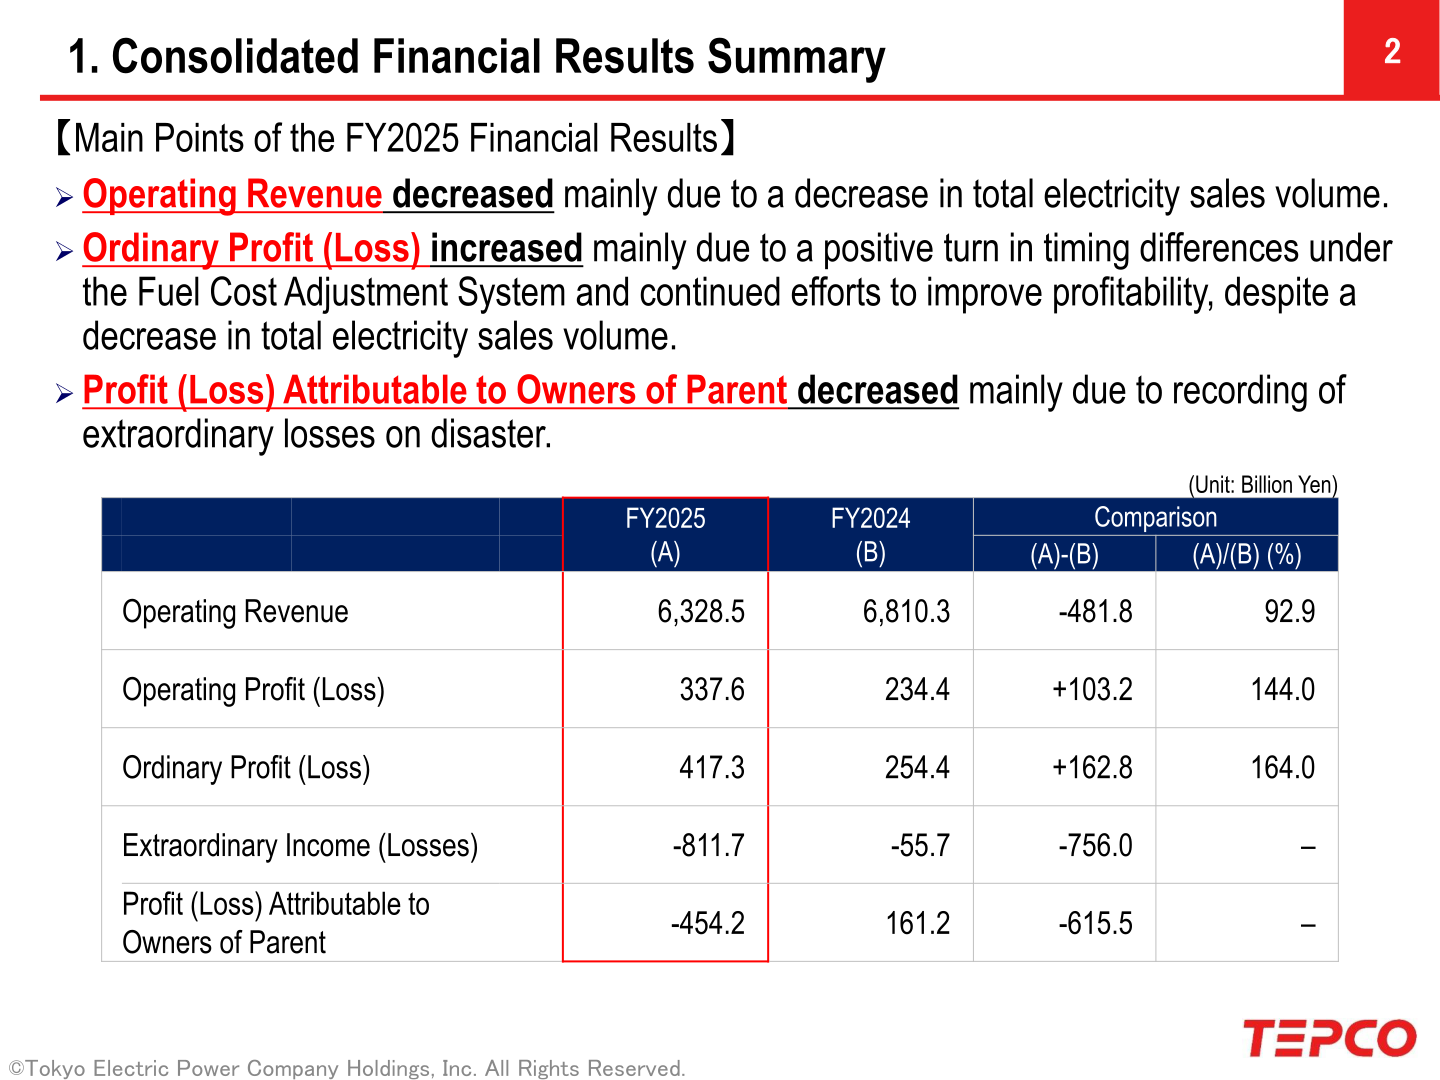
Tokyo Electric Power Company Holdings, Inc. (TEPCO Holdings) reported consolidated Operating Revenue of ¥6,328.5 billion for FY2025 (April 1, 2025 – March 31, 2026), down from ¥6,810.3 billion in FY2024. Ordinary Profit increased to ¥417.3 billion from ¥254.4 billion, driven mainly by a positive turn in timing differences under the Fuel Cost Adjustment System and continued efforts to improve profitability, despite a decrease in total electricity sales volume. Profit (Loss) Attributable to Owners of Parent, however, swung to a loss of ¥454.2 billion from a profit of ¥161.2 billion in FY2024, mainly due to the recording of extraordinary losses on disaster.
Consolidated Results (Full-Year Actual)
Operating Revenue decreased mainly due to a decrease in total electricity sales volume, which fell to 213.2 billion kWh in FY2025 from 228.6 billion kWh in FY2024 (Retail Electricity Sales Volume: 171.9 billion kWh vs 187.2 billion kWh; Wholesale Electricity Sales Volume: 41.3 billion kWh vs 41.4 billion kWh). Ordinary Profit increased mainly due to a positive turn in the impact of timing differences under the Fuel Cost Adjustment System (+¥28.0 billion in FY2025 versus +¥2.0 billion in FY2024, a positive turn of +¥26.0 billion) and continued efforts to improve profitability; excluding the impact of timing differences, Ordinary Profit was ¥389.3 billion versus ¥252.4 billion, an increase of ¥136.8 billion (154.2%). Profit (Loss) Attributable to Owners of Parent decreased mainly due to the recording of extraordinary losses on disaster. (Unit: Billion Yen)
| Item | FY2025 | FY2024 | Change |
|---|---|---|---|
| Operating Revenue | 6,328.5 | 6,810.3 | -481.8 (92.9%) |
| Operating Profit (Loss) | 337.6 | 234.4 | +103.2 (144.0%) |
| Ordinary Profit (Loss) | 417.3 | 254.4 | +162.8 (164.0%) |
| Extraordinary Income (Losses) | -811.7 | -55.7 | -756.0 |
| Profit (Loss) Attributable to Owners of Parent | -454.2 | 161.2 | -615.5 |
Segment Results
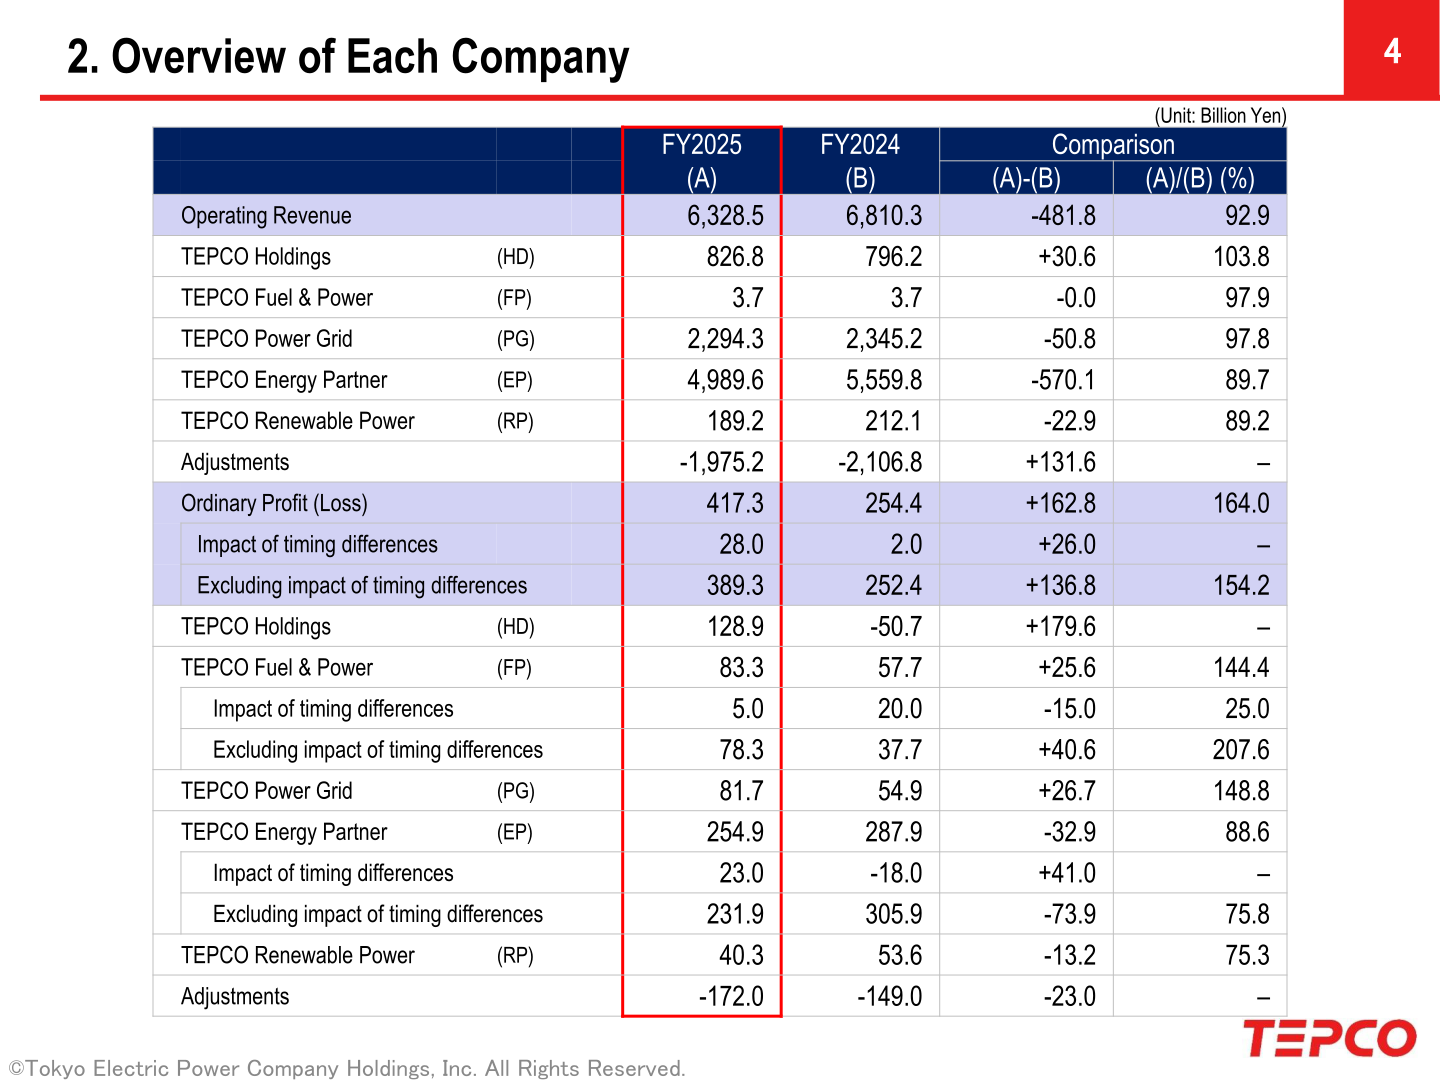
By company, Ordinary Profit at TEPCO Holdings (HD) increased mainly due to an increase in dividend income. TEPCO Fuel & Power (FP)’s Ordinary Profit increased mainly due to the impact of fuel procurement prices and increased profits from overseas and renewable power generation businesses. TEPCO Power Grid (PG)’s Ordinary Profit increased mainly due to a decrease in costs related to supply and demand adjustment. TEPCO Energy Partner (EP)’s Ordinary Profit decreased mainly due to a decrease in total electricity sales volume and an increase in procurement unit prices. TEPCO Renewable Power (RP)’s Ordinary Profit decreased mainly due to a decrease in wholesale electricity sales. (Unit: Billion Yen)
| Segment | Metric | FY2025 | FY2024 |
|---|---|---|---|
| TEPCO Holdings (HD) | Operating Revenue | 826.8 | 796.2 |
| TEPCO Holdings (HD) | Ordinary Profit (Loss) | 128.9 | -50.7 |
| TEPCO Fuel & Power (FP) | Operating Revenue | 3.7 | 3.7 |
| TEPCO Fuel & Power (FP) | Ordinary Profit (Loss) | 83.3 | 57.7 |
| TEPCO Power Grid (PG) | Operating Revenue | 2,294.3 | 2,345.2 |
| TEPCO Power Grid (PG) | Ordinary Profit (Loss) | 81.7 | 54.9 |
| TEPCO Energy Partner (EP) | Operating Revenue | 4,989.6 | 5,559.8 |
| TEPCO Energy Partner (EP) | Ordinary Profit (Loss) | 254.9 | 287.9 |
| TEPCO Renewable Power (RP) | Operating Revenue | 189.2 | 212.1 |
| TEPCO Renewable Power (RP) | Ordinary Profit (Loss) | 40.3 | 53.6 |
| Adjustments | Operating Revenue | -1,975.2 | -2,106.8 |
| Adjustments | Ordinary Profit (Loss) | -172.0 | -149.0 |
Financial Position
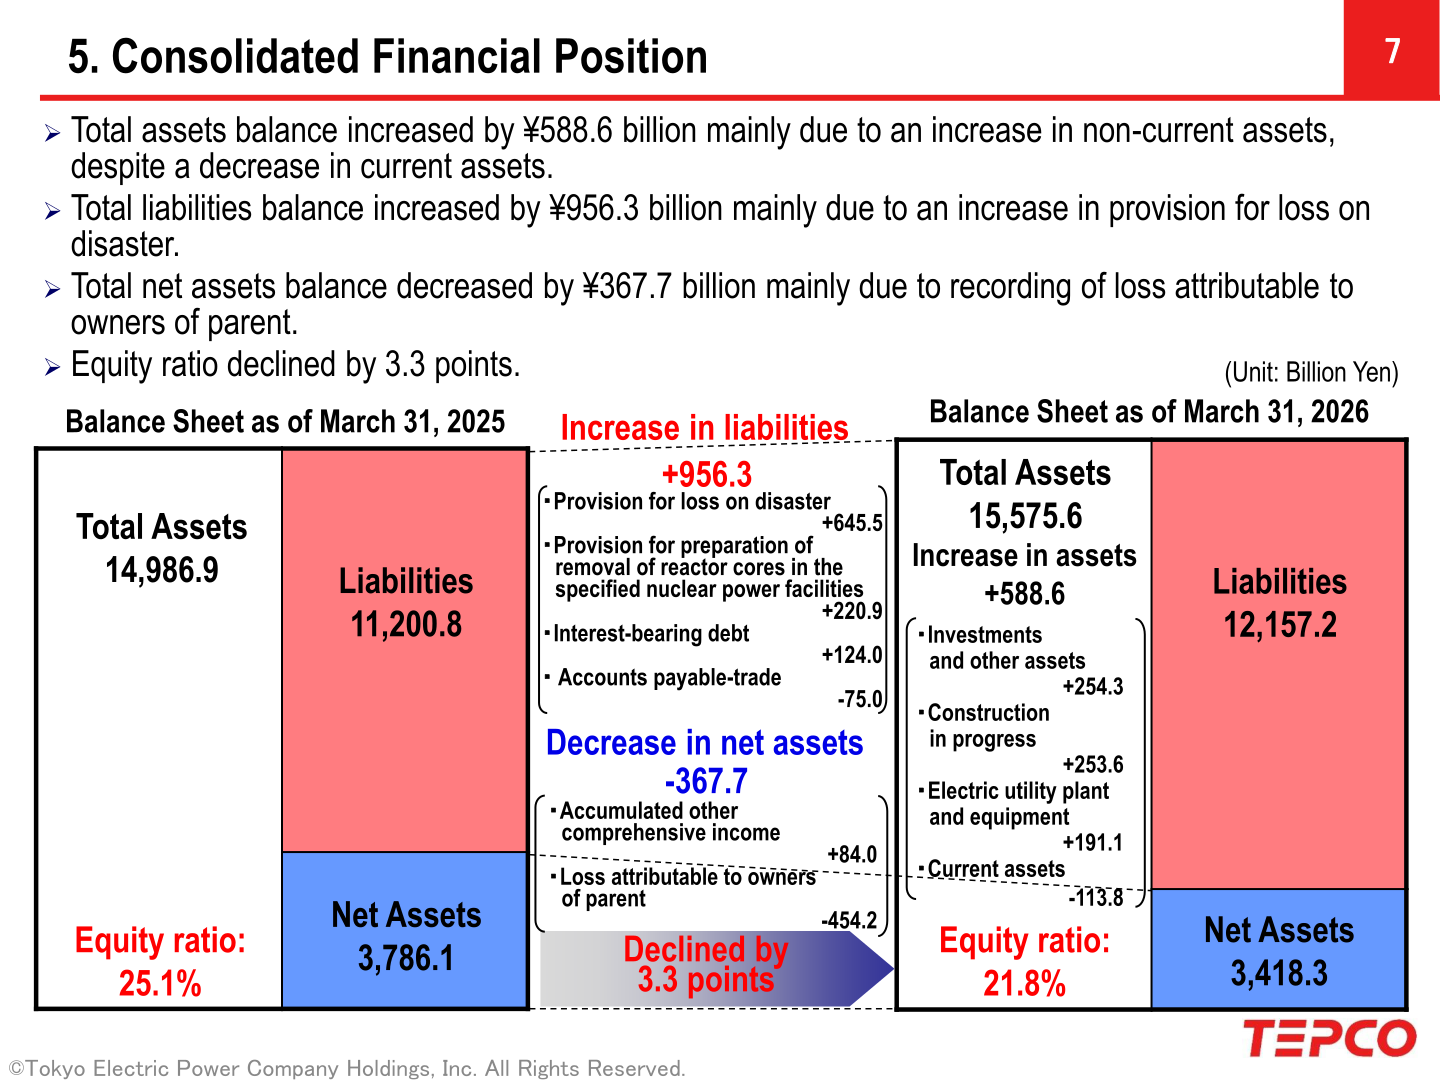
Total assets balance increased by ¥588.6 billion mainly due to an increase in non-current assets, despite a decrease in current assets. Total liabilities balance increased by ¥956.3 billion mainly due to an increase in provision for loss on disaster (+¥645.5 billion) and provision for preparation of removal of reactor cores in the specified nuclear power facilities (+¥220.9 billion), among other items. Total net assets balance decreased by ¥367.7 billion mainly due to recording of loss attributable to owners of parent. Equity ratio declined by 3.3 points to 21.8% as of March 31, 2026, from 25.1% as of March 31, 2025.
| Item | Mar 31, 2026 | Mar 31, 2025 | Change |
|---|---|---|---|
| Total Assets | 15,575.6 | 14,986.9 | +588.6 (103.9%) |
| Liabilities | 12,157.2 | 11,200.8 | +956.3 (108.5%) |
| Net Assets | 3,418.3 | 3,786.1 | -367.7 (90.3%) |
| Equity Ratio | 21.8% | 25.1% | -3.3pt |
Extraordinary Items (Drivers of the Net Loss)
Extraordinary Income increased to ¥184.9 billion from ¥87.3 billion, mainly reflecting a gain on sale of shares of subsidiaries and associates of ¥103.0 billion (sale of shares of KANDENKO CO., LTD., etc.) and Grants-in-aid from the Nuclear Damage Compensation and Decommissioning Facilitation Corporation of ¥81.8 billion. Extraordinary Losses increased sharply to ¥996.6 billion from ¥143.0 billion, mainly due to Extraordinary Losses on disaster of ¥913.8 billion — reflecting an increase in estimated costs for restoration and related work of assets damaged by the Great East Japan Earthquake and newly anticipated costs for preparatory work for fuel debris retrieval — and Expenses for Nuclear Damage Compensation of ¥82.7 billion. As a result, Extraordinary Income (Losses) totaled -¥811.7 billion, compared with -¥55.7 billion in FY2024. (Unit: Billion Yen)
| Item | FY2025 | FY2024 | Change |
|---|---|---|---|
| Extraordinary Income | 184.9 | 87.3 | +97.6 |
| Gain on sale of shares of subsidiaries and associates | 103.0 | – | +103.0 |
| Grants-in-aid from Nuclear Damage Compensation and Decommissioning Facilitation Corporation | 81.8 | 87.3 | -5.4 |
| Extraordinary Losses | 996.6 | 143.0 | +853.6 |
| Extraordinary Losses on disaster | 913.8 | 62.6 | +851.2 |
| Expenses for Nuclear Damage Compensation | 82.7 | 80.3 | +2.4 |
| Extraordinary Income (Losses) | -811.7 | -55.7 | -756.0 |
FY2026 Forecast
TEPCO Holdings did not disclose specific figures for its FY2026 Consolidated Performance Forecast, stating that the forecast is “To be determined.”
Shareholder Returns
TEPCO decided not to pay out fiscal 2025 year-end dividends. No interim and year-end dividends are planned for FY2026.
Topics: Kashiwazaki-Kariwa NPS Restart and Fukushima Daiichi Response
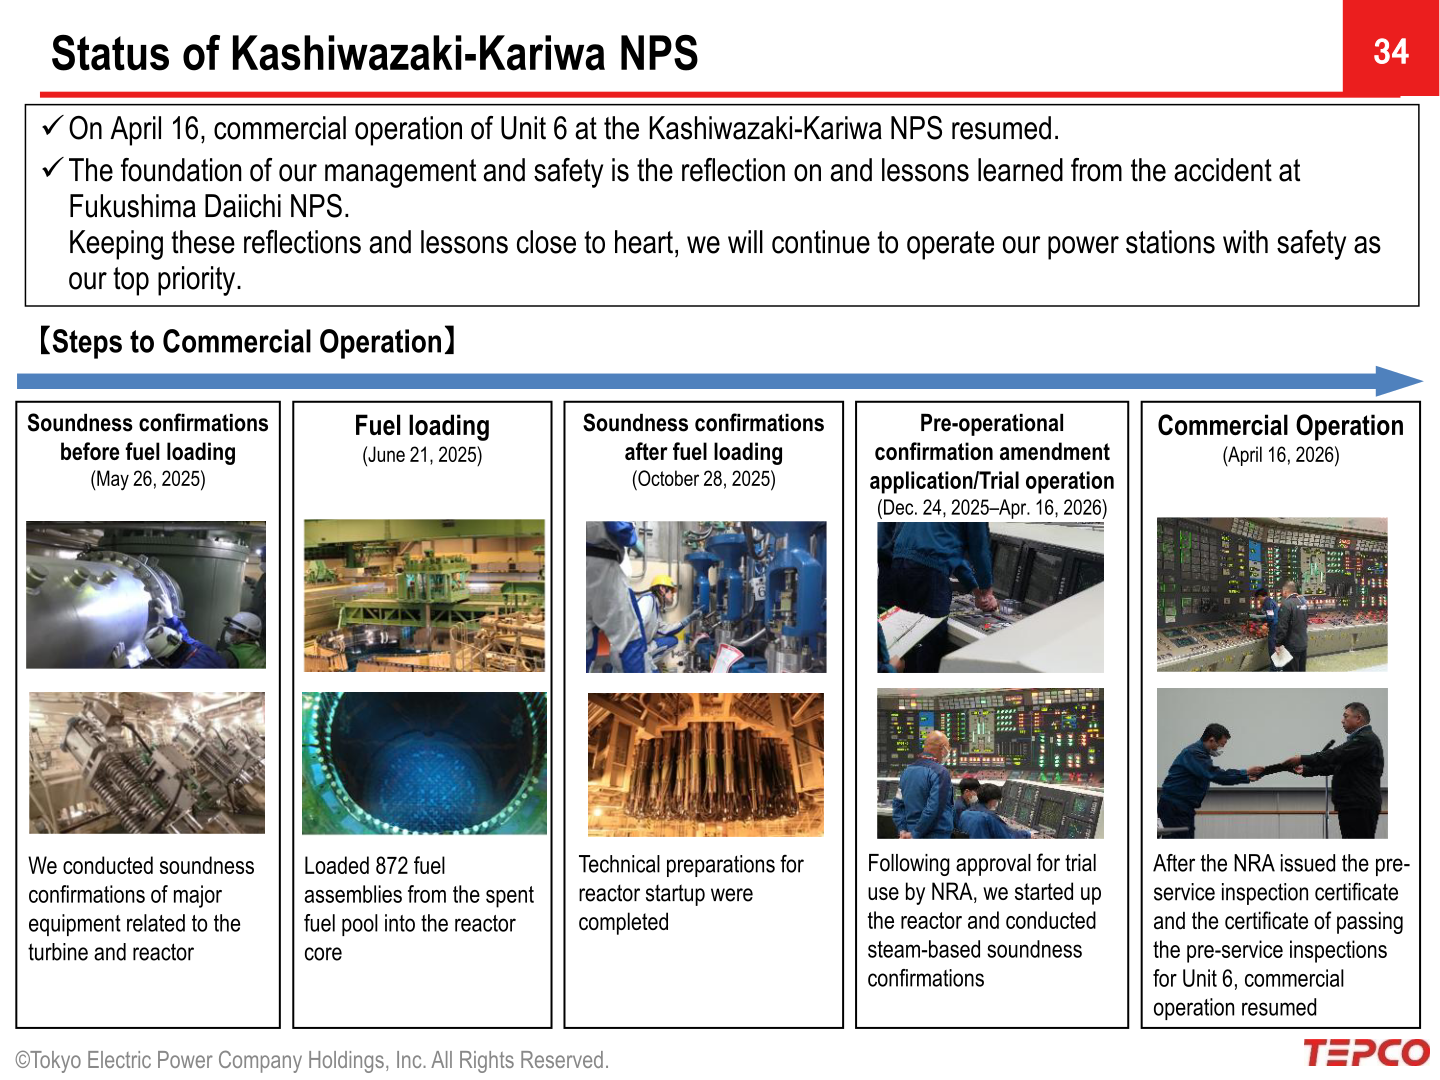
On April 16, 2026, commercial operation of Unit 6 at the Kashiwazaki-Kariwa Nuclear Power Station (NPS) resumed, following soundness confirmations before fuel loading (May 26, 2025), fuel loading of 872 fuel assemblies (June 21, 2025), soundness confirmations after fuel loading (October 28, 2025), and a pre-operational confirmation amendment application/trial operation period (December 24, 2025 – April 16, 2026). Nuclear Power Plant Capacity Utilization Ratio was 1.1% in FY2025 (versus – in FY2024). At Fukushima Daiichi NPS, spent fuel removal from Units 3 and 4 was completed and preparation work is underway for Units 1 and 2; trial retrieval of fuel debris (2nd time) from Unit 2 was completed and preparation work is underway for Units 1 through 3. In FY2025, TEPCO planned seven ALPS treated water discharges and completed them by March 24, 2026 (annual water discharge volume: 55,011 m³; annual tritium discharge volume: approx. 16.0 trillion Bq); in FY2026, eight discharges are planned (annual water discharge volume: approx. 62,400 m³; annual tritium discharge volume: approx. 11 trillion Bq), and the first FY2026 discharge was completed by April 20, 2026. The amount of compensation for nuclear damages paid totaled ¥11,682.7 billion as of the end of March 2026.
This article is an analysis based on publicly available information and is not a recommendation to buy or sell any specific securities. Investment decisions are your own responsibility.
![[Obayashi] Investors’ Guide 2026 — The Complete 24-Article Breakdown](https://japan-equity.com/wp-content/uploads/2026/07/hub_cover-1024x1024.png)
![[Obayashi] IR & SR Policy — Feeding Dialogue Back into Management](https://japan-equity.com/wp-content/uploads/2026/07/p32_sq-1024x1024.jpg)
![[Obayashi] Real Estate Development — 18.7% Margin, ¥287.7bn Unrealized Gains](https://japan-equity.com/wp-content/uploads/2026/07/p20_sq-1024x1024.jpg)
![[Obayashi] Domestic Civil Engineering — Resilience Spending Supports 9.6% Margin](https://japan-equity.com/wp-content/uploads/2026/07/p11_sq-1024x1024.jpg)
![[Obayashi] Share Price & External Ratings — vs TOPIX, ESG Index Inclusion](https://japan-equity.com/wp-content/uploads/2026/07/p40_sq-1024x1024.jpg)
![[Construction] ¥75.5tn Investment, Shrinking Workforce — Big-5 Market Share](https://japan-equity.com/wp-content/uploads/2026/07/p12_sq-1024x1024.jpg)



![[Obayashi] Capital Policy & Shareholder Returns — ROE 10%+, DOE ~5%, ¥100bn Buyback](https://japan-equity.com/wp-content/uploads/2026/07/p27_sq-1024x1024.jpg)
![[Obayashi] Reducing Cross-Shareholdings — ¥285.2bn Sold in Five Years](https://japan-equity.com/wp-content/uploads/2026/07/p29_sq-1024x1024.jpg)
![[Obayashi] ¥750bn Investment Plan — ¥300bn to Development, ¥190bn to Tech/DX](https://japan-equity.com/wp-content/uploads/2026/07/p30_sq-1024x1024.jpg)
![[Obayashi] MTP2022 KPIs — Operating Profit ~2x Target, ROE 14.4%](https://japan-equity.com/wp-content/uploads/2026/07/p25_sq-1024x1024.jpg)
![[Obayashi] Cash Allocation — ¥420bn Investment CF Over Five Years](https://japan-equity.com/wp-content/uploads/2026/07/p26_sq-1024x1024.jpg)
![[Obayashi] Green Energy — 44 Plants, 344MW, and the Green Hydrogen Challenge](https://japan-equity.com/wp-content/uploads/2026/07/p21_sq-1024x1024.jpg)
![[Obayashi] Tackling the Labor Shortage — Robotics Construction®](https://japan-equity.com/wp-content/uploads/2026/07/p14_sq-1024x1024.jpg)
