
This article is based on publicly available IR materials and is not a recommendation to buy or sell any specific securities.
Inaba Denki Sangyo Co., Ltd. (TSE Prime: 9934) reported net sales of ¥417,023 million for the fiscal year ended March 31, 2026 (FY25 in the company’s presentation), up 8.6% year on year, with operating profit up 16.3% to ¥29,711 million and profit attributable to owners of parent up 24.7% to ¥23,420 million. The company states that it achieved record results for the fifth consecutive year (excluding the impact of changes in accounting standards). All three segments — Electrical Equipment & Materials, Industrial Automation and Proprietary Products — grew both sales and segment profit. For the fiscal year ending March 31, 2027 (FY26), the company forecasts net sales of ¥436,000 million and operating profit of ¥32,900 million.
Consolidated Results (Full-Year Actual)
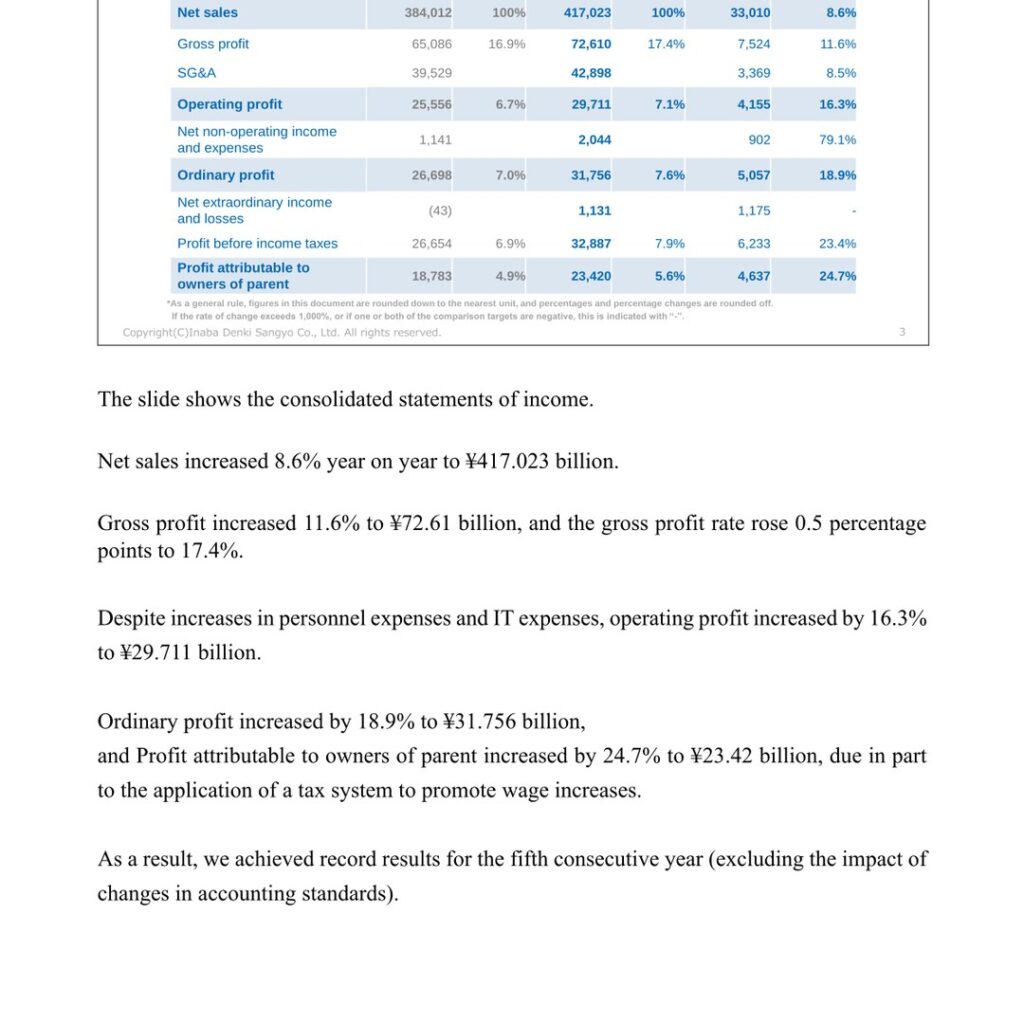
Net sales increased 8.6% year on year to ¥417.023 billion. Gross profit increased 11.6% to ¥72.61 billion, and the gross profit rate rose 0.5 percentage points to 17.4%. Despite increases in personnel expenses and IT expenses, operating profit increased by 16.3% to ¥29.711 billion. Ordinary profit increased by 18.9% to ¥31.756 billion, and profit attributable to owners of parent increased by 24.7% to ¥23.42 billion, due in part to the application of a tax system to promote wage increases.
| Item (Millions of yen) | FY24 | FY25 | YoY change amount | YoY change % |
|---|---|---|---|---|
| Net sales | 384,012 | 417,023 | 33,010 | 8.6% |
| Gross profit | 65,086 | 72,610 | 7,524 | 11.6% |
| SG&A | 39,529 | 42,898 | 3,369 | 8.5% |
| Operating profit | 25,556 | 29,711 | 4,155 | 16.3% |
| Net non-operating income and expenses | 1,141 | 2,044 | 902 | 79.1% |
| Ordinary profit | 26,698 | 31,756 | 5,057 | 18.9% |
| Net extraordinary income and losses | (43) | 1,131 | 1,175 | – |
| Profit before income taxes | 26,654 | 32,887 | 6,233 | 23.4% |
| Profit attributable to owners of parent | 18,783 | 23,420 | 4,637 | 24.7% |
Total assets rose 12.3% to ¥313,325 million and total net assets rose 14.1% to ¥197,384 million, mainly due to an increase in investment securities and deferred tax liabilities in line with a rise in the market value of cross-shareholdings; the equity ratio rose by 1.1 percentage points to 62.9%. Cash flows from operating activities recorded an inflow of ¥26,909 million, investing activities an outflow of ¥6,601 million, and financing activities an outflow of ¥10,266 million, leaving cash and cash equivalents at the end of the period at ¥76,202 million.
Segment Results
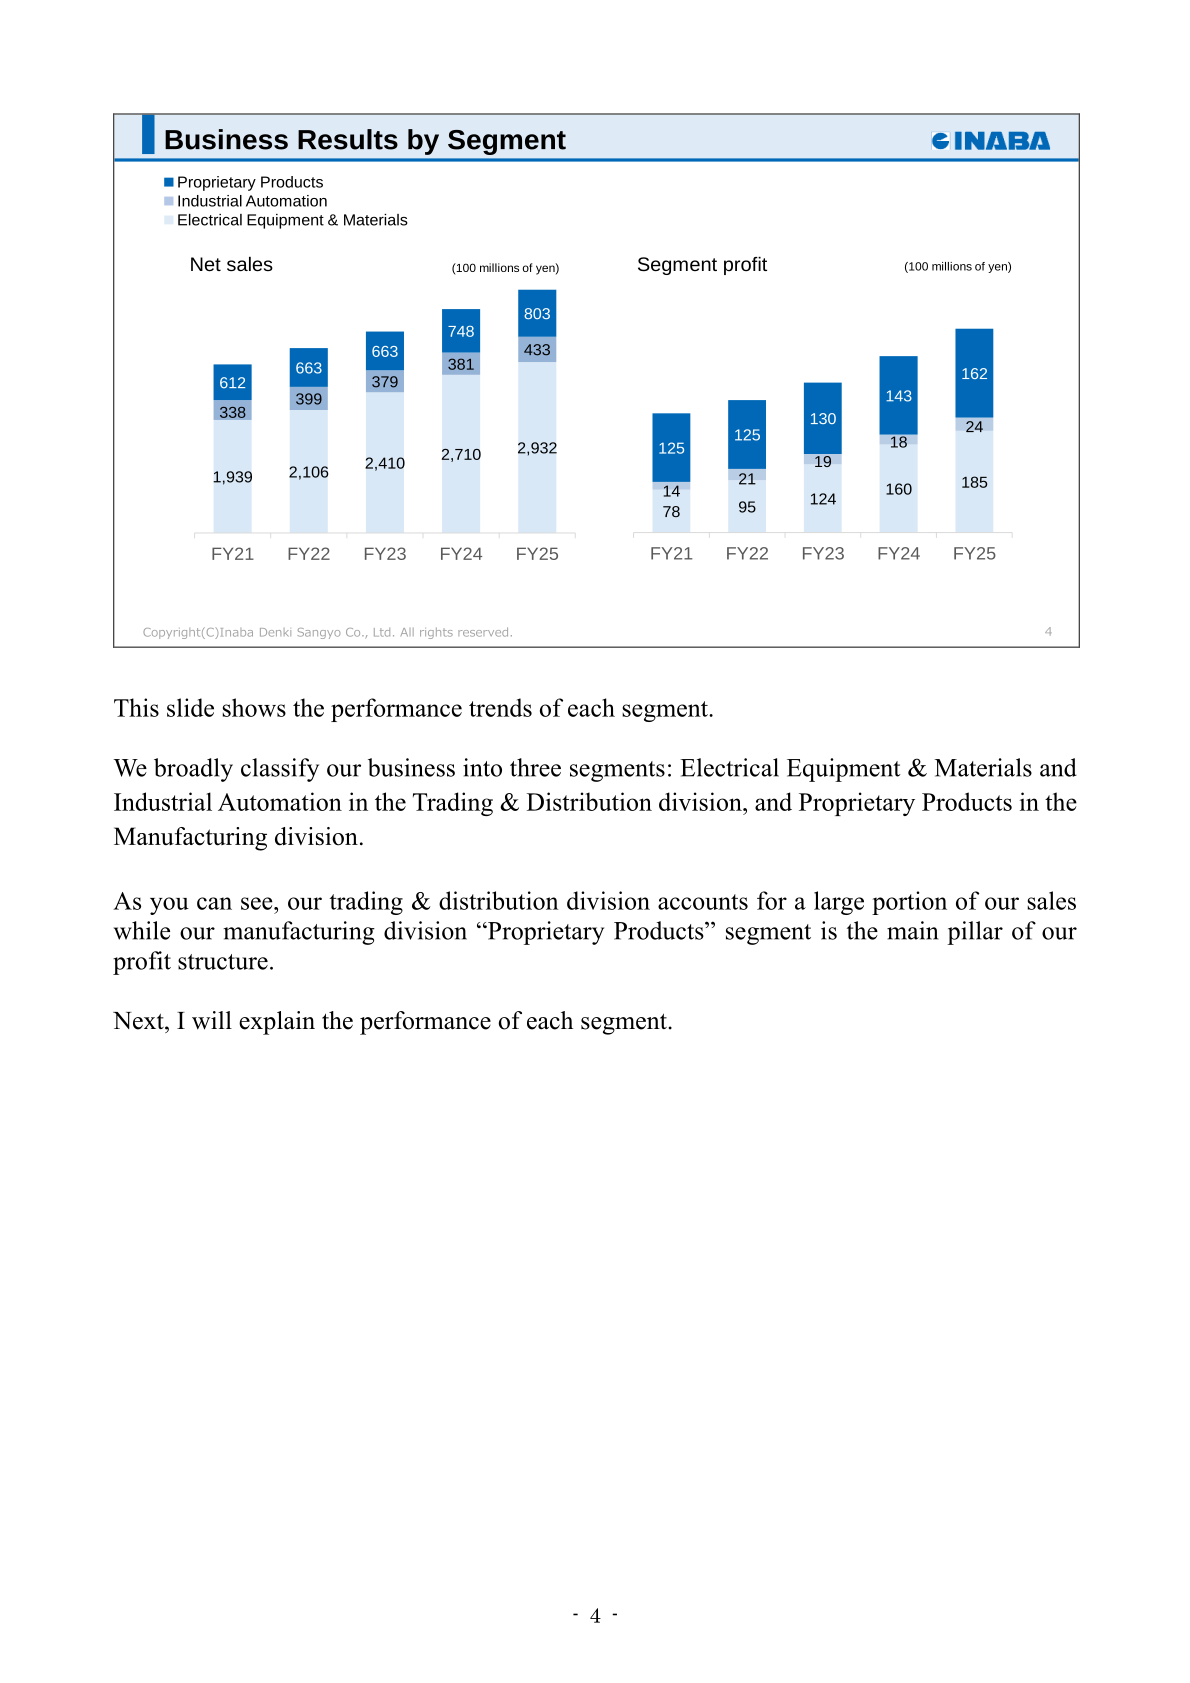
The company classifies its business into three segments: Electrical Equipment & Materials and Industrial Automation in the Trading & Distribution division, and Proprietary Products in the Manufacturing division. Net sales in Electrical Equipment & Materials increased by 8.2% year on year to ¥293.2 billion, as sales prices for electrical materials continued to rise on soaring distribution costs and raw material prices and deliveries for large-scale projects such as redevelopment projects in metropolitan areas, factories and data centers progressed well; copper prices rose 14.7% year on year. Industrial Automation net sales increased by 13.7% year on year to ¥43.3 billion as the impact of semiconductor-related inventory adjustments diminished and signs of recovery appeared in manufacturing capital investment. Proprietary Products net sales increased by 7.4% year on year to ¥80.3 billion, with the air conditioning sector up 9.0% to ¥60.6 billion, the industrial sector up 3.1% to ¥10.1 billion, and the housing sector up 2.5% to ¥9.5 billion.
| Segment | Net sales FY25 (100 millions of yen) | Net sales FY24 | Segment profit FY25 | Segment profit FY24 |
|---|---|---|---|---|
| Electrical Equipment & Materials | 2,932 | 2,710 | 185 | 160 |
| Industrial Automation | 433 | 381 | 24 | 18 |
| Proprietary Products | 803 | 748 | 162 | 143 |
Using “profit before income taxes” as its management-accounting profit indicator, the company shows profit rising from 266 in FY24 to 328 in FY25 (100 millions of yen), an increase in profit of ¥6.233 billion. The change factors are +24 from Electrical Equipment & Materials, +5 from Industrial Automation, +18 from Proprietary Products and +13 from corporate expenses (100 millions of yen), with profit increasing across all segments; for corporate expenses, which do not belong to any segment, an increase in gain on sale of investment securities and other factors supported the increase in profit.
FY2026 Forecast
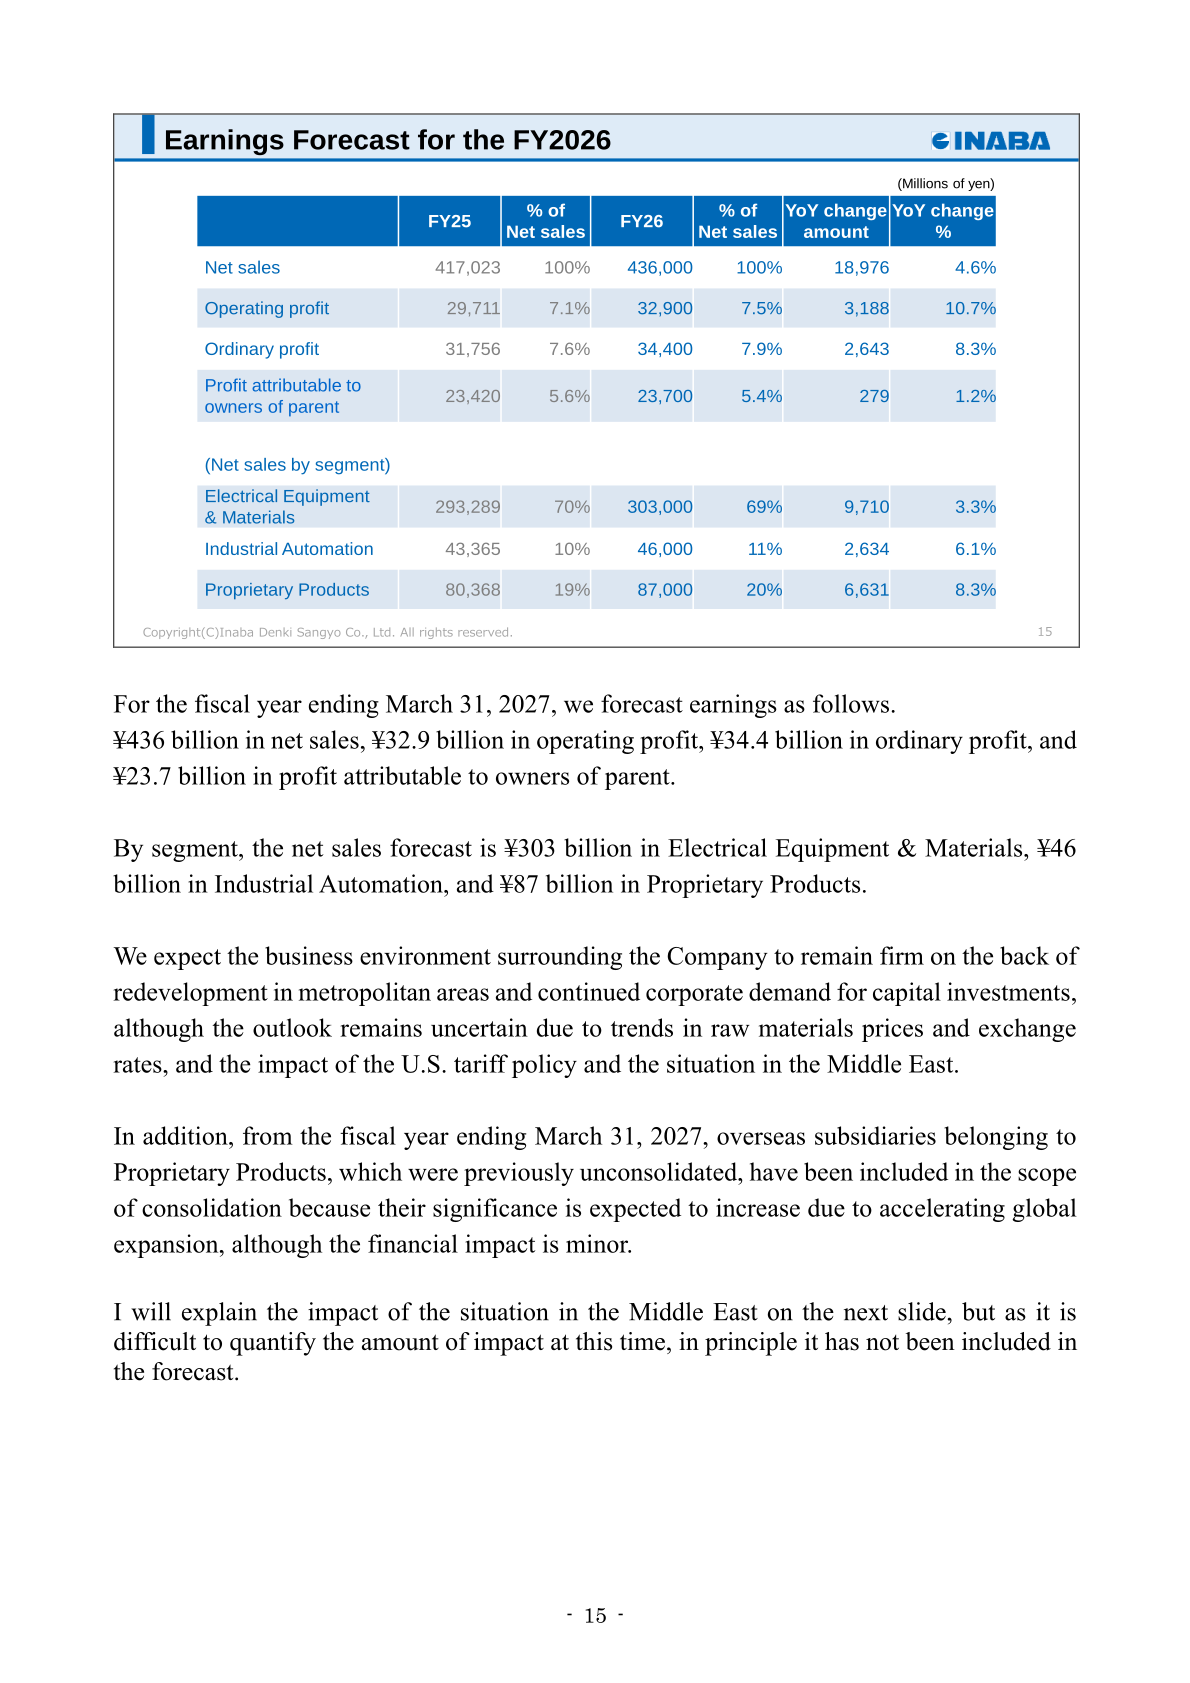
For the fiscal year ending March 31, 2027 (FY26), the company forecasts net sales of ¥436 billion, operating profit of ¥32.9 billion, ordinary profit of ¥34.4 billion, and profit attributable to owners of parent of ¥23.7 billion. The business environment is expected to remain firm on the back of redevelopment in metropolitan areas and continued corporate demand for capital investments, although the outlook remains uncertain due to trends in raw materials prices and exchange rates, and the impact of the U.S. tariff policy and the situation in the Middle East. From the fiscal year ending March 31, 2027, overseas subsidiaries belonging to Proprietary Products, previously unconsolidated, have been included in the scope of consolidation, although the financial impact is described as minor. The company also notes that in Proprietary Products the procurement of raw materials for certain products is restricted due to the escalating situation in the Middle East; as the amount of impact is difficult to quantify at this time, in principle it has not been included in the forecast.
| Item (Millions of yen) | FY25 (Actual) | FY26 (Forecast) | YoY change amount | YoY change % |
|---|---|---|---|---|
| Net sales | 417,023 | 436,000 | 18,976 | 4.6% |
| Operating profit | 29,711 | 32,900 | 3,188 | 10.7% |
| Ordinary profit | 31,756 | 34,400 | 2,643 | 8.3% |
| Profit attributable to owners of parent | 23,420 | 23,700 | 279 | 1.2% |
| Net sales: Electrical Equipment & Materials | 293,289 | 303,000 | 9,710 | 3.3% |
| Net sales: Industrial Automation | 43,365 | 46,000 | 2,634 | 6.1% |
| Net sales: Proprietary Products | 80,368 | 87,000 | 6,631 | 8.3% |
Shareholder Returns
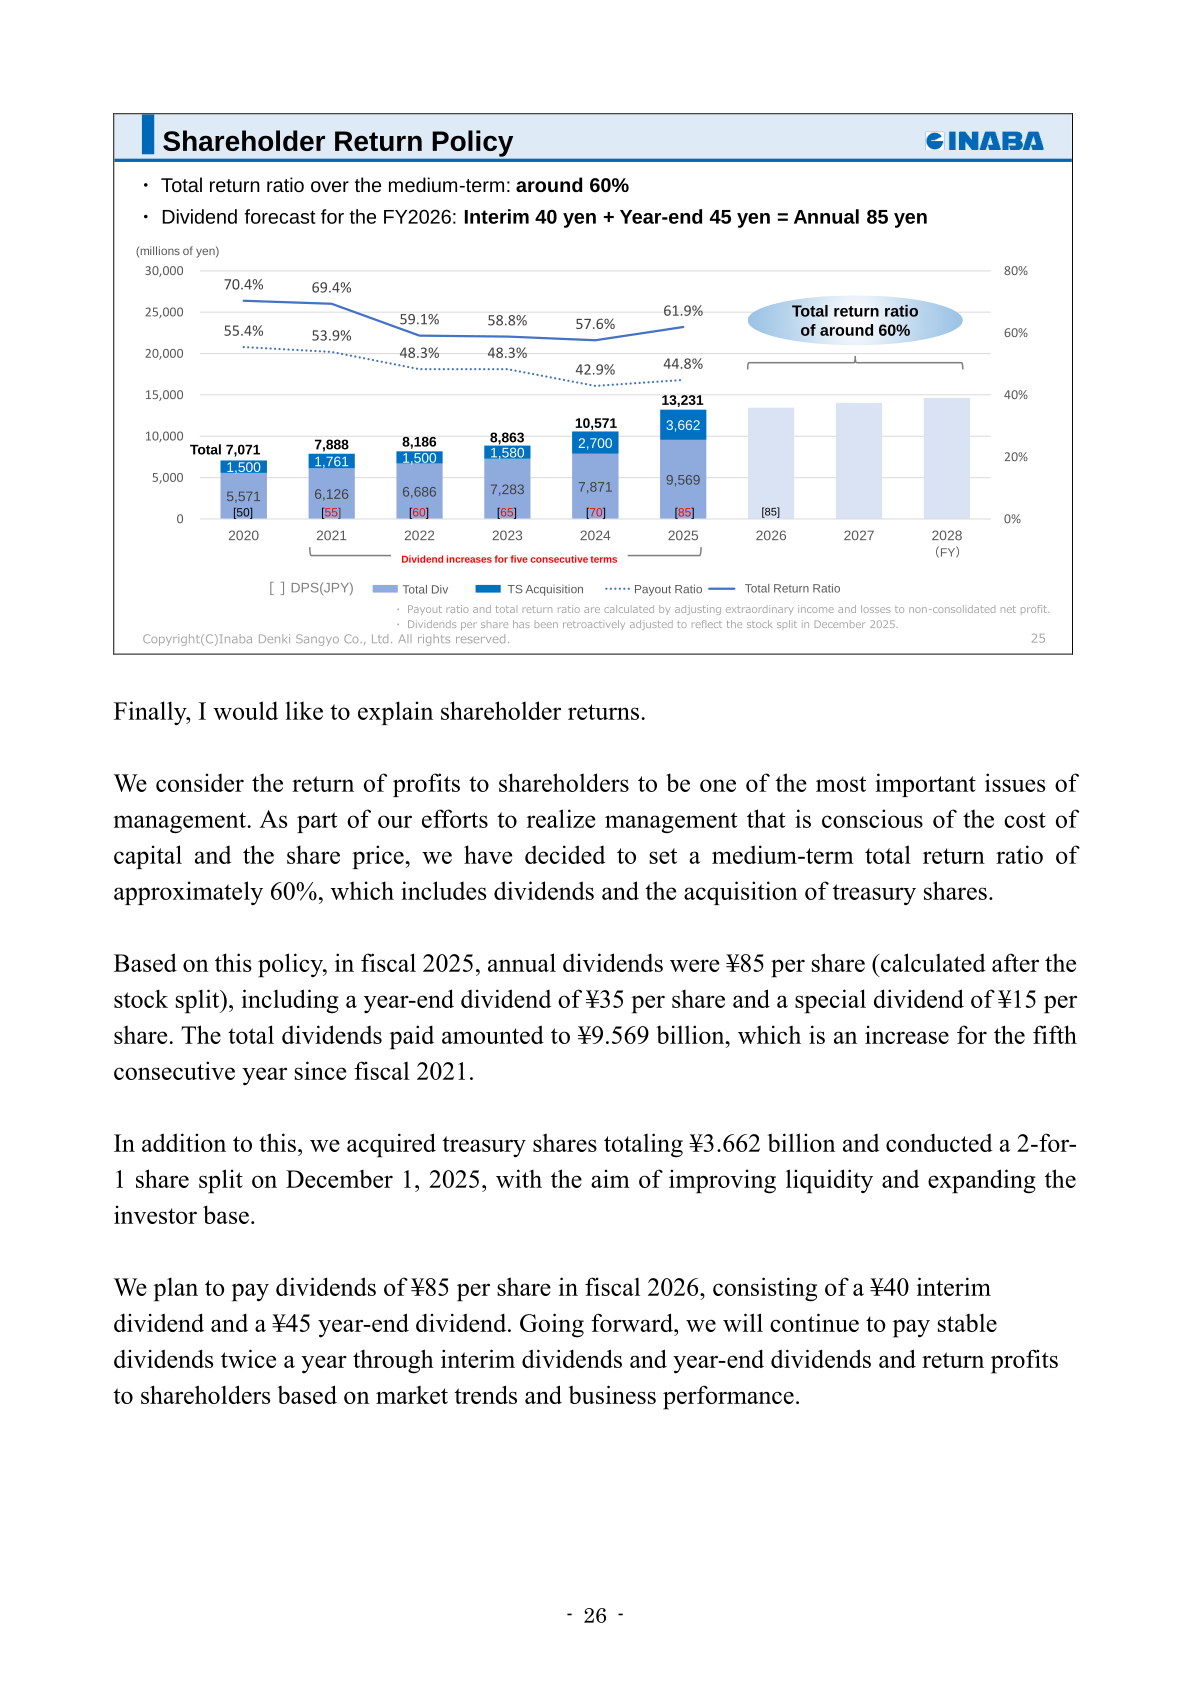
The company has set a medium-term total return ratio of approximately 60%, combining dividends and acquisitions of treasury shares. For FY25, annual dividends were ¥85 per share (calculated after the stock split), including a year-end dividend of ¥35 per share and a special dividend of ¥15 per share. Total dividends amounted to ¥9,569 million, an increase for the fifth consecutive year since fiscal 2021, and the company acquired treasury shares totaling ¥3,662 million, bringing total returns to ¥13,231 million and the total return ratio to 61.9%. A 2-for-1 share split was conducted on December 1, 2025 to improve liquidity and expand the investor base. The dividend forecast for the FY2026 is an interim dividend of ¥40 plus a year-end dividend of ¥45, for an annual dividend of ¥85 per share.
| Item | FY24 | FY25 |
|---|---|---|
| Total dividends (millions of yen) | 7,871 | 9,569 |
| Acquisition of treasury shares (millions of yen) | 2,700 | 3,662 |
| Total (millions of yen) | 10,571 | 13,231 |
| Payout ratio | 42.9% | 44.8% |
| Total return ratio | 57.6% | 61.9% |
| DPS (JPY) | [70] | [85] |
Medium-Term Management Plan and Capital Policy
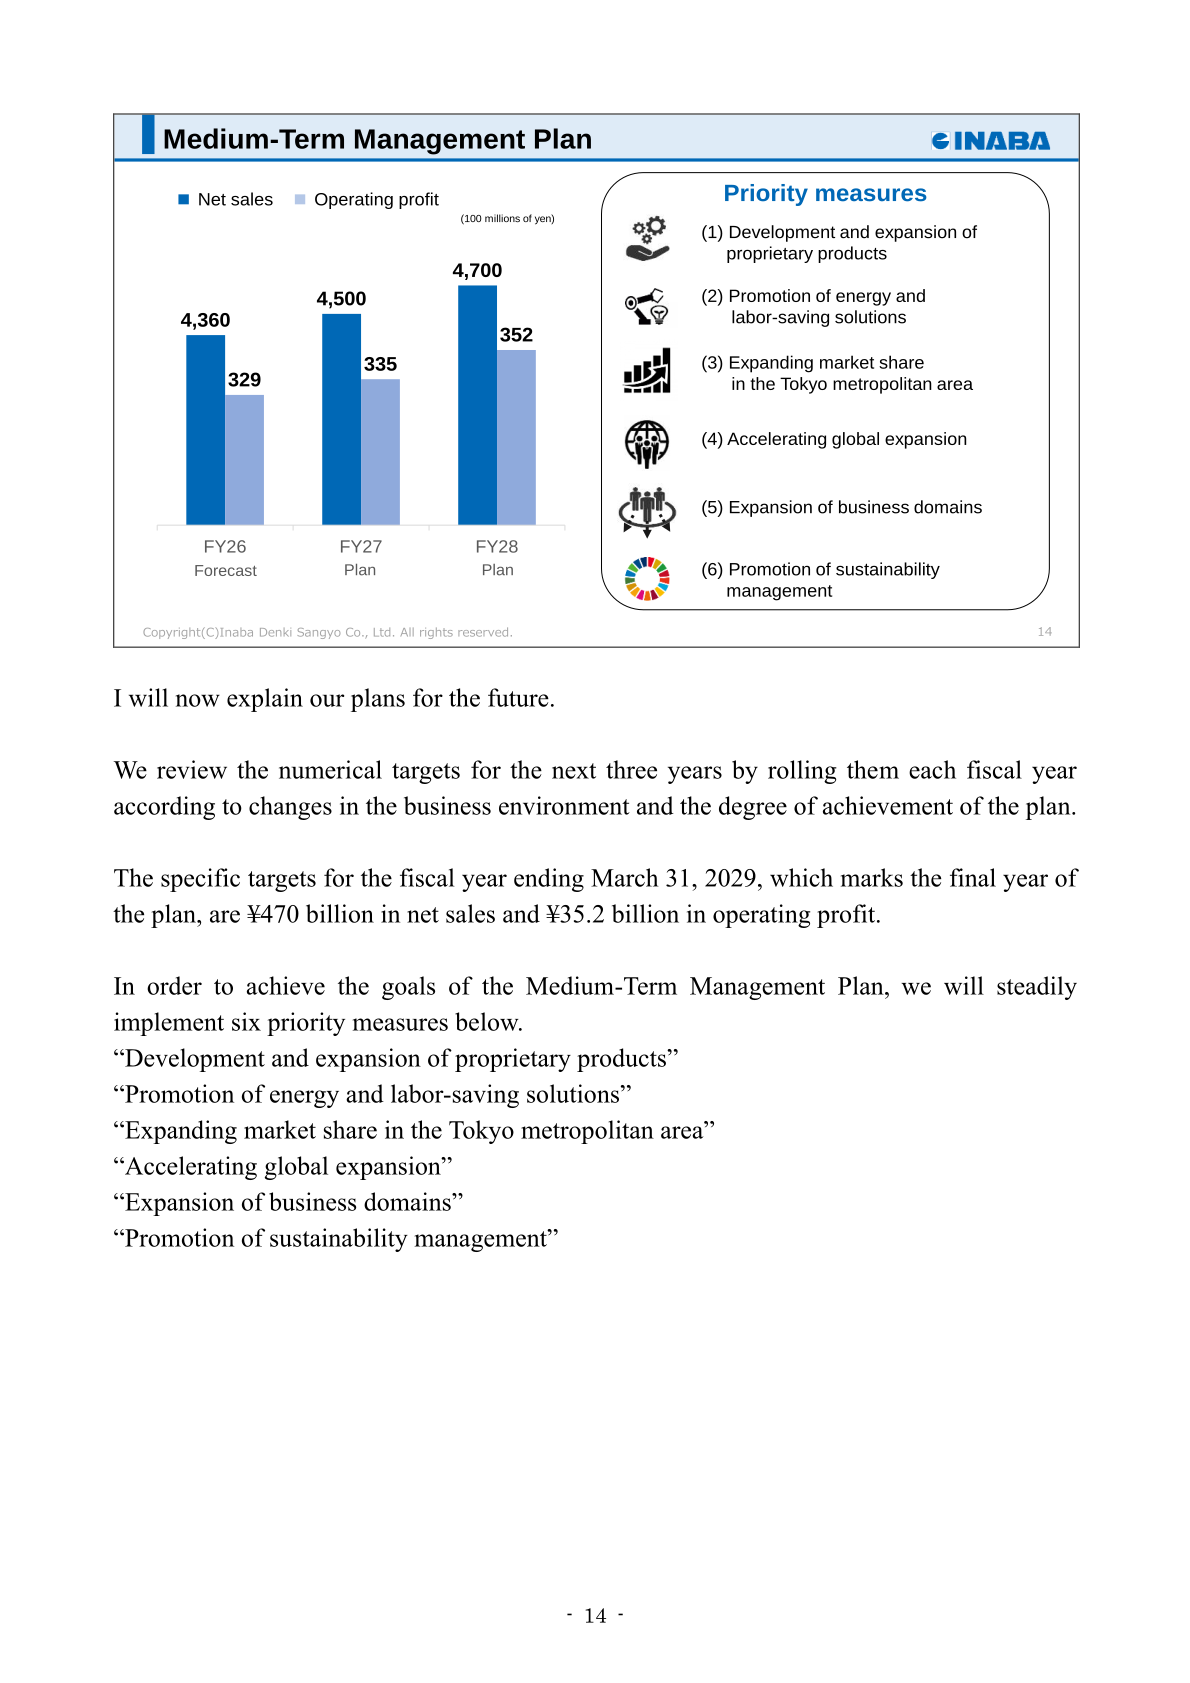
The company rolls forward its three-year numerical targets each fiscal year. Under the current plan, net sales are set at 4,360 for FY26 (forecast), 4,500 for FY27 (plan) and 4,700 for FY28 (plan), with operating profit of 329, 335 and 352 respectively (100 millions of yen); the targets for the fiscal year ending March 31, 2029, the final year of the plan, are ¥470 billion in net sales and ¥35.2 billion in operating profit. Six priority measures support the plan: development and expansion of proprietary products; promotion of energy and labor-saving solutions; expanding market share in the Tokyo metropolitan area; accelerating global expansion; expansion of business domains; and promotion of sustainability management.
On capital policy, ROE rose to 12.7% in FY25 against a reference cost of equity of 5.9%, and the company notes ROE has remained in the 8-12% range over the five years from fiscal 2021 to fiscal 2025. In FY25 the company invested approximately ¥7.5 billion in businesses, including construction of the R&D facility “Innovation Center”, core IT systems upgrades and R&D. Under the cash allocation plan for FY26 to FY28, business investment is capped at approximately ¥35 billion in total over the three fiscal years, including approximately ¥10 billion for construction of the “Innovation Center” (including amounts already paid), while shareholder returns are maintained at a total return ratio of around 60%. Liquidity on hand at the end of FY25 comprised cash and deposits of ¥71.3 billion and marketable securities of ¥15 billion.
This article is an analysis based on publicly available information and is not a recommendation to buy or sell any specific securities. Investment decisions are your own responsibility.
![[Obayashi] Investors’ Guide 2026 — The Complete 24-Article Breakdown](https://japan-equity.com/wp-content/uploads/2026/07/hub_cover-1024x1024.png)
![[Obayashi] IR & SR Policy — Feeding Dialogue Back into Management](https://japan-equity.com/wp-content/uploads/2026/07/p32_sq-1024x1024.jpg)
![[Obayashi] Real Estate Development — 18.7% Margin, ¥287.7bn Unrealized Gains](https://japan-equity.com/wp-content/uploads/2026/07/p20_sq-1024x1024.jpg)
![[Obayashi] Domestic Civil Engineering — Resilience Spending Supports 9.6% Margin](https://japan-equity.com/wp-content/uploads/2026/07/p11_sq-1024x1024.jpg)
![[Obayashi] Share Price & External Ratings — vs TOPIX, ESG Index Inclusion](https://japan-equity.com/wp-content/uploads/2026/07/p40_sq-1024x1024.jpg)
![[Construction] ¥75.5tn Investment, Shrinking Workforce — Big-5 Market Share](https://japan-equity.com/wp-content/uploads/2026/07/p12_sq-1024x1024.jpg)



![[Obayashi] Capital Policy & Shareholder Returns — ROE 10%+, DOE ~5%, ¥100bn Buyback](https://japan-equity.com/wp-content/uploads/2026/07/p27_sq-1024x1024.jpg)
![[Obayashi] Reducing Cross-Shareholdings — ¥285.2bn Sold in Five Years](https://japan-equity.com/wp-content/uploads/2026/07/p29_sq-1024x1024.jpg)
![[Obayashi] ¥750bn Investment Plan — ¥300bn to Development, ¥190bn to Tech/DX](https://japan-equity.com/wp-content/uploads/2026/07/p30_sq-1024x1024.jpg)
![[Obayashi] MTP2022 KPIs — Operating Profit ~2x Target, ROE 14.4%](https://japan-equity.com/wp-content/uploads/2026/07/p25_sq-1024x1024.jpg)
![[Obayashi] Cash Allocation — ¥420bn Investment CF Over Five Years](https://japan-equity.com/wp-content/uploads/2026/07/p26_sq-1024x1024.jpg)
![[Obayashi] Green Energy — 44 Plants, 344MW, and the Green Hydrogen Challenge](https://japan-equity.com/wp-content/uploads/2026/07/p21_sq-1024x1024.jpg)
![[Obayashi] Tackling the Labor Shortage — Robotics Construction®](https://japan-equity.com/wp-content/uploads/2026/07/p14_sq-1024x1024.jpg)
