
This article is based on publicly available IR materials and is not a recommendation to buy or sell any specific securities.
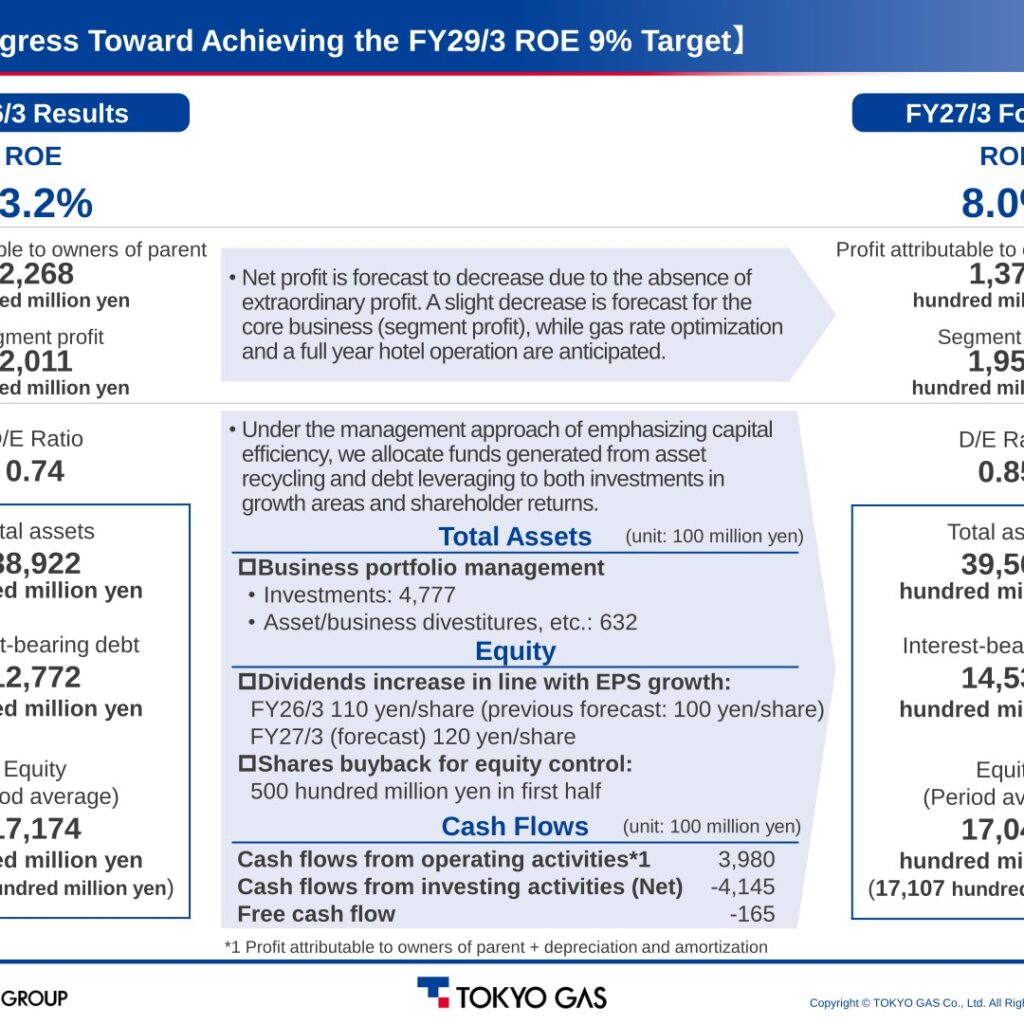
Tokyo Gas Co., Ltd. reported FY2025 (’25/4-’26/3) consolidated results, the final year of its previous Medium-term Management Plan, with net sales of 28,347 hundred million yen (+7.5% YoY) and segment profit of 2,011 hundred million yen (+45.1% YoY), driven by stabilizing earnings in the US shale gas business and higher electricity sales volume and unit prices. Profit attributable to owners of parent rose 205.8% YoY to 2,268 hundred million yen, boosted by accelerated real estate and fixed-asset sales and an extraordinary gain on a foreign currency translation adjustment tied to winding up Tokyo Gas Australia Pty Ltd.; ROE reached 13.2%. The company raised its FY2025 dividend to 110 yen/share and forecasts 120 yen/share for FY2026 (’26/4-’27/3), while forecasting FY2026 profit attributable to owners of parent to decline 39.6% YoY to 1,370 hundred million yen on the absence of these extraordinary gains. In October 2025 Tokyo Gas released a new Medium-term Management Plan targeting a Group ROE of 9% in FY2028 (’28/4-’29/3).
Consolidated Results (Full-Year Actual)
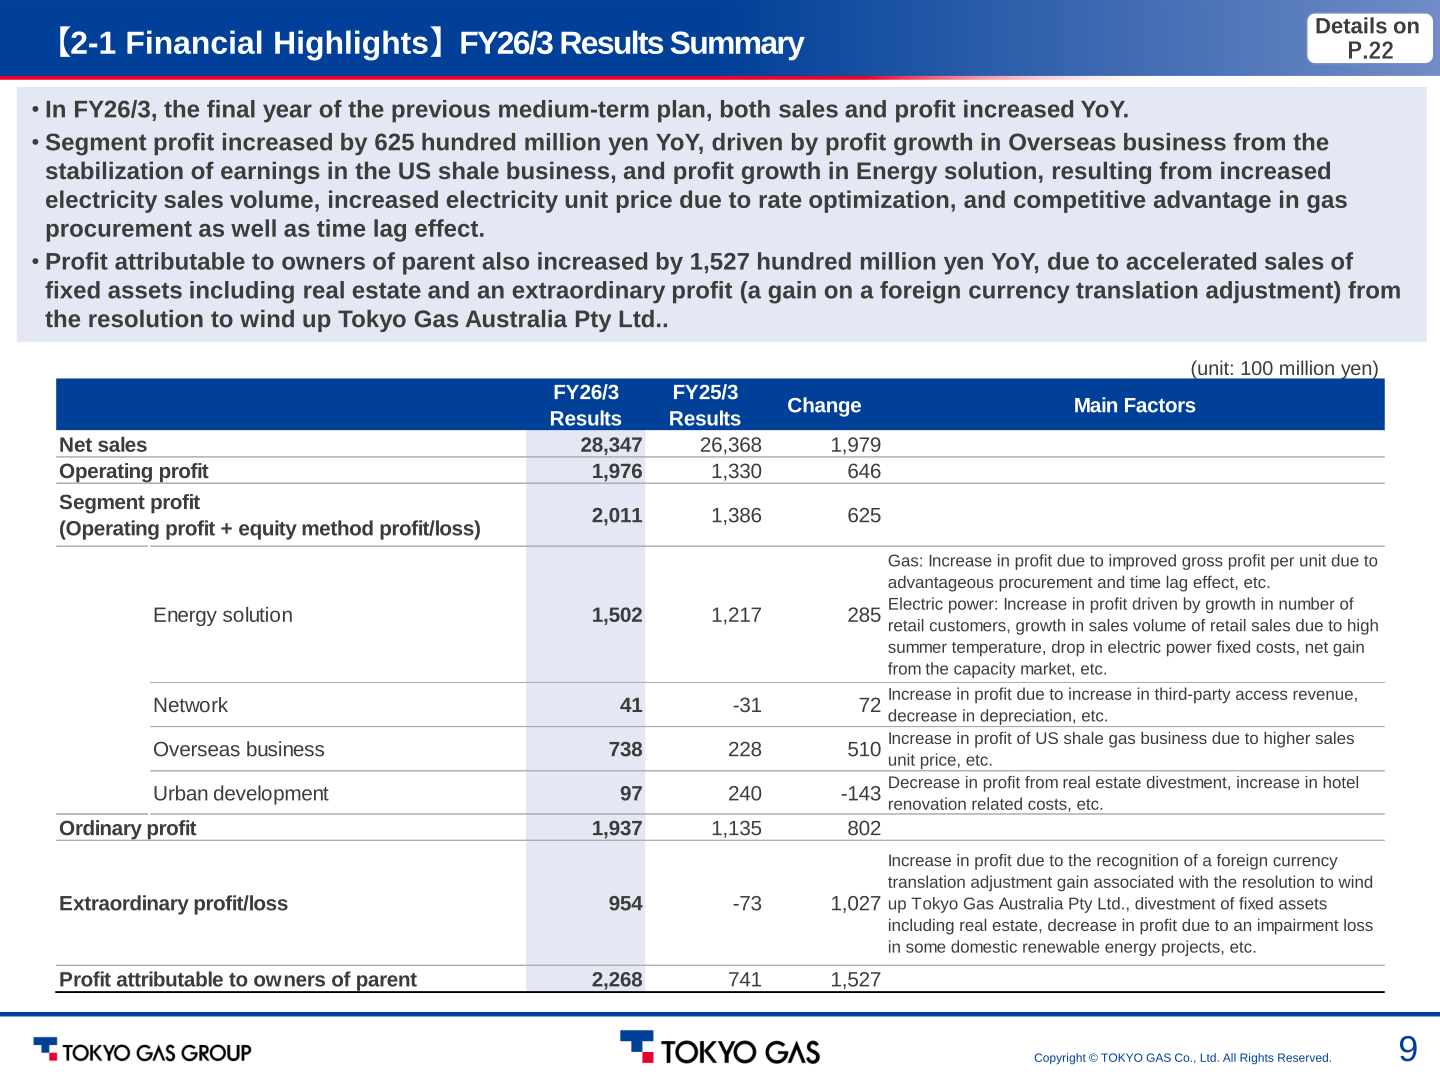
For FY2025 (’25/4-’26/3), the final year of the company’s previous Medium-term Management Plan, both sales and profit increased year on year. Net sales rose to 28,347 hundred million yen (+7.5% YoY), and segment profit rose 625 hundred million yen (+45.1%) to 2,011 hundred million yen, driven by profit growth in Overseas business from the stabilization of earnings in the US shale business, and profit growth in Energy solution from increased electricity sales volume, increased electricity unit price due to rate optimization, and competitive advantage in gas procurement as well as the time-lag effect. Profit attributable to owners of parent increased 1,527 hundred million yen (+205.8%) to 2,268 hundred million yen, due to accelerated sales of fixed assets including real estate and an extraordinary profit (a gain on a foreign currency translation adjustment) from the resolution to wind up Tokyo Gas Australia Pty Ltd. ROE rose to 13.2% from 4.3%, and EPS rose to 654.76 yen from 192.22 yen. (Figures below are in hundred million yen unless otherwise noted.)
| Item | FY2025 (’25/4-’26/3) | FY2024 (’24/4-’25/3) | Change |
|---|---|---|---|
| Net sales | 28,347 | 26,368 | +1,979 (+7.5%) |
| Operating profit | 1,976 | 1,330 | +646 (+48.5%) |
| Segment profit (Operating profit + equity method profit/loss) | 2,011 | 1,386 | +625 (+45.1%) |
| Ordinary profit | 1,937 | 1,135 | +802 (+70.5%) |
| Extraordinary profit/loss | 954 | -73 | +1,027 |
| Profit attributable to owners of parent | 2,268 | 741 | +1,527 (+205.8%) |
| ROE | 13.2% | 4.3% | +8.8pt |
| EPS | 654.76 yen | 192.22 yen | +462.54 yen (+240.6%) |
| D/E ratio | 0.74 | 0.77 | -0.03 |
Segment Results
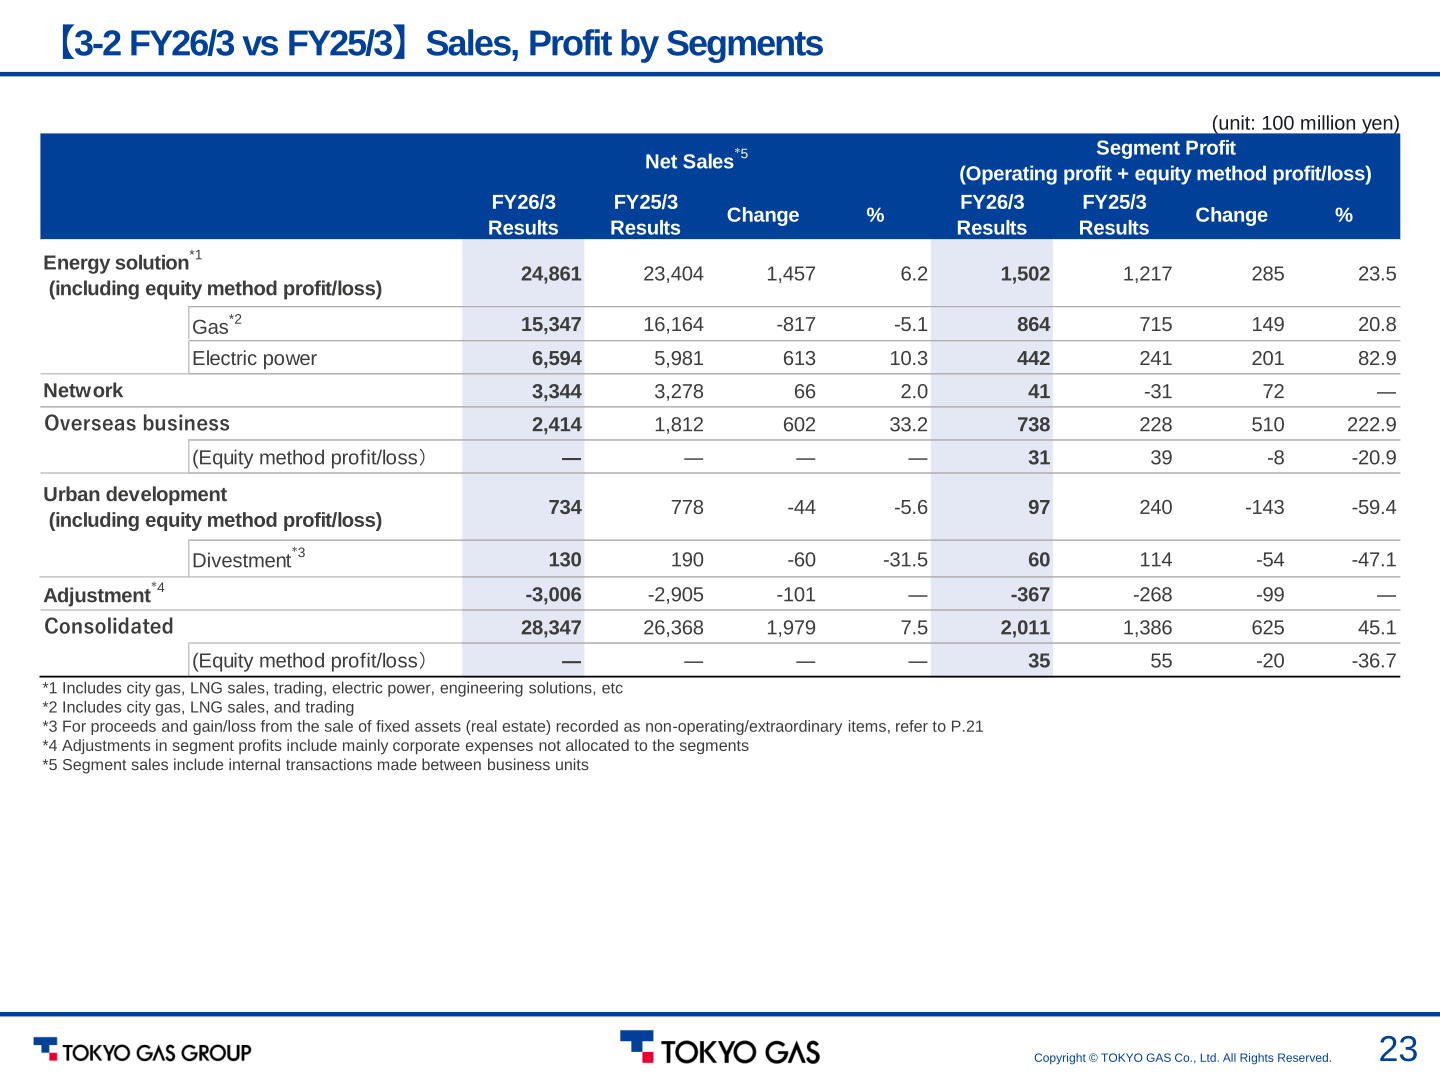
By segment for FY2025 (’25/4-’26/3) vs. FY2024 (’24/4-’25/3): Energy solution net sales rose 6.2% to 24,861 hundred million yen and segment profit rose 23.5% to 1,502 hundred million yen, with Gas profit up 20.8% to 864 hundred million yen on improved gross profit per unit from advantageous procurement and the time-lag effect, and Electric power profit up 82.9% to 442 hundred million yen on growth in retail customers, higher summer-temperature-driven sales volume, lower fixed costs, and a net gain from the capacity market. Network segment profit turned positive at 41 hundred million yen (from -31 hundred million yen a year earlier), on increased third-party access revenue and lower depreciation. Overseas business profit rose 222.9% to 738 hundred million yen, driven by a higher sales unit price in the US shale gas business. Urban development segment profit fell 59.4% to 97 hundred million yen, due to a decrease in profit from real estate divestment and increased hotel renovation-related costs.
| Segment | Net Sales FY2025 | Net Sales FY2024 | Segment Profit FY2025 | Segment Profit FY2024 |
|---|---|---|---|---|
| Energy solution (incl. equity method profit/loss) | 24,861 | 23,404 | 1,502 | 1,217 |
| – Gas | 15,347 | 16,164 | 864 | 715 |
| – Electric power | 6,594 | 5,981 | 442 | 241 |
| Network | 3,344 | 3,278 | 41 | -31 |
| Overseas business | 2,414 | 1,812 | 738 | 228 |
| Urban development | 734 | 778 | 97 | 240 |
| Adjustment | -3,006 | -2,905 | -367 | -268 |
| Consolidated | 28,347 | 26,368 | 2,011 | 1,386 |
FY2026 Forecast
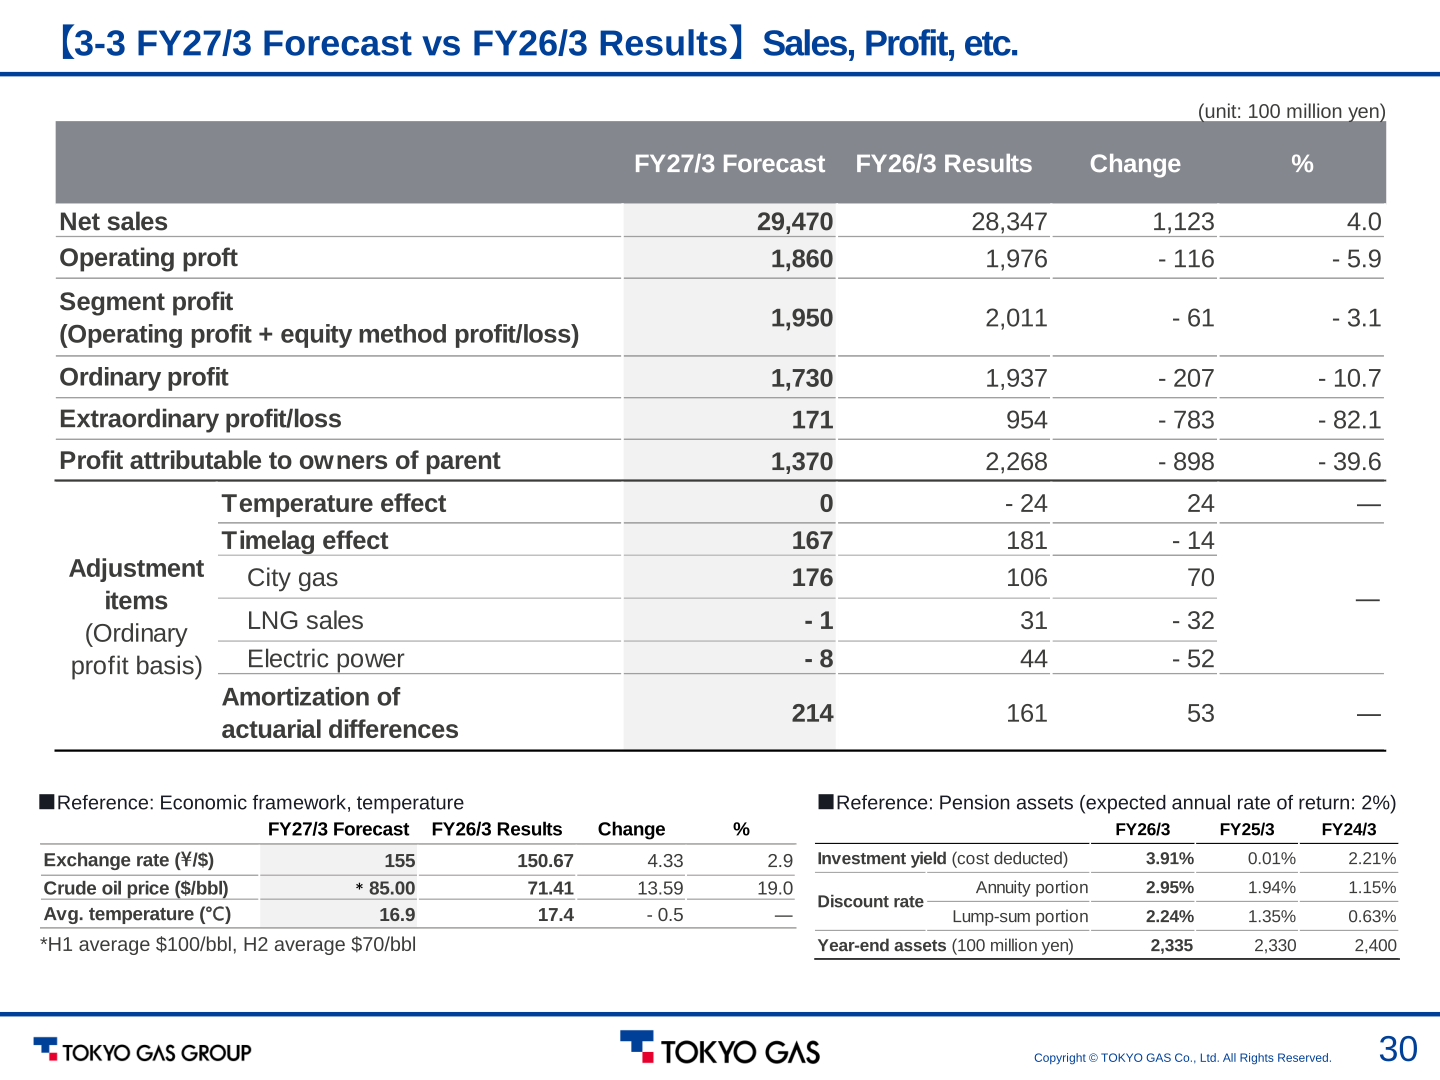
For FY2026 (’26/4-’27/3), Tokyo Gas forecasts net sales of 29,470 hundred million yen (+4.0% YoY) but segment profit of 1,950 hundred million yen (-3.1% YoY) and profit attributable to owners of parent of 1,370 hundred million yen (-39.6% YoY, a decrease of 898 hundred million yen), due to a decrease in extraordinary profit reflecting the absence of the gain on foreign currency translation adjustment and the gain on sale of real estate recorded in FY2025. The forecast partially factors in the current situation in the Middle East, assuming a JCC crude oil price of $100/bbl in H1 and $70/bbl in H2. Profit growth is anticipated in Overseas business from a strong US shale gas business and a recovery in the mid/downstream business, and in Urban development from the full-year operation of the renovated Park Hyatt Tokyo hotel (reopened December 9, 2025); however, Energy solution profit is forecast to decrease due to higher electricity procurement unit prices from high JEPX prices and increased fixed costs for power generation, which outweigh positive factors such as gas rate optimization. ROE is forecast to decline to 8.0% and EPS to 418.07 yen.
| Item | FY2026 (’26/4-’27/3) Forecast | FY2025 (Actual) | Change |
|---|---|---|---|
| Net sales | 29,470 | 28,347 | +1,123 (+4.0%) |
| Operating profit | 1,860 | 1,976 | -116 (-5.9%) |
| Segment profit | 1,950 | 2,011 | -61 (-3.1%) |
| Ordinary profit | 1,730 | 1,937 | -207 (-10.7%) |
| Extraordinary profit/loss | 171 | 954 | -783 (-82.1%) |
| Profit attributable to owners of parent | 1,370 | 2,268 | -898 (-39.6%) |
| ROE | 8.0% | 13.2% | -5.2pt |
| EPS | 418.07 yen | 654.76 yen | -236.69 yen (-36.1%) |
| D/E ratio | 0.85 | 0.74 | +0.11 |
Shareholder Returns
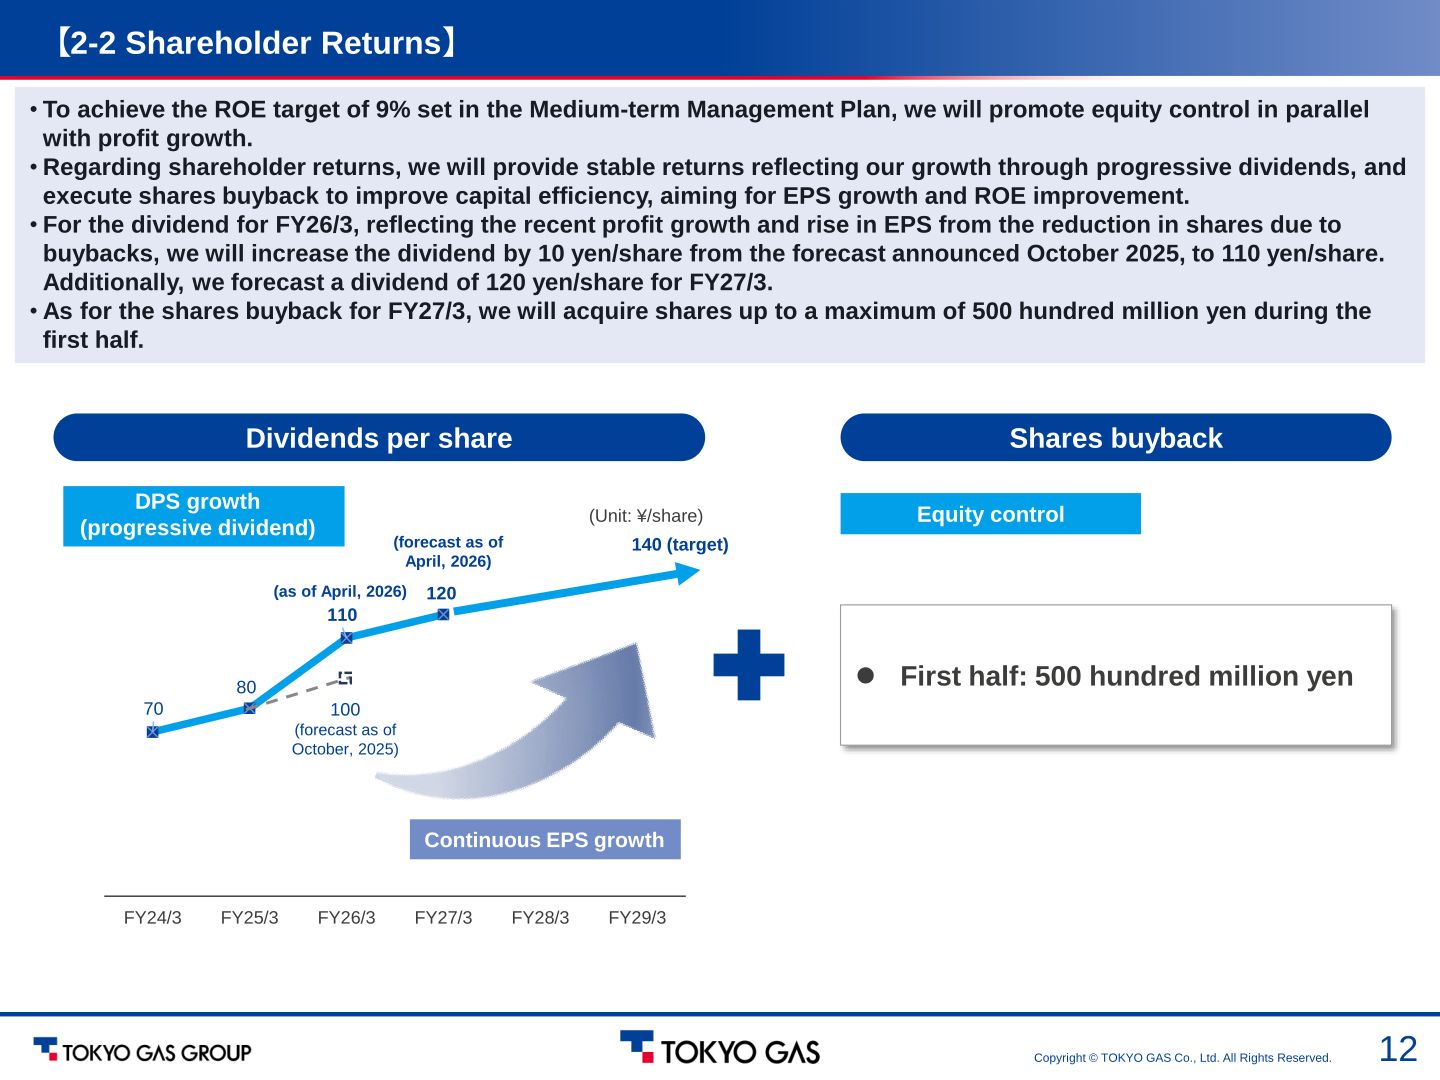
Tokyo Gas raised its FY2025 (’25/4-’26/3) dividend to 110 yen/share, up 10 yen/share from the 100 yen/share forecast announced in October 2025, reflecting recent profit growth and a rise in EPS from the reduction in shares due to buybacks; the company forecasts a further increase to 120 yen/share for FY2026 (’26/4-’27/3), and targets 140 yen/share by FY2028 (’28/4-’29/3) as part of a progressive dividend policy tied to continuous EPS growth. On shares buybacks, Tokyo Gas conducted buybacks of 1,200 hundred million yen in FY2024 (’24/4-’25/3) and 2,000 hundred million yen in FY2025 (’25/4-’26/3); for FY2026 (’26/4-’27/3), the company plans to acquire shares up to a maximum of 500 hundred million yen during the first half, as part of equity control aimed at EPS growth and ROE improvement. The FY2024 total return ratio (dividends plus following-year buybacks, divided by net income) was 310.4%; excluding buybacks carried out as part of capital policy, the total return on net income was 40.7% in FY2024. The comparable total return ratio for FY2025 is shown as a dash (not disclosed) in the source materials.
| Item | FY2023 (’23/4-’24/3) | FY2024 (’24/4-’25/3) | FY2025 (’25/4-’26/3) | FY2026 (’26/4-’27/3) Forecast | FY2028 (’28/4-’29/3) Target |
|---|---|---|---|---|---|
| Dividend per share | 70 yen | 80 yen | 110 yen (raised from the Oct. 2025 forecast of 100 yen) | 120 yen (forecast) | 140 yen (target) |
| Shares buyback | This cannot be confirmed from the materials. | 1,200 hundred million yen | 2,000 hundred million yen | Up to 500 hundred million yen in H1 | This cannot be confirmed from the materials. |
Medium-Term Plan / Topics
In October 2025, Tokyo Gas released its Medium-term Management Plan (MTMP) for FY2026-2028 (the company’s own fiscal-year labeling, ending FY29/3), targeting a Group ROE of 9% in FY2028 (’28/4-’29/3) while ensuring a sufficient equity spread over the Cost of Equity, which the company’s dialogue with investors indicated is around 6-7%. The plan promotes an integrated approach combining ROIC-based portfolio management, visualization of cash allocation, and optimization of capital structure. By segment, ROIC for FY2025 (’25/4-’26/3) results (with the 3-year WACC hurdle in parentheses) was: Energy (Gas, Electric power, Network) 6.9% (WACC 3.0%), Solutions 5.2% (WACC 4.0%), Overseas business 8.3%, including 11.6% for upstream only (WACC 8.0%, upstream-only WACC 8.5%), and Urban development 12.2% (WACC 4.0%), with Company-wide ROIC of 6.3% (WACC 3.5%). For FY2028 (’28/4-’29/3), the plan targets Company-wide invested capital of 30,200 hundred million yen and ROIC of 5.0%. Specific actions already taken to improve ROE include portfolio realignment — such as expanding US shale gas assets (Rockcliff and Chevron assets) while divesting non-core assets including GINZA gCUBE and reducing cross-shareholdings — share buybacks (1,200 hundred million yen in FY2024 and 2,000 hundred million yen in FY2025), and governance enhancements such as appointing external directors to committee chairmanships, establishing a Corporate Value Enhancement Committee, and introducing stock-based compensation for senior management. On cash allocation, for the FY2026-2028 (’26/4-’29/3) plan period, total investment net of cash-in from investment recovery and asset sales is planned at 4,145 hundred million yen for FY2026 alone (gross investment: 4,777 hundred million yen), in line with the plan, funded by operating cash flow of 3,980 hundred million yen and asset sales & debt of 3,000 hundred million yen, allocated to investments (including the US shale gas business and the Chiba-Sodegaura power station), strategic funds, and shareholder returns.
This article is an analysis based on publicly available information and is not a recommendation to buy or sell any specific securities. Investment decisions are your own responsibility.
![[Obayashi] Investors’ Guide 2026 — The Complete 24-Article Breakdown](https://japan-equity.com/wp-content/uploads/2026/07/hub_cover-1024x1024.png)
![[Obayashi] IR & SR Policy — Feeding Dialogue Back into Management](https://japan-equity.com/wp-content/uploads/2026/07/p32_sq-1024x1024.jpg)
![[Obayashi] Real Estate Development — 18.7% Margin, ¥287.7bn Unrealized Gains](https://japan-equity.com/wp-content/uploads/2026/07/p20_sq-1024x1024.jpg)
![[Obayashi] Domestic Civil Engineering — Resilience Spending Supports 9.6% Margin](https://japan-equity.com/wp-content/uploads/2026/07/p11_sq-1024x1024.jpg)
![[Obayashi] Share Price & External Ratings — vs TOPIX, ESG Index Inclusion](https://japan-equity.com/wp-content/uploads/2026/07/p40_sq-1024x1024.jpg)
![[Construction] ¥75.5tn Investment, Shrinking Workforce — Big-5 Market Share](https://japan-equity.com/wp-content/uploads/2026/07/p12_sq-1024x1024.jpg)



![[Obayashi] Capital Policy & Shareholder Returns — ROE 10%+, DOE ~5%, ¥100bn Buyback](https://japan-equity.com/wp-content/uploads/2026/07/p27_sq-1024x1024.jpg)
![[Obayashi] Reducing Cross-Shareholdings — ¥285.2bn Sold in Five Years](https://japan-equity.com/wp-content/uploads/2026/07/p29_sq-1024x1024.jpg)
![[Obayashi] ¥750bn Investment Plan — ¥300bn to Development, ¥190bn to Tech/DX](https://japan-equity.com/wp-content/uploads/2026/07/p30_sq-1024x1024.jpg)
![[Obayashi] MTP2022 KPIs — Operating Profit ~2x Target, ROE 14.4%](https://japan-equity.com/wp-content/uploads/2026/07/p25_sq-1024x1024.jpg)
![[Obayashi] Cash Allocation — ¥420bn Investment CF Over Five Years](https://japan-equity.com/wp-content/uploads/2026/07/p26_sq-1024x1024.jpg)
![[Obayashi] Green Energy — 44 Plants, 344MW, and the Green Hydrogen Challenge](https://japan-equity.com/wp-content/uploads/2026/07/p21_sq-1024x1024.jpg)
![[Obayashi] Tackling the Labor Shortage — Robotics Construction®](https://japan-equity.com/wp-content/uploads/2026/07/p14_sq-1024x1024.jpg)
