
This article is based on publicly available IR materials and is not a recommendation to buy or sell any specific securities.
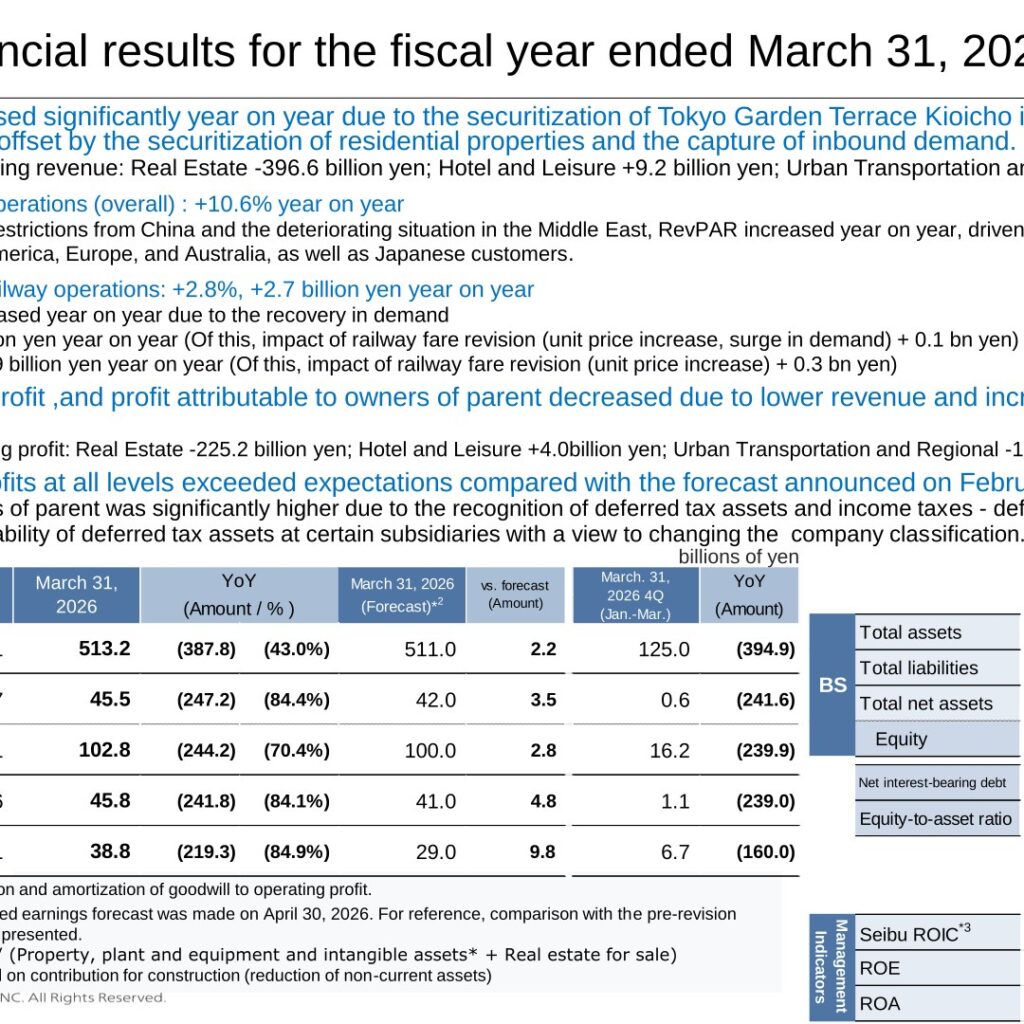
Note: Seibu Holdings’ fiscal year ended March 31, 2026; on japan-equity.com this most recent completed fiscal year is classified as FY2025, while the text, tables and slides below keep the period labels used in the company’s own materials. For the fiscal year ended March 31, 2026, operating revenue was 513.2 billion yen, down 387.8 billion yen or 43.0% year on year, and operating profit was 45.5 billion yen, down 247.2 billion yen or 84.4%. Operating revenue decreased significantly year on year due to the securitization of Tokyo Garden Terrace Kioicho in the previous fiscal year, although this was partially offset by the securitization of residential properties and the capture of inbound demand. Profit attributable to owners of parent was 38.8 billion yen, down 219.3 billion yen or 84.9%, and operating revenue and profits at all levels exceeded expectations compared with the forecast announced on February 12, 2026.
Consolidated Results (Full-Year Actual)
On the consolidated statement of income, operating revenue was 513,286 million yen and operating expenses were 467,763 million yen, giving operating profit of 45,522 million yen. Non-operating income rose 4,229 million yen to 8,507 million yen while non-operating expenses fell 1,164 million yen to 8,208 million yen, leaving ordinary profit of 45,821 million yen. Extraordinary income of 68,105 million yen included 58,369 million yen of contribution received for construction relating to the continuous grade-separation work on the Higashi Murayama station area, while extraordinary losses of 68,548 million yen included a 58,365 million yen tax purpose reduction entry of contribution for construction and 5,392 million yen of impairment losses. Income taxes were 6,248 million yen; the company notes that profit attributable to owners of parent was significantly higher than forecast due to the recognition of deferred tax assets and income taxes – deferred (benefit) following a detailed examination of the recoverability of deferred tax assets at certain subsidiaries.
| Item (billions of yen) | March 31, 2025 | March 31, 2026 | YoY (Amount) | YoY (%) |
|---|---|---|---|---|
| Operating revenue | 901.1 | 513.2 | (387.8) | (43.0%) |
| Operating profit | 292.7 | 45.5 | (247.2) | (84.4%) |
| EBITDA | 347.1 | 102.8 | (244.2) | (70.4%) |
| Ordinary profit | 287.6 | 45.8 | (241.8) | (84.1%) |
| Profit attributable to owners of parent | 258.1 | 38.8 | (219.3) | (84.9%) |
Total assets stood at 1,730.6 billion yen, down 103.4 billion yen year on year, and total net assets at 574.5 billion yen, up 7.4 billion yen, of which equity was 568.7 billion yen. Net interest-bearing debt increased 205.0 billion yen to 589.3 billion yen and the equity-to-asset ratio rose 2.2pt to 32.9%. Among the management indicators disclosed, Seibu ROIC was 2.5%, down 13.6pt, ROE was 6.9%, down 45.4pt, and ROA was 2.2%, down 12.7pt.
Segment Results
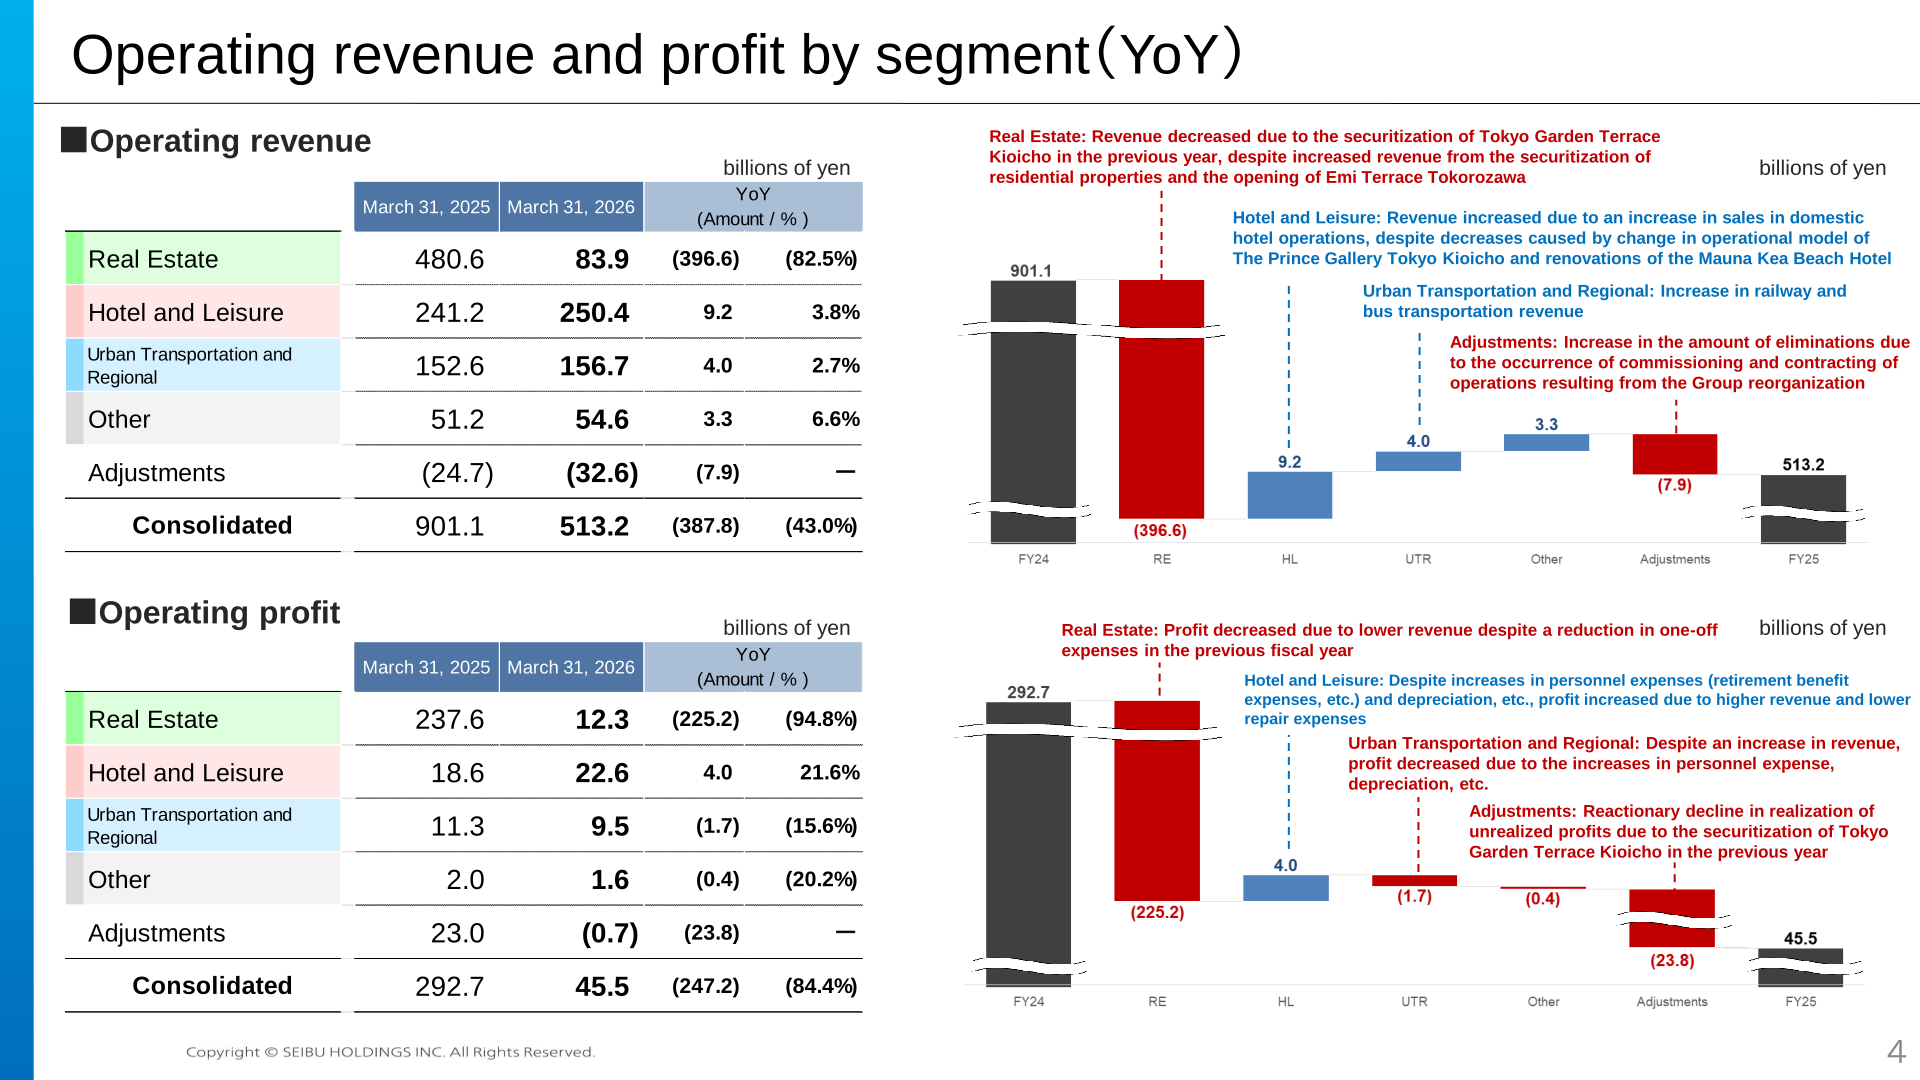
Real Estate operating revenue fell 396.6 billion yen, or 82.5%, to 83.9 billion yen and operating profit fell 225.2 billion yen, or 94.8%, to 12.3 billion yen, reflecting the securitization of Tokyo Garden Terrace Kioicho in the previous year despite increased revenue from the securitization of residential properties and the opening of Emi Terrace Tokorozawa. Hotel and Leisure revenue rose 9.2 billion yen, or 3.8%, to 250.4 billion yen and operating profit rose 4.0 billion yen, or 21.6%, to 22.6 billion yen. Urban Transportation and Regional revenue rose 4.0 billion yen, or 2.7%, to 156.7 billion yen on higher railway and bus transportation revenue, while its operating profit fell 1.7 billion yen, or 15.6%, to 9.5 billion yen on increases in personnel expenses and depreciation. The Other segment recorded revenue of 54,666 million yen, up 6.6%, and operating profit of 1,648 million yen, down 20.2%, as higher team strengthening and promotion costs for the professional baseball team and higher personnel expenses offset revenue growth.
| Segment (billions of yen) | Operating revenue March 31, 2025 | Operating revenue March 31, 2026 | Operating profit March 31, 2025 | Operating profit March 31, 2026 |
|---|---|---|---|---|
| Real Estate | 480.6 | 83.9 | 237.6 | 12.3 |
| Hotel and Leisure | 241.2 | 250.4 | 18.6 | 22.6 |
| Urban Transportation and Regional | 152.6 | 156.7 | 11.3 | 9.5 |
| Other | 51.2 | 54.6 | 2.0 | 1.6 |
| Adjustments | (24.7) | (32.6) | 23.0 | (0.7) |
| Consolidated | 901.1 | 513.2 | 292.7 | 45.5 |
Real Estate
Within Real Estate, development and leasing operations recorded operating revenue of 34,803 million yen, down 21.5%, and operating profit of 13,585 million yen, down 24.9%, as lower lease revenue following the securitization of Tokyo Garden Terrace Kioicho was partly offset by the opening of Emi Terrace Tokorozawa. Investment management operations recorded revenue of 9,785 million yen and profit of 5,604 million yen, both down 97.6% against the previous year’s securitization of Tokyo Garden Terrace Kioicho. Management operations revenue rose 90.9% to 15,946 million yen following the commissioning and contracting of property management operations due to the internal reorganization of the Group, and others recorded 23,464 million yen. Segment EBITDA was 20,647 million yen, down 91.7%. Assets under management were 387.6 billion yen as of March 31, 2026.
Hotel and Leisure
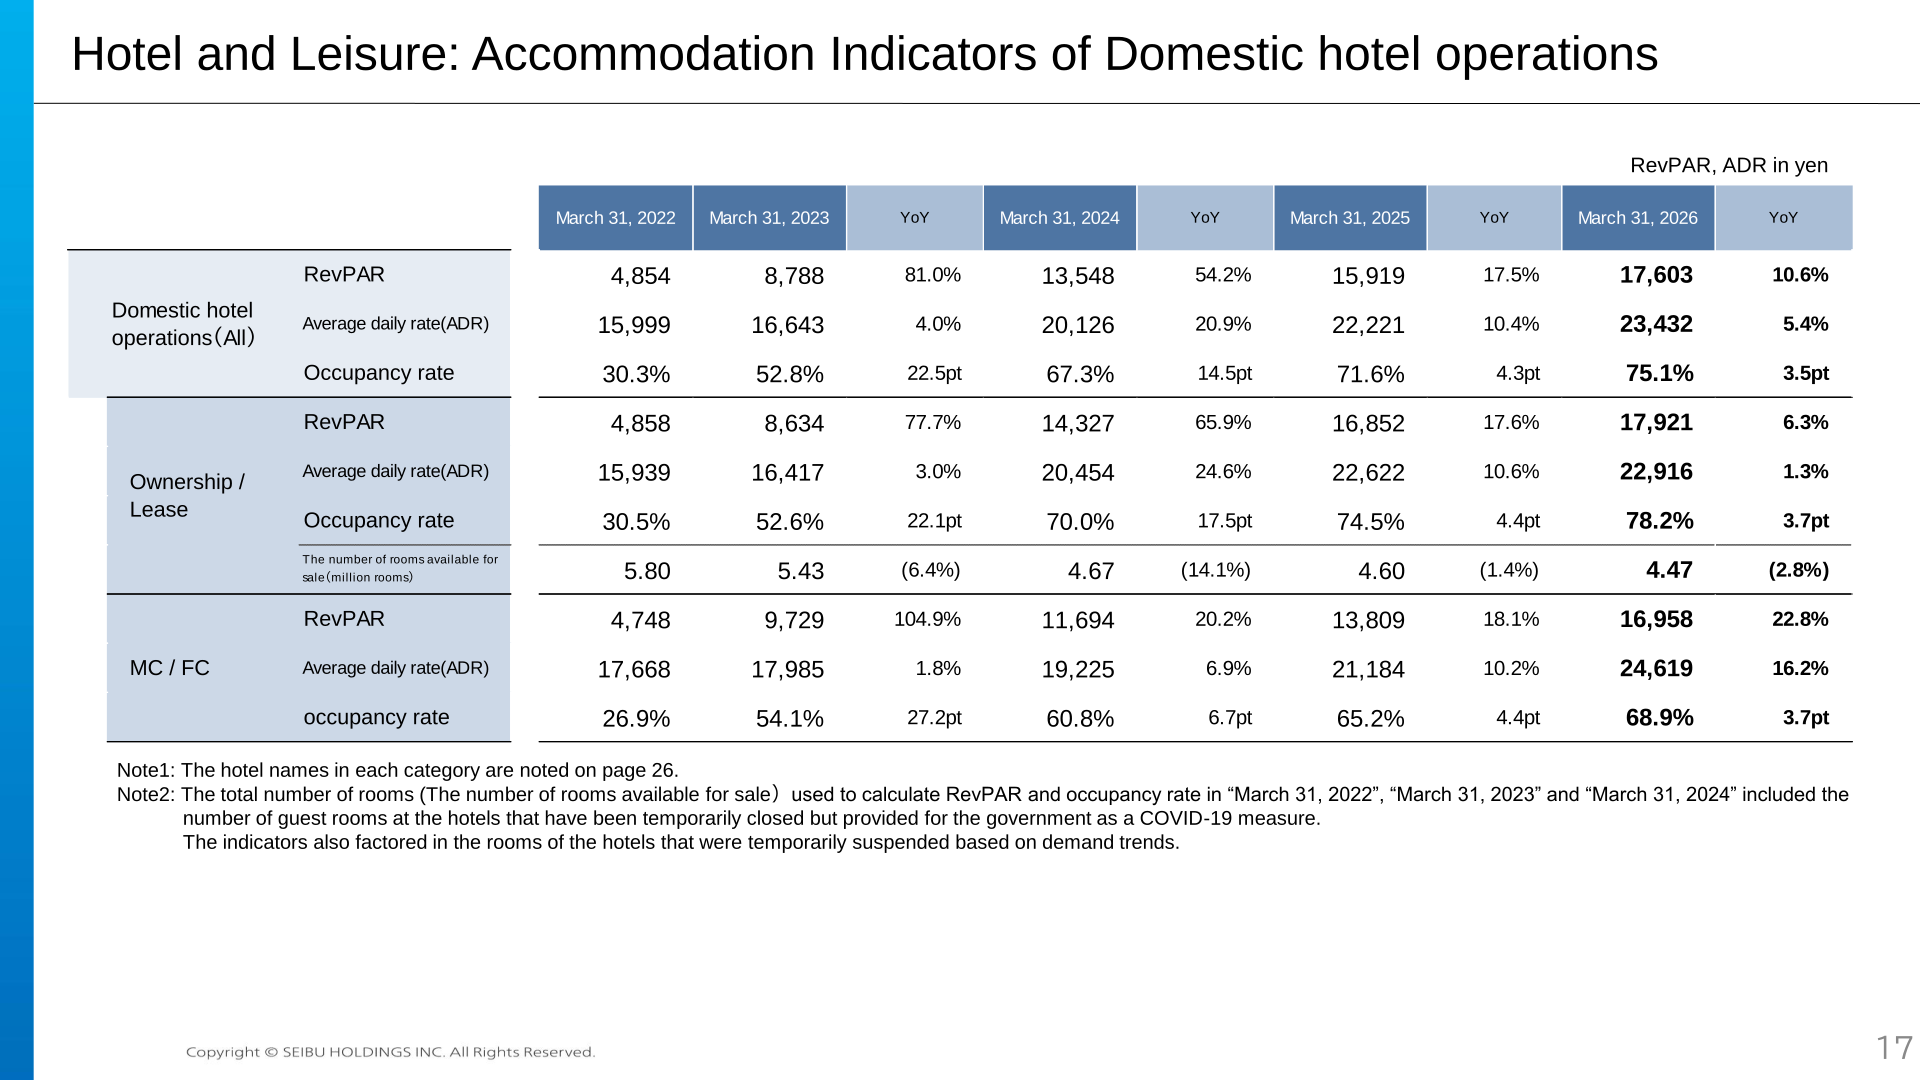
Domestic hotel operations (Ownership / Lease) recorded operating revenue of 153,896 million yen, up 1.4%, and operating profit of 36,492 million yen, up 16.4%, on higher RevPAR and lower repair expenses and fixture and consumable costs. Domestic hotel operations (MC / FC) revenue rose 22.6% to 15,804 million yen following the change in operational model of The Prince Gallery Tokyo Kioicho. Overseas hotel operations (Ownership / Lease) revenue rose 8.1% to 36,686 million yen but the operation posted an operating loss of 1,711 million yen on higher depreciation and personnel expenses, with the Mauna Kea Beach Hotel partially closed for renovations. Sports operations (Ownership / Lease) revenue rose 4.5% to 16,244 million yen. Segment EBITDA was 40,307 million yen, up 19.6%. The 153.8 billion yen of operating revenue at domestic hotel operations (Ownership / Lease) comprised accommodation of 90.6 billion yen, of which room revenue was 80.2 billion yen, banquets of 29.7 billion yen, restaurants of 27.1 billion yen and other of 6.3 billion yen.
| Domestic hotel operations indicator | March 31, 2025 | March 31, 2026 | YoY |
|---|---|---|---|
| RevPAR, All (yen) | 15,919 | 17,603 | 10.6% |
| Average daily rate (ADR), All (yen) | 22,221 | 23,432 | 5.4% |
| Occupancy rate, All | 71.6% | 75.1% | 3.5pt |
| RevPAR, Ownership / Lease (yen) | 16,852 | 17,921 | 6.3% |
| RevPAR, MC / FC (yen) | 13,809 | 16,958 | 22.8% |
The company reports that RevPAR increased year on year despite the impact of travel restrictions from China and the deteriorating situation in the Middle East, driven by the capture of inbound individual tourists, mainly from North America, Europe and Australia, as well as Japanese customers. In domestic hotel operations (Ownership / Lease), non-Japanese customers numbered 1,175 thousand, or 34.2% of customers, and non-Japanese room revenue was 40,161 million yen, up 3.9% year on year and equal to 50.1% of room revenue. Across all domestic hotel operations, total customers were 5,143 thousand, up 3.2%, with non-Japanese customers at 1,721 thousand, or 33.5% of the total.
Urban Transportation and Regional
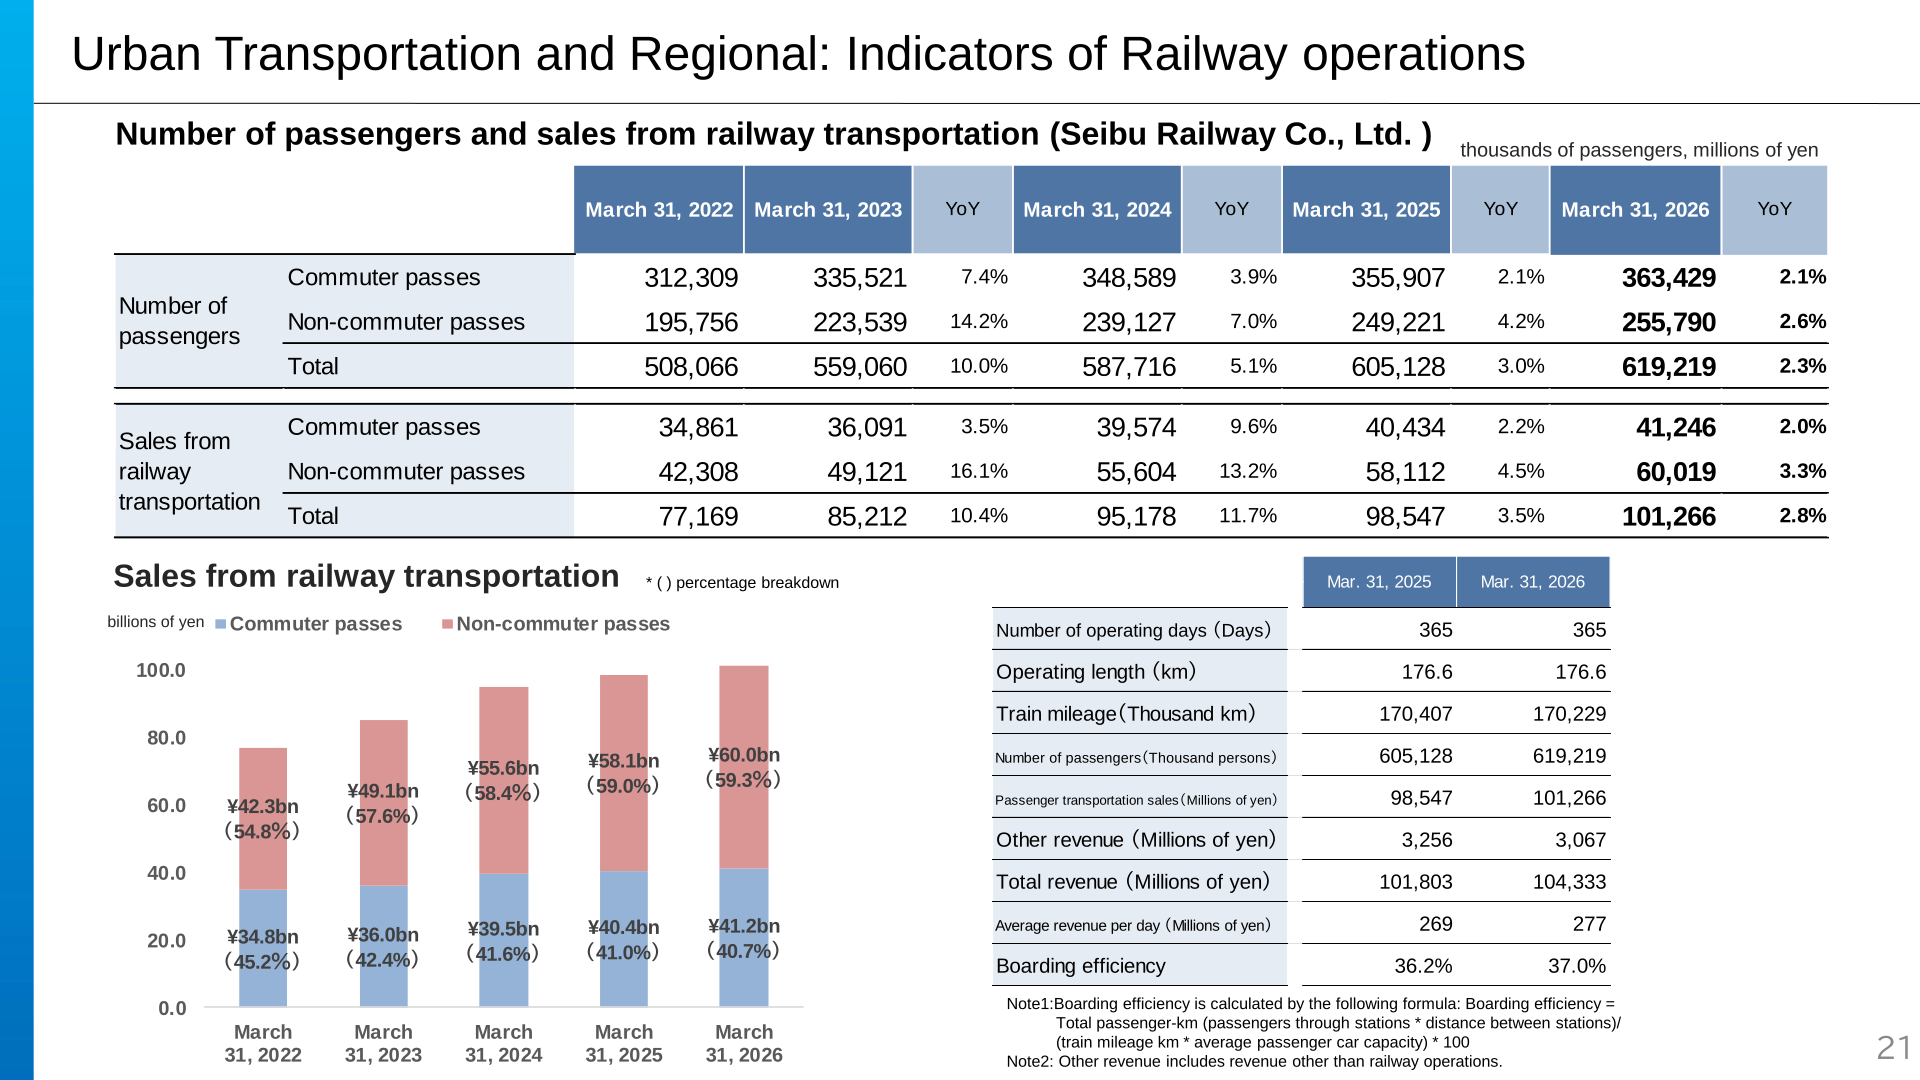
Railway operations revenue rose 2.7% to 107,019 million yen while operating profit fell 9.5% to 21,710 million yen on increases in personnel expenses and depreciation. Bus operations revenue rose 2.7% to 25,557 million yen and lifestyle service operations along railway lines rose 3.5% to 17,835 million yen, helped by higher revenue from in-station convenience stores TOMONY. Segment EBITDA was 34,494 million yen, up 1.6%. At Seibu Railway Co., Ltd., the number of passengers rose 2.3% to 619,219 thousand and sales from railway transportation rose 2.8% to 101,266 million yen, with total revenue of 104,333 million yen and boarding efficiency of 37.0% against 36.2% a year earlier.
| Seibu Railway Co., Ltd. | March 31, 2025 | March 31, 2026 | YoY |
|---|---|---|---|
| Number of passengers – Commuter passes (thousands) | 355,907 | 363,429 | 2.1% |
| Number of passengers – Non-commuter passes (thousands) | 249,221 | 255,790 | 2.6% |
| Number of passengers – Total (thousands) | 605,128 | 619,219 | 2.3% |
| Sales from railway transportation – Commuter passes (millions of yen) | 40,434 | 41,246 | 2.0% |
| Sales from railway transportation – Non-commuter passes (millions of yen) | 58,112 | 60,019 | 3.3% |
| Sales from railway transportation – Total (millions of yen) | 98,547 | 101,266 | 2.8% |
Results versus Forecast
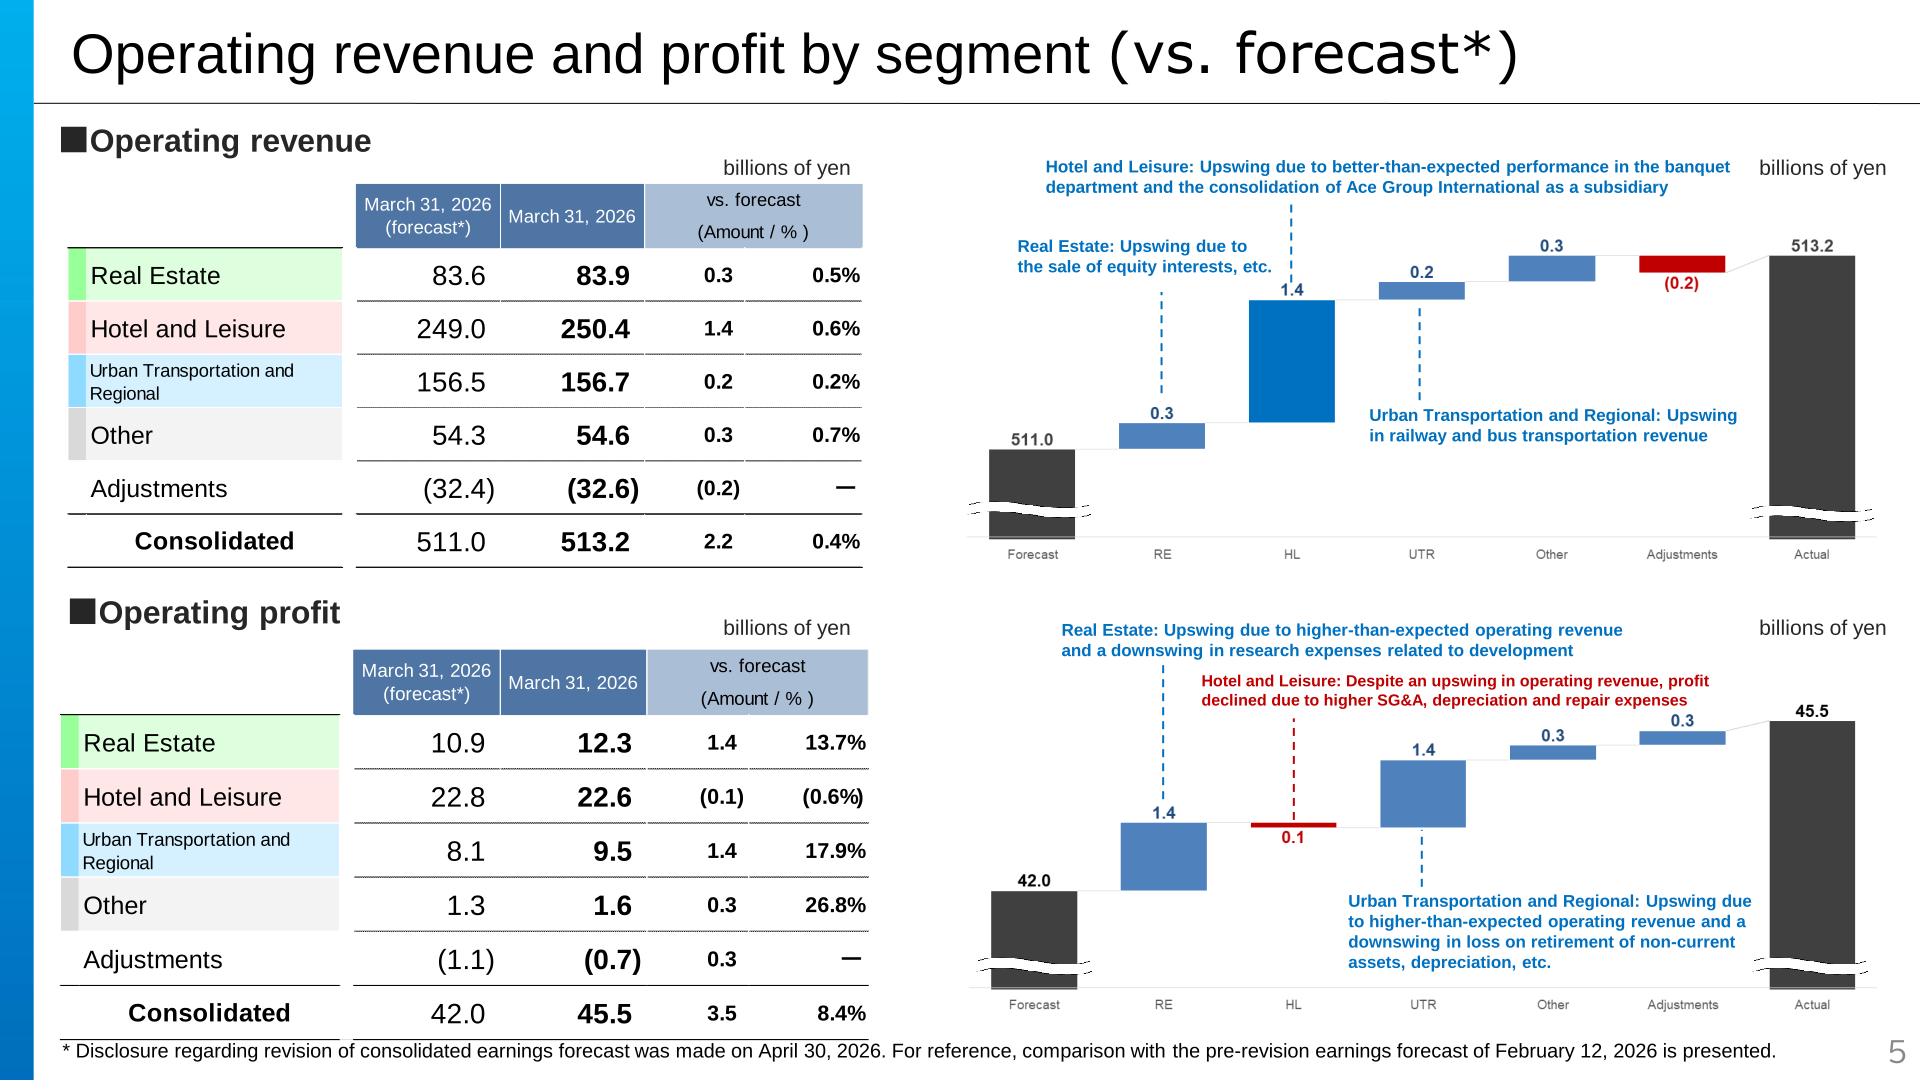
The materials compare the results with the pre-revision earnings forecast of February 12, 2026, noting that disclosure regarding the revision of the consolidated earnings forecast was made on April 30, 2026. Operating revenue of 513.2 billion yen exceeded the 511.0 billion yen forecast by 2.2 billion yen, or 0.4%; operating profit of 45.5 billion yen exceeded the 42.0 billion yen forecast by 3.5 billion yen, or 8.4%; EBITDA of 102.8 billion yen exceeded the 100.0 billion yen forecast by 2.8 billion yen; ordinary profit of 45.8 billion yen exceeded the 41.0 billion yen forecast by 4.8 billion yen; and profit attributable to owners of parent of 38.8 billion yen exceeded the 29.0 billion yen forecast by 9.8 billion yen. By segment, Real Estate operating profit was 1.4 billion yen, or 13.7%, above forecast and Urban Transportation and Regional was 1.4 billion yen, or 17.9%, above, while Hotel and Leisure was 0.1 billion yen, or 0.6%, below. This presentation does not contain an earnings forecast for the following fiscal year.
Shareholder Returns
This presentation does not disclose a dividend per share or a shareholder return policy; this cannot be confirmed from the materials. Cash flows from financing activities were an outflow of 76,733 million yen, which the company attributes mainly to the purchase of treasury shares in the current fiscal year, against an outflow of 136,394 million yen in the previous fiscal year. Within equity, treasury shares changed by 21,275 million yen, retained earnings by 27,070 million yen and capital surplus by minus 68,886 million yen.
Capital Investment and Cash Flows
Total capital investment rose 47,478 million yen to 150,730 million yen, comprising Hotel and Leisure 49,809 million yen for items including the Mauna Kea Beach Hotel renovations completed in April 2026, Urban Transportation and Regional 48,982 million yen for ongoing projects such as the continuous grade-separation works between Nakai and Nogata stations and on the Higashi Murayama station area, Real Estate 44,320 million yen for the acquisition of new properties through the capital recycling business, Other 5,140 million yen and adjustments 2,477 million yen. Depreciation was 56,156 million yen. Cash flows from operating activities were 1,528 million yen, cash flows from investing activities were an outflow of 145,757 million yen and free cash flow was an outflow of 144,228 million yen. Cash and cash equivalents at the end of the period were 56,107 million yen, after the elimination of the temporary increase caused by the securitization of Tokyo Garden Terrace Kioicho.
Non-Financial KPIs
CO2 emissions (Scope 1, 2) in FY2024 were 55.6% below FY2018 levels and 27.5% below FY2023 levels, against a long-term target of net zero emissions in FY2050 and medium-term targets of a 77% reduction from FY2018 levels by FY2040 and a 73% reduction by FY2035. The ratio of company-owned land in areas for environmental conservation was 21.4%, or 21.44 million square metres, at the end of March 2026, against an FY2030 target of 30% of all company-owned land, or 30 million square metres. The engagement score covering all Group companies in Japan was B 50.1 in February 2026, up from B 49.4 in July 2025 and CCC 47.5 in FY2024, against a target of A 58.0. Three facilities were awarded Five Stars by Forbes Travel Guide 2026, and the population along the Seibu Rail Line was 5.60 million people as of March 2026.
This article is an analysis based on publicly available information and is not a recommendation to buy or sell any specific securities. Investment decisions are your own responsibility.
![[Obayashi] Investors’ Guide 2026 — The Complete 24-Article Breakdown](https://japan-equity.com/wp-content/uploads/2026/07/hub_cover-1024x1024.png)
![[Obayashi] IR & SR Policy — Feeding Dialogue Back into Management](https://japan-equity.com/wp-content/uploads/2026/07/p32_sq-1024x1024.jpg)
![[Obayashi] Domestic Civil Engineering — Resilience Spending Supports 9.6% Margin](https://japan-equity.com/wp-content/uploads/2026/07/p11_sq-1024x1024.jpg)
![[Obayashi] Overseas Construction — Orders Reach ¥1.2tn](https://japan-equity.com/wp-content/uploads/2026/07/p15_sq-1024x1024.jpg)
![[Obayashi] Share Price & External Ratings — vs TOPIX, ESG Index Inclusion](https://japan-equity.com/wp-content/uploads/2026/07/p40_sq-1024x1024.jpg)
![[Construction] ¥75.5tn Investment, Shrinking Workforce — Big-5 Market Share](https://japan-equity.com/wp-content/uploads/2026/07/p12_sq-1024x1024.jpg)



![[Obayashi] Capital Policy & Shareholder Returns — ROE 10%+, DOE ~5%, ¥100bn Buyback](https://japan-equity.com/wp-content/uploads/2026/07/p27_sq-1024x1024.jpg)
![[Obayashi] Reducing Cross-Shareholdings — ¥285.2bn Sold in Five Years](https://japan-equity.com/wp-content/uploads/2026/07/p29_sq-1024x1024.jpg)
![[Obayashi] ¥750bn Investment Plan — ¥300bn to Development, ¥190bn to Tech/DX](https://japan-equity.com/wp-content/uploads/2026/07/p30_sq-1024x1024.jpg)
![[Obayashi] MTP2022 KPIs — Operating Profit ~2x Target, ROE 14.4%](https://japan-equity.com/wp-content/uploads/2026/07/p25_sq-1024x1024.jpg)
![[Obayashi] Cash Allocation — ¥420bn Investment CF Over Five Years](https://japan-equity.com/wp-content/uploads/2026/07/p26_sq-1024x1024.jpg)
![[Obayashi] Green Energy — 44 Plants, 344MW, and the Green Hydrogen Challenge](https://japan-equity.com/wp-content/uploads/2026/07/p21_sq-1024x1024.jpg)
![[Obayashi] Tackling the Labor Shortage — Robotics Construction®](https://japan-equity.com/wp-content/uploads/2026/07/p14_sq-1024x1024.jpg)
